. 2024 Nov 4;15(1):9517.
doi: 10.1038/s41467-024-53689-1.

Genetic risk factors underlying white matter hyperintensities and cortical atrophy

Affiliations

Genetic risk factors underlying white matter hyperintensities and cortical atrophy

Yash Patel et al. Nat Commun. .

Abstract

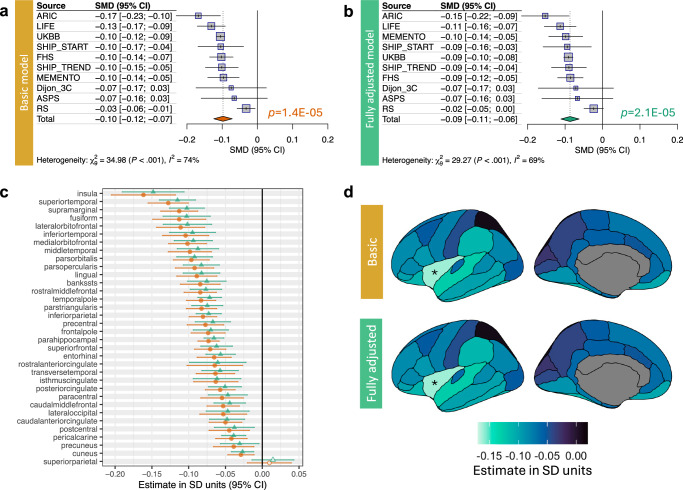
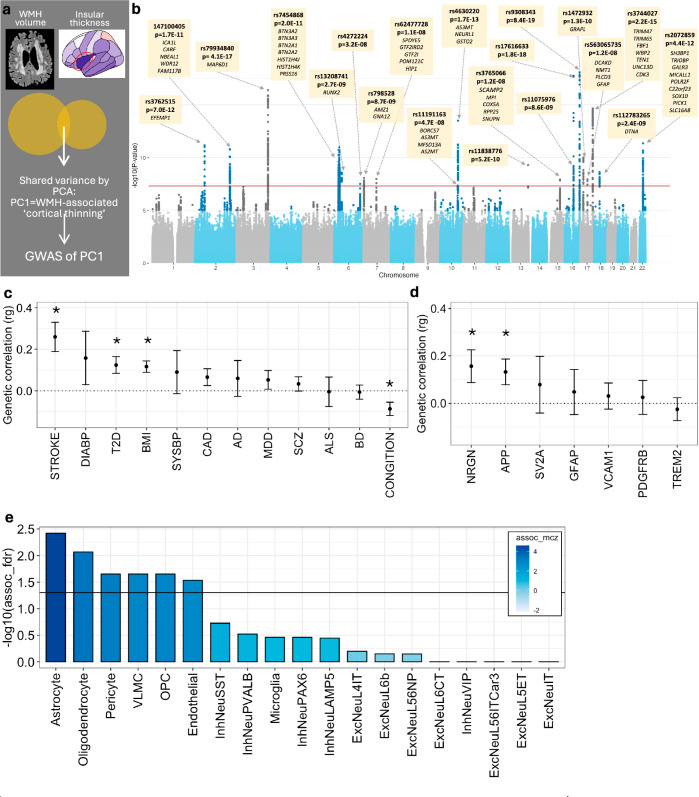
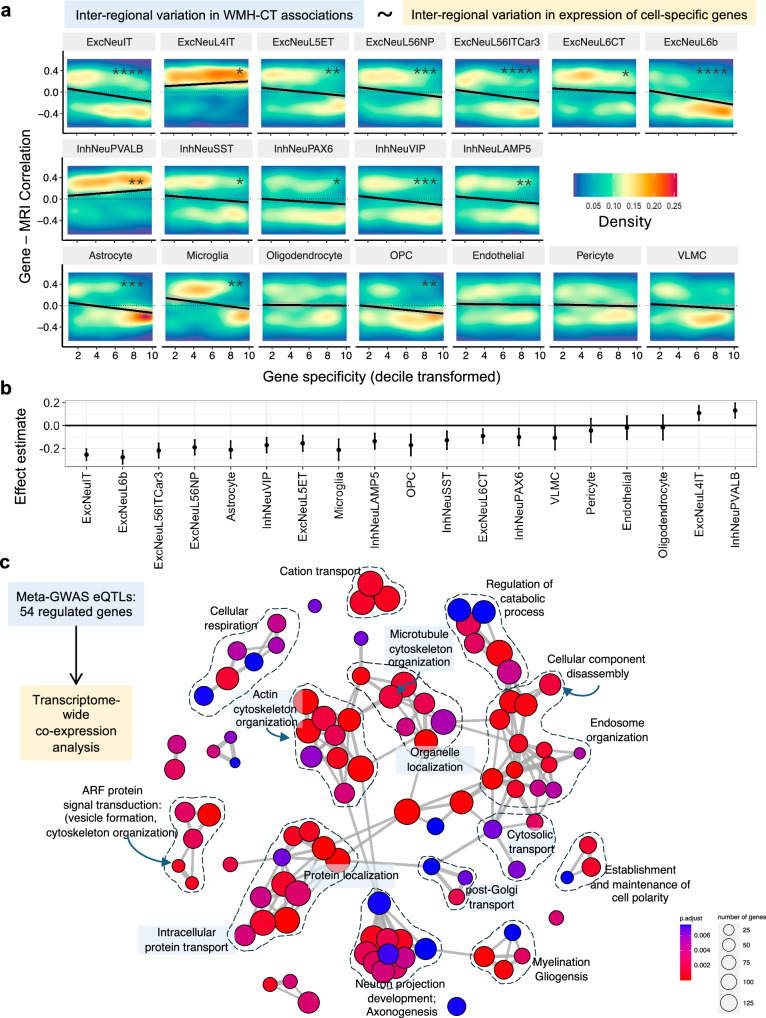
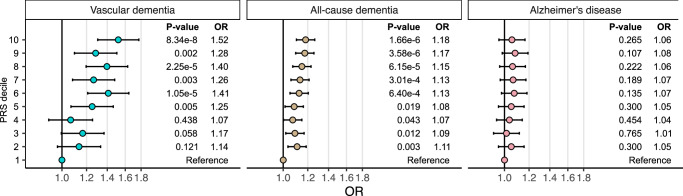
White matter hyperintensities index structural abnormalities in the cerebral white matter, including axonal damage. The latter may promote atrophy of the cerebral cortex, a key feature of dementia. Here, we report a study of 51,065 individuals from 10 cohorts demonstrating that higher white matter hyperintensity volume associates with lower cortical thickness. The meta-GWAS of white matter hyperintensities-associated cortical 'atrophy' identifies 20 genome-wide significant loci, and enrichment in genes specific to vascular cell types, astrocytes, and oligodendrocytes. White matter hyperintensities-associated cortical 'atrophy' showed positive genetic correlations with vascular-risk traits and plasma biomarkers of neurodegeneration, and negative genetic correlations with cognitive functioning. 15 of the 20 loci regulated the expression of 54 genes in the cerebral cortex that, together with their co-expressed genes, were enriched in biological processes of axonal cytoskeleton and intracellular transport. The white matter hyperintensities-cortical thickness associations were most pronounced in cortical regions with higher expression of genes specific to excitatory neurons with long-range axons traversing through the white matter. The meta-GWAS-based polygenic risk score predicts vascular and all-cause dementia in an independent sample of 500,348 individuals. Thus, the genetics of white matter hyperintensities-related cortical atrophy involves vascular and neuronal processes and increases dementia risk.


Conflict of interest statement

H.J.G. has received travel grants and speaker honoraria from Neuraxpharm, Servier, Indorsia and Janssen Cilag. All the other authors declare no competing interests.

Figures

Fig. 1
Fig. 1. Association between white matter hyperintensities and cortical thickness.
Forrest plot and meta-analytic summary statistic for the effect of WMH volume on mean cortical thickness within a baseline- (a) and fully-covariate adjusted model, including vascular risk factors (b). Meta-analytic effect sizes of WMH-cortical thickness association per cortical region are shown as a forest plot (c) and plotted on the surface of the cerebral cortex using ggseg (d). For (ac), two-sided t tests were used to evaluate the null hypothesis of no WMH-cortical thickness association; results with FDR-corrected p-values (adjusted for regions and models) less than 0.05 are marked by solid diamonds; and error bars represent 95% confidence intervals. The exact p-values are available in the Source Data.
Fig. 2
Fig. 2. Genetic underpinnings of the WMH-cortical thickness association.
a Schematic representation of the shared variance between WMH volume and insular cortical thickness captured via principal component 1 (PC1). b Summary statistics of the meta-GWAS of PC1. A two-sided Wald test was used to evaluate the null hypothesis of no SNP-PC1 association. The genome-wide significance level of 5e-08 is indicated by the red horizontal line. Each independent genome-wide significant variant is annotated, and its cis-eQTL-regulated genes are listed below variant rsID. The exact p-values are available in Supplementary Data 2. c LD-score regression estimates between the GWAS of PC1 and vascular risk factors, and neurodegenerative/psychiatric traits (error bars represent standard error, * p < 0.05, two-sided test). d LD-score regression between GWAS of PC1 and plasma protein levels of select neurodegeneration-related markers (error bars represent standard error, * nominal p < 0.05, two-sided test). e Cell-type-specific enrichment of polygenic signals from the GWAS of PC1, using single-cell disease relevance score testing. Filled in colour represents Monte Carlo-based Z statistics. DIAB Diastolic Blood Pressure, T2D Type 2 Diabetes, BMI Body Mass Index, SYSBP Systolic Blood Pressure, CAD Coronary Artery Disease, AD Alzheimer’s Disease, MDD Major Depressive Disorder, SCZ Schizophrenia, BD Bipolar Disorder, NRGN neurogranin, APP amyloid precursor protein, SV2A Synaptic vesicle protein 2, GFAP Glial fibrillary acidic protein, VCAM1 Vascular cell adhesion protein 1, PDGFRB platelet-derived growth factor receptor beta, TREM2 Triggering receptor expressed on myeloid cells 2. These genes were a priori selected as related to biomarkers of neurodegeneration. For (ce), the exact p-values are available in the Source Data.
Fig. 3
Fig. 3. Cell types in the cerebral cortex mediating the WMH-cortical thickness association.
a Results from cell-type enrichment analysis across the cerebral cortex. Association between gene specificity for a given cell type (x-axis) and the gene’s correlation coefficient between its expression and effect sizes of the WMH-cortical thickness association across the 34 cortical regions. The black line represents linear regression fit, and the colour represents the density of data points. b Effect sizes and confidence intervals from this cell-type enrichment analysis using a Pearson’s correlation coefficient (two-sided p-value). c Gene ontology enrichment analysis of genes co-expressed with genes regulated by genome-wide significant variants from the GWAS of PC1. Each node represents a significant biological process. Clusters of terms with high similarity are linked by edges, and manually annotated with an overarching/representative biological process ExcNeu excitatory neuron, InhNeu inhibitory neuron, OPC oligodendrocyte precursor cell, VLMC vascular leptomeningeal cells; FDR corrected p-values **** < 0.5 × 10−10, *** < 0.5 × 1006, ** < 0.5 × 1004, * < 0.5 × 102; and the exact p-values are available in the Source Data.
Fig. 4
Fig. 4. Association between polygenic risk score (PRS) of WMH and insular thickness-derived PC1 and the risk of each vascular dementia, all-cause dementia, and late-onset Alzheimer’s disease.
The odds ratios were calculated in FinnGen (consisting of a total of 500, 348 individuals) by comparing each of the top nine PRS deciles to the lowest decile and adjusting for age, sex, the first 10 genetic principal components and genotyping arrays. Error bars represent 95% confidence intervals. The exact p-values are available in the Source Data.

References

    1. Wardlaw, J. M., Smith, C. & Dichgans, M. Small vessel disease: mechanisms and clinical implications. Lancet Neurol.18, 684–696 (2019). - PubMed
    1. Ter Telgte, A. et al. Cerebral small vessel disease: from a focal to a global perspective. Nat. Rev. Neurol.14, 387–398 (2018). - PubMed
    1. Wardlaw, J. M., Valdés Hernández, M. C. & Muñoz-Maniega, S. What are White Matter Hyperintensities Made of? J. Am. Heart Assoc.4, e001140 (2015). - PMC - PubMed
    1. Debette, S., Schilling, S., Duperron, M.-G., Larsson, S. C. & Markus, H. S. Clinical significance of magnetic resonance imaging markers of vascular brain injury: a systematic review and meta-analysis. JAMA Neurol.76, 81–94 (2019). - PMC - PubMed
    1. Sargurupremraj, M. et al. Genetic complexities of cerebral small vessel disease, blood pressure, and dementia. JAMA Netw. Open7, e2412824 (2024). - PMC - PubMed

Publication types

LinkOut - more resources