. 2024 Nov 4;14(1):26663.
doi: 10.1038/s41598-024-76715-0.

Bioclimatic and masticatory influences on human cranial diversity verified by analysis of 3D morphometric homologous models

Affiliations

Bioclimatic and masticatory influences on human cranial diversity verified by analysis of 3D morphometric homologous models

Hirofumi Matsumura et al. Sci Rep. .

Abstract

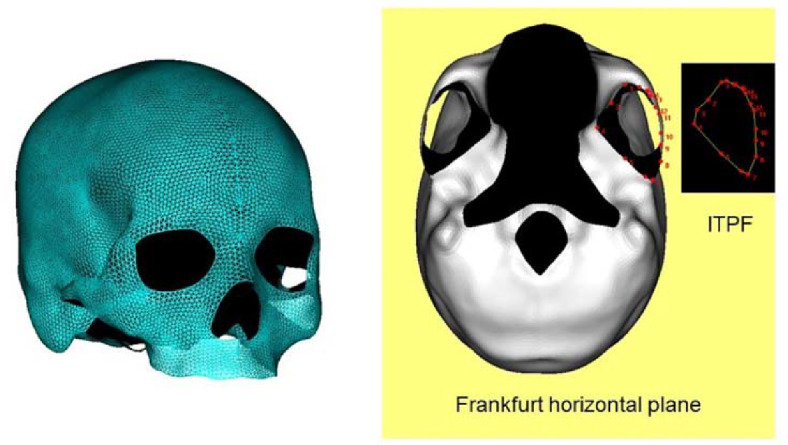
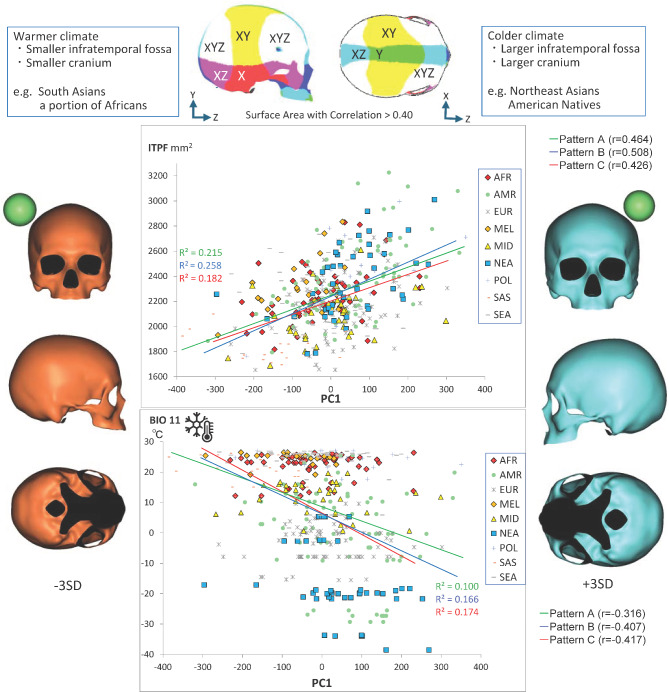
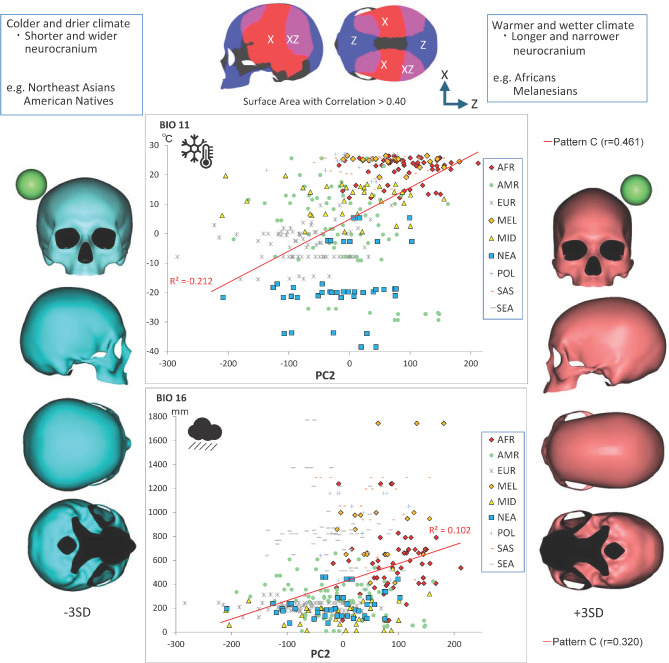
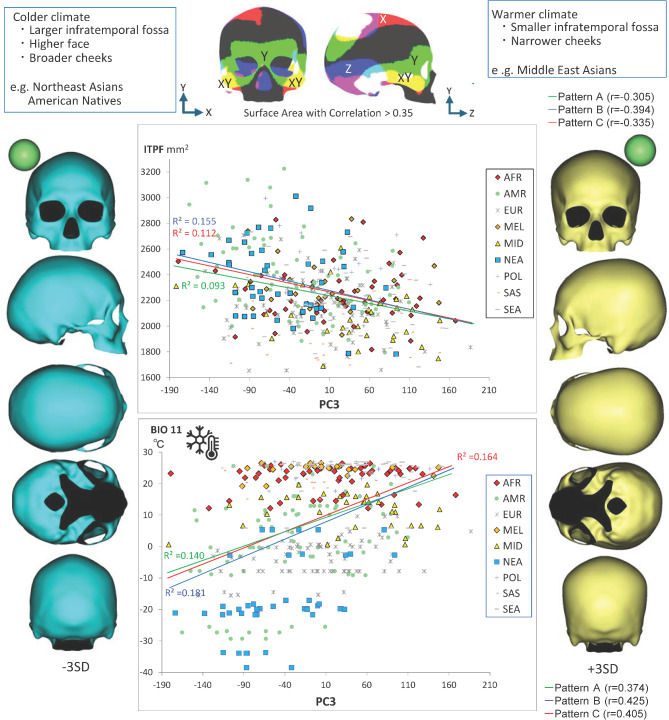
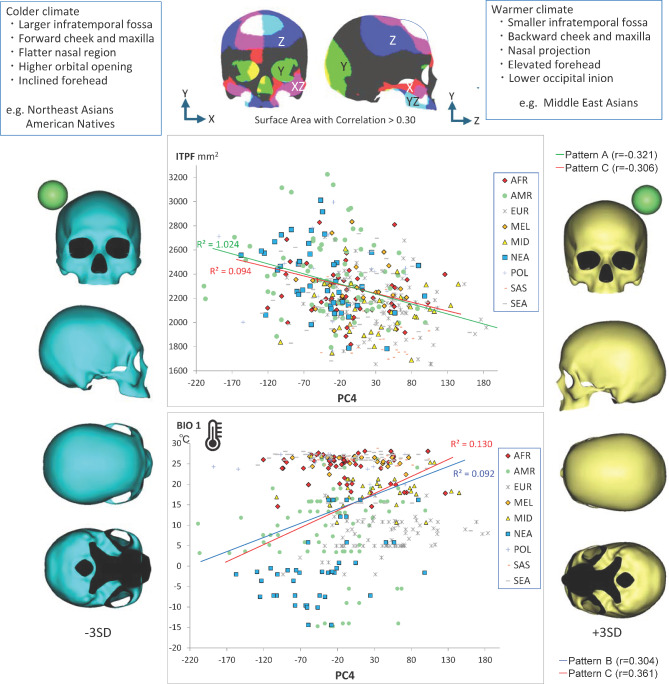
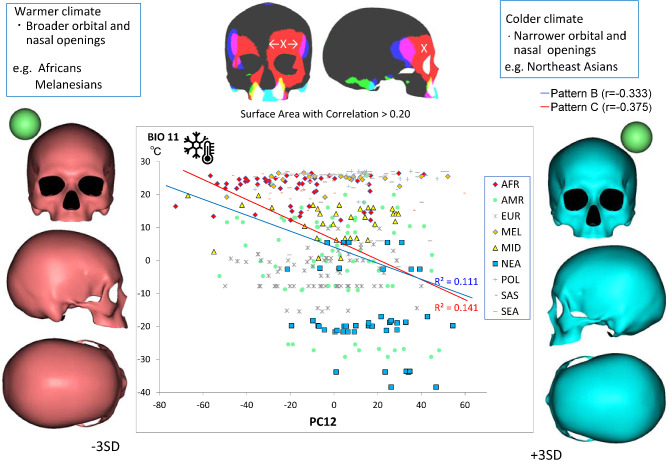
This study analyzes the effects of bioclimate and masticatory factors on the regional variability of human cranial forms across 150 ethnic groups worldwide. Morphometric variables were generated using principal component analysis applied to 3D homologous models. Relationships between cranial form and bioclimate (temperature and precipitation) and masticatory factors (infratemporal space) were tested considering sampling bias due to past population movements during the late Pleistocene and/or early- to mid-Holocene. Cranial size correlated with thermal conditions, consistent with Bergmann's rule. The length/breadth proportion of the neurocranium aligned with Allen's rule for thermal adaptation, while no relationship with masticatory stress was found. Facial form responded to either climate or masticatory conditions, although the primary factor was unclear due to the high correlation between stresses. However, masticatory stress was identified as an equally significant factor behind facial flatness in cold regions, else than the effect of Allen's rule. High narrowness of nasal and orbital openings correlated significantly with cold temperatures and cranial size, suggesting not only functional but also allometric effect. This study demonstrated the complexity of environmental influences on cranial form diversity, nonetheless suggested reduction of selective pressure on cranial form caused by natural environmental stress due to the development of civilization.

Keywords: 3D homologous; Adaptation; Climate; Human crania; Masticatory; Morphometric.


Conflict of interest statement

The authors declare no competing interests.

Figures

Fig. 1
Fig. 1
An example of homologous fitting model of 3D-scanned crania, and the measured projected area of infratemporal fossa (ITPF) on the Frankfurt horizontal plane (data consist of the summed area from both sides).
Fig. 2
Fig. 2
The regression lines between PC1 scores and bioclimate and/or masticatory variables: the area of infratemporal fossa (ITPF) and the mean temperature of the coldest quarter (BIO 11). The color map of the cranial surface at the top of the graph indicates vertices highly correlated with PC1. Virtual shapes with PC1 scores of ± 3 SD are also shown. The scale is given as a green colored sphere with a diameter of 50 mm. Abbreviations: see Tables 1 and 2.
Fig. 3
Fig. 3
The regression lines between PC2 scores and bioclimate variables: the mean temperature of the coldest quarter (BIO 11) and mean precipitation of the wettest quarter (BIO 16). The color map of the cranial surface at the top of the graph indicates vertices highly correlated with PC2. Virtual shapes with PC2 scores of ± 3 SD are also shown. The scale is given as a green colored sphere with a diameter of 50 mm. Abbreviations: see Tables 1 and 2.
Fig. 4
Fig. 4
The regression lines between PC3 scores and bioclimate and/or masticatory variables: the area of infratemporal fossa (ITPF) and the mean temperature of the coldest quarter (BIO 11). The color map of the cranial surface at the top of the graph indicates vertices highly correlated with PC3. Virtual shapes with PC3 scores of ± 3 SD are also shown. The scale is given as a green colored sphere with a diameter of 50 mm. Abbreviations: see Tables 1 and 2.
Fig. 5
Fig. 5
The regression lines between PC4 scores and bioclimate and/or masticatory variables: the area of infratemporal fossa (ITPF) and the annual mean temperature (BIO 1). The color map of the cranial surface at the top of the graph indicates vertices highly correlated with PC4. Virtual shapes with PC4 scores of ± 3 SD are also shown. The scale is given as a green colored sphere with a diameter of 50 mm. Abbreviations: see Tables 1 and 2.
Fig. 6
Fig. 6
The regression lines between PC12 scores and bioclimate variables: the mean temperature of the coldest quarter (BIO 11). The color map of the cranial surface at the top of the graph indicates vertices highly correlated with PC12. Virtual shapes with PC12 scores of ± 3 SD are also shown. The scale is given as a green colored sphere with a diameter of 50 mm. Abbreviations: see Tables 1 and 2.

Similar articles

Cited by

References

    1. Lacruz, R. S. et al. The evolutionary history of the human face. Nat. Ecol. Evol.3, 726–736. 10.1038/s41559-019-0865-7 (2019). - PubMed
    1. Wolpoff, M. H. Climatic influence on the skeletal nasal aperture. Am. J. Phys. Anthropol.29, 405–423. 10.1002/ajpa.1330290315 (1968). - PubMed
    1. Beals, K. L. Head form and climatic stress. Am. J. Phys. Anthropol.37, 85–92. 10.1002/ajpa.1330370111 (1972). - PubMed
    1. Beals, K. L., Smith, C. L. & Dodd, S. M. Climate and the evolution of brachycephalization. Am. J. Phys. Anthropol.62, 425–437. 10.1002/ajpa.1330620407 (1983). - PubMed
    1. Beals, K. L. et al. Brain size, cranial morphology, climate, and time machines [and comments and reply]. Curr. Anthropol.25, 301–330. 10.1086/203138 (1984).

LinkOut - more resources