. 2024 Nov 4;14(1):26617.
doi: 10.1038/s41598-024-77630-0.

Effect of fibroblast heterogeneity on prognosis and drug resistance in high-grade serous ovarian cancer

Affiliations

Effect of fibroblast heterogeneity on prognosis and drug resistance in high-grade serous ovarian cancer

Tingjie Wang et al. Sci Rep. .

Abstract

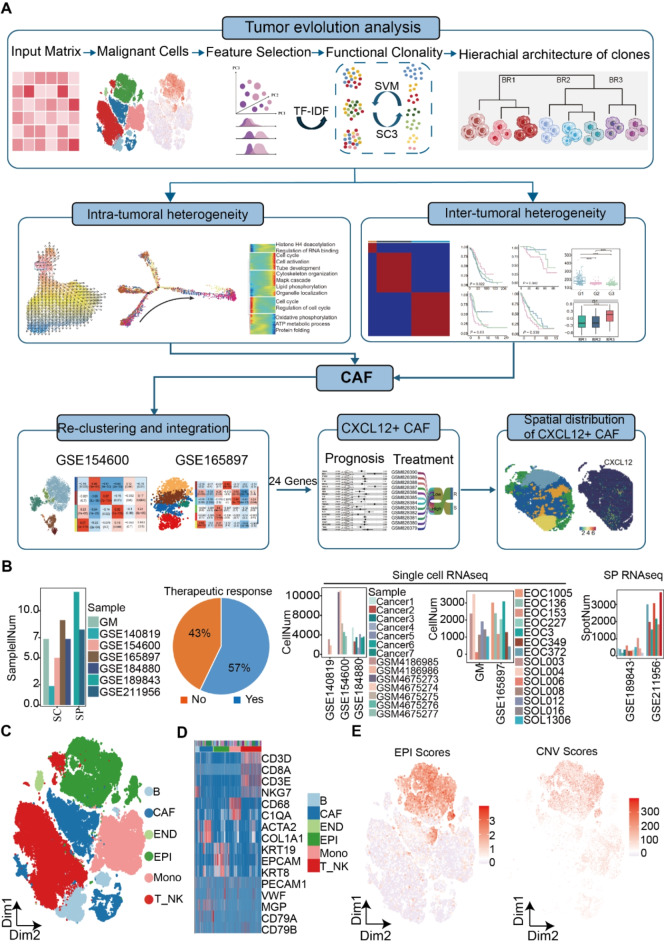
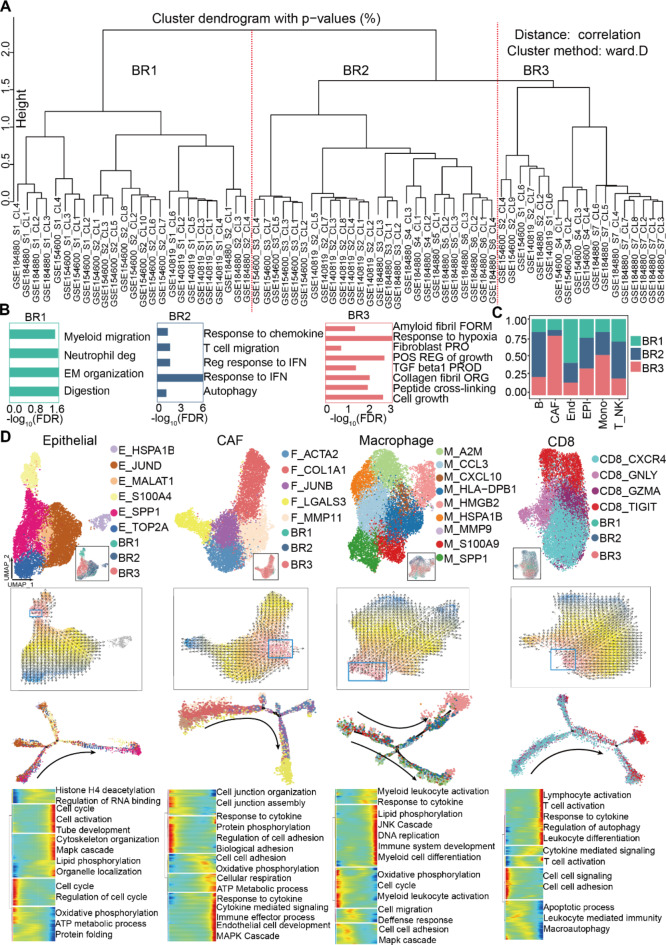
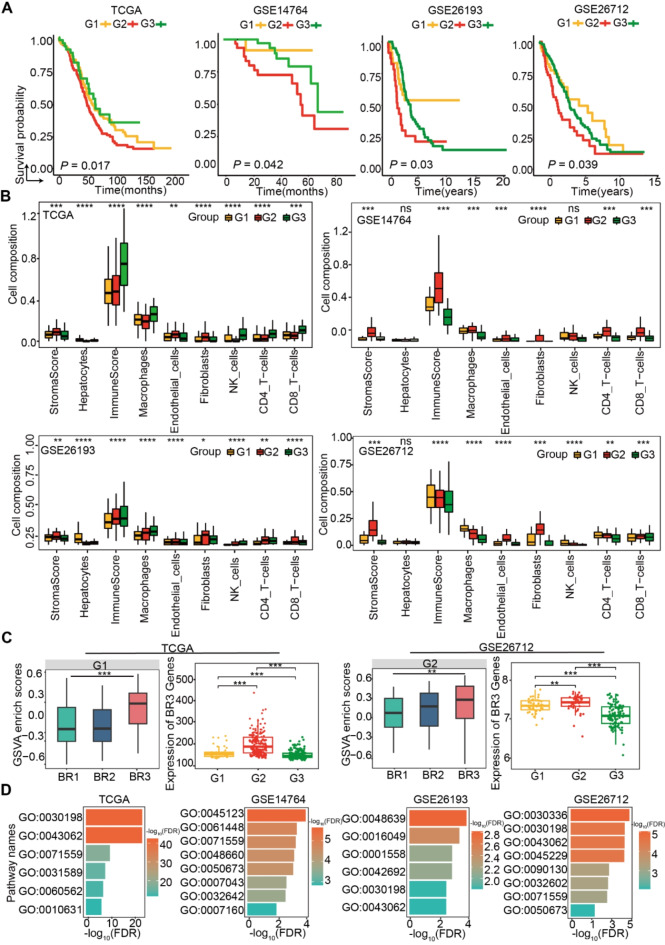
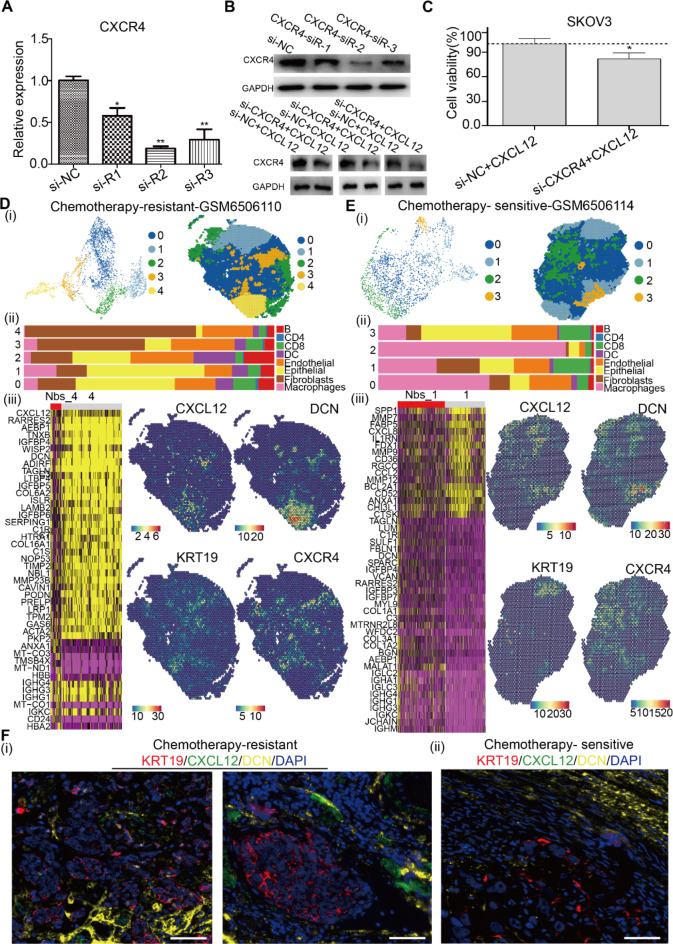
Tumor heterogeneity is associated with poor prognosis and drug resistance, leading to therapeutic failure. Here, we used tumor evolution analysis to determine the intra- and intertumoral heterogeneity of high-grade serous ovarian cancer (HGSOC) and analyze the correlation between tumor heterogeneity and prognosis, as well as chemotherapy response, through single-cell and spatial transcriptomic analysis. We collected and curated 28 HGSOC patients' single-cell transcriptomic data from five datasets. Then, we developed a novel text-mining-based machine-learning approach to deconstruct the evolutionary patterns of tumor cell functions. We then identified key tumor-related genes within different evolutionary branches, characterized the microenvironmental cell compositions that various functional tumor cells depend on, and analyzed the intra- and intertumoral heterogeneity as well as the tumor microenvironments. These analyses were conducted in relation to the prognosis and chemotherapy response in HGSOC patients. We validated our findings in two spatial and seven bulk transcriptomic datasets (total: 1,030 patients). Using transcriptomic clusters as proxies for functional clonality, we identified a significant increase in tumor cell state heterogeneity that was strongly correlated with patient prognosis and treatment response. Furthermore, increased intra- and intertumoral functional clonality was associated with the characteristics of cancer-associated fibroblasts (CAFs). The spatial proximity between CXCL12-positive CAFs and tumor cells, mediated through the CXCL12/CXCR4 interaction, was highly positively correlated with poor prognosis and chemotherapy resistance in HGSOC. Finally, we constructed a panel of 24 genes through statistical modeling that correlate with CXCL12-positive fibroblasts and can predict both prognosis and the response to chemotherapy in HGSOC patients. Our study offers insights into the collective behavior of tumor cell communities in HGSOC, as well as potential drivers of tumor evolution in response to therapy. There was a strong association between CXCL12-positive fibroblasts and tumor progression, as well as treatment outcomes.

Keywords: CXCL12; HGSOC; Tumor cell state; cancer-associated fibroblasts; functional clonality; microenvironment; spatiotemporal transcriptome; tumor evolution; tumor transcriptomic heterogeneity.


Conflict of interest statement

The authors declare no competing interests.

Figures

Fig. 1
Fig. 1
High-grade serous ovarian cancer transcriptome atlas. (A) Schematic depicting the study design. (B) Number of samples in the tumor evolution analysis of high-grade serous ovarian cancer (HGSOC). Pie chart showing the proportions of clinical treatments in the tumor evolution analysis. Number of cells and spots in the scRNA-seq datasets. (C) The t-distributed stochastic neighbor embedding (t-SNE) plots showing the major cell types in HGSOC. Clusters are distinguished by color. (D) Heatmap showing cell-type marker gene expression level in the first single-cell dataset. (E) Expression profile of epithelial cells and tumor scores in the first single-cell dataset. The colors from gray to red represent the expression level from low to high.
Fig. 2
Fig. 2
Tumor branching evolution reveals intratumor heterogeneity in high-grade serous ovarian cancer. (A) Tumor phylogenetic tree constructed by hierarchical clustering of all the clusters from 14 tumors, in which BR1, BR2, and BR3 were defined according to the hierarchical relationship. (B) Bar plot showing enrichment analysis using the tumor branch evolution features via clusterProfiler. FOR: Formation, PRO: proliferation, ORG: organization, POS REG: positive regulation. (C) Bar plot showing the sample origins of three subtypes of branching evolution. (D) Distribution characteristics of intratumoral cell types obtained through tumor evolutionary analysis. Profile and uniform manifold approximation and projection (UMAP) plots showing the cell-type subgroups in the epithelial, CAF, macrophage, and CD8 cells (top). Velocity and single-cell trajectory results (rows 2 and 3) and differentially expressed genes (rows) along the pseudo-time (columns) were clustered hierarchically into five groups in the scRNA-seq dataset. Pathway enrichment scores were calculated using clusterProfiler.
Fig. 3
Fig. 3
Tumor branching evolution reveals that intertumoral heterogeneity and the proportion of fibroblasts promote the poor prognosis of high-grade serous ovarian cancer. (A) Overall survival curves showing the prognosis of the three subtypes (G1, G2, and G3) obtained from non-negative matrix factorization (NMF) clustering using the 150 tumor evolution features in TCGA and GEO cohorts. (B) Boxplots showing the immune cell infiltrates ratio in the three distinct malignant subtypes in the significantly enriched patients via xCell (ns, not significant, *P < 0.05, **P < 0.01, and ***P < 0.001). Pairwise comparisons were conducted using the Wilcoxon rank-sum test in the RNA cohort. For the boxplot, the centerline represents the median, and the box limits represent the upper and lower quartiles. (C) Boxplot showing the GSVA enrichment scores in the poorest prognosis using the branch features of tumor evolution analysis in scRNA datasets. Boxplots showing the mean expression level of BR3 genes in the three subtypes of bulk RNA datasets. ns, not significant, *P < 0.05, **P < 0.01, and ***P < 0.001 by Wilcoxon rank-sum test. (D) GO enrichment analysis of upregulated genes of the poorest prognosis group (G1 in TCGA; G2 in the other cohorts). GO:0030198: Extracellular matrix organization, GO:0043062:extracellular structure organization, GO:0071559: Response to transforming growth factor beta, GO:0031589: Cell-substrate adhesion, GO:0060562: Epithelial tube morphogenesis, GO:0010631: Epithelial cell migration, GO:0045123: Cellular extravasation, GO:0061448: Connective tissue development, GO:0048660: Regulation of smooth muscle cell proliferation, GO:0050673: Epithelial cell proliferation, GO:0007043: Cell-cell junction assembly, GO:0032642: Regulation of chemokine production, GO:0007160: Cell-matrix adhesion, GO:0048639: Positive regulation of developmental growth, GO:0016049: Cell growth, GO:0001558: Regulation of cell growth, GO:0042692: Muscle cell differentiation, GO:0030336: Negative regulation of cell migration, GO:0045229: External encapsulating structure organization, GO:0090130: Tissue migration, GO:0032602: Chemokine production.
Fig. 4
Fig. 4
Intra- and intertumoral heterogeneity of cancer-associated fibroblasts. (A) Tumor phylogenetic tree constructed by hierarchical clustering using the 150 branch genes. (B) UMAP plot showing the major cell types in dataset GSE154600. (C) Bar plot showing the origins of cell types in three subtypes of branching evolution. (D) UMAP plot showing the subtypes of cancer-associated fibroblasts (CAFs). (E) Bar plot showing the origins of CAFs in the three evolutionary subtypes. (F) WGCNA results showing the gene modules in distinct CAF subtypes. Columns represent cell types. The colors from blue to red indicate low to high correlation between the gene module and cell subtypes (Pearson correlation test). (G) GO enrichment analysis of hub genes of the BR3 enrichment subtype (F_CXCL12). (H) Number of significant ligand-receptor pairs between CAF and epithelial subtypes. The edge width is proportional to the indicated number of ligand-receptor pairs. EPI_1, epithelial subtype with high expression of MMP7 and ELF3; EPI_3, epithelial subtype with high expression of HES1 and CD24. (I) Dot plot showing the ligand-receptor pairs between CAFs and epithelial cells. Rows represent the ligand receptor (L-R) pairs, and columns represent cell subset–cell subset pairs. The color gradient from black/blue to red indicates the mean values of the L–R pairs from low to high, and the circle size indicates the significance of the pairs. P-values were calculated via a permutation test using CellChat.
Fig. 5
Fig. 5
Heterogeneity of cancer-associated fibroblasts is associated with chemotherapy treatment outcomes. (A) Platinum-free interval values in the three tumor evolution branches in dataset GSE165897. (B) UMAP (i) and bar plot (ii) showing the major cell types and their origin. (C) Volcano plot showing the differential genes for cancer-associated fibroblast (CAF) subtypes. Upregulated genes are indicated in red, while downregulated ones are indicated in blue. The X-axis represents the log2 fold change, and the Y-axis represents the single-cell clustering information. (D) UMAP(i) and bar plot (ii) showing the subtypes and origins of CAFs. Scatter plot showing the expression level of marker genes (iii). (E) WGCNA results showing the gene modules of distinct CAF subtypes in GSE165897. (F) Heatmap showing the CAF subtype correlation between datasets GSE154600 and GSE165897.
Fig. 6
Fig. 6
Correlation between 24 genes of CXCL12-positive fibroblasts and prognosis and drug resistance in high-grade serous ovarian cancer. (A) Forest plot showing the risk prognosis results from 24 shared CXCL12-positive fibroblasts obtained from two single-cell samples via COX regression in GSE14764. (B) Overall survival curves showing the prognosis results with different cancer-associated fibroblast (CAF) risk scores in the four high-grade serous ovarian cancer cohorts. In this analysis, for Fig. 6B, we first identified 24 signature genes associated with CXCL12-positive CAF cells. We then applied the COX regression coefficients obtained from Fig. 6A to compute a risk score for each patient. Using the median risk score as the cutoff, we divided the patients into high-risk and low-risk groups. To assess the prognostic significance, we employed the log-rank test to calculate the p-value, thereby verifying that patients with high expression of CXCL12-positive CAF genes have poorer prognoses. (C) We performed a log-rank test to calculate the p-values and assess the correlation between genes identified in the dataset GSE14764 in Fig. 6A (DCN, CXCL12 and TNFAIP6) that are most strongly associated with poor prognosis in relation to CXCL12-positive CAFs. We conducted the prognostic analysis using 1,232 serous OV patients’ data available on the https://kmplot.com/analysis, by selecting the median expression level of each gene as the cutoff. (D) Box plot showing the Friends analysis results. (E) AUC and Sankey diagram showing the prediction of chemotherapy resistance using the 24 CXCL12 positive CAFs genes. R, chemotherapy resistant. S, chemotherapy sensitive.
Fig. 7
Fig. 7
Function and spatial distribution characteristics of CXCL12-positive fibroblasts. (A) The bar chart showing the silencing effect of the CXCL12 receptor gene CXCR4 (ns, not significant, *P < 0.05, **P < 0.01, and ***P < 0.001 by t-test). (B) Western blot showing the silencing effect of CXCR4 and the expression levels of CXCR4 protein in the control and CXCR4-silenced groups after the addition of exogenous CXCL12 protein. (C) The CCK8 results show that silencing CXCR4 significantly inhibits the viability of tumor cells (*P < 0.05 by t-test). (i) Clustering and spatial distribution, (ii) cell type composition in each cluster, and (iii) gene profile around the tumor boundary in (D) chemotherapy-resistant samples and (E) chemotherapy-sensitive samples. (F) The multiplex immunofluorescence results show the spatial proximity relationship between fibroblasts and tumor cells in chemotherapy-resistant (i) and chemotherapy-sensitive (ii) and samples. Scale bars = 50 μm.

Similar articles

Cited by

References

    1. Coburn, S. B., Bray, F., Sherman, M. E. & Trabert, B. International patterns and trends in ovarian cancer incidence, overall and by histologic subtype. Int. J. Cancer140, 2451–2460. 10.1002/ijc.30676 (2017). - PMC - PubMed
    1. Chowdhury, S. et al. Proteogenomic analysis of chemo-refractory high-grade serous ovarian cancer. Cell186, 3476–3498. 10.1016/j.cell.2023.07.004 (2023). - PMC - PubMed
    1. Zheng, X. et al. Single-cell analyses implicate ascites in remodeling the ecosystems of primary and metastatic tumors in ovarian cancer. Nat. Cancer4, 1138–1156. 10.1038/s43018-023-00599-8 (2023). - PMC - PubMed
    1. Matthews, B. G., Bowden, N. A. & Wong-Brown, M. W. Epigenetic mechanisms and therapeutic targets in chemoresistant high-grade serous ovarian cancer. Cancers (Basel)13. 10.3390/cancers13235993 (2021). - PMC - PubMed
    1. Silva, R. et al. Unveiling the epigenomic mechanisms of acquired platinum-resistance in high-grade serous ovarian cancer. Int. J. Cancer153, 120–132. 10.1002/ijc.34496 (2023). - PubMed

MeSH terms

LinkOut - more resources