. 2024 Nov 4;7(1):1434.
doi: 10.1038/s42003-024-07167-5.

The evolutionary landscape of prokaryotic chromosome/plasmid balance

Affiliations

The evolutionary landscape of prokaryotic chromosome/plasmid balance

Wenzhi Xue et al. Commun Biol. .

Abstract

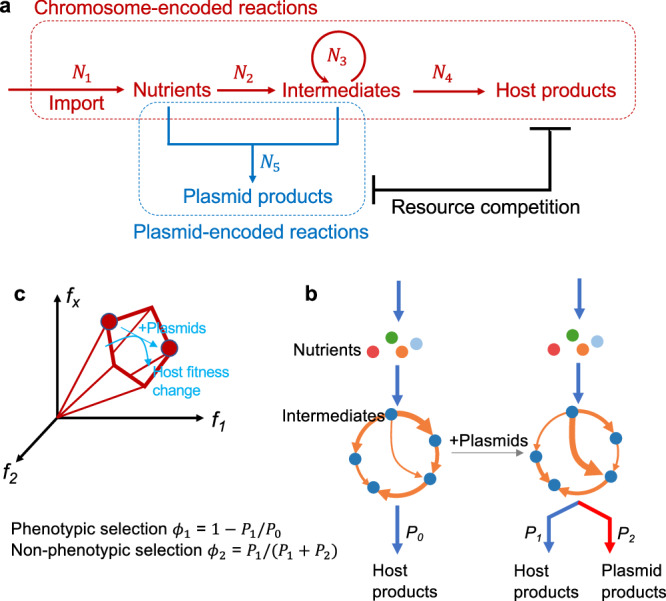
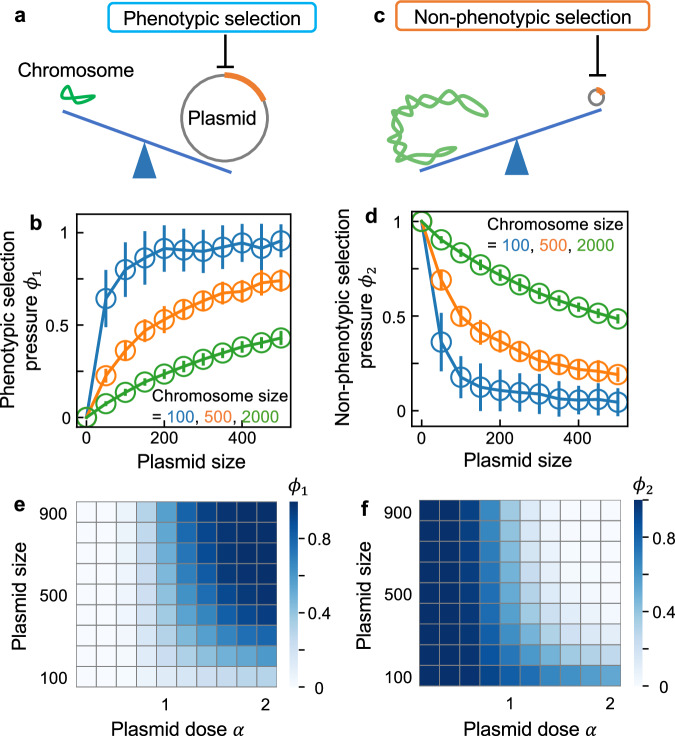
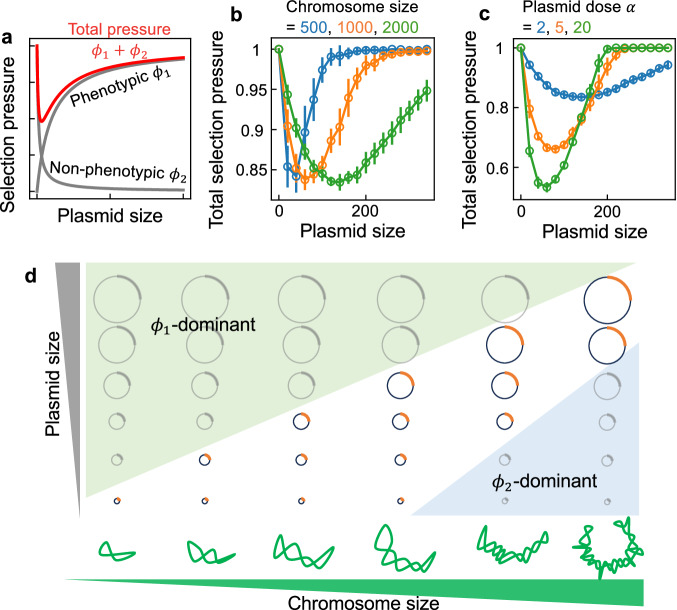
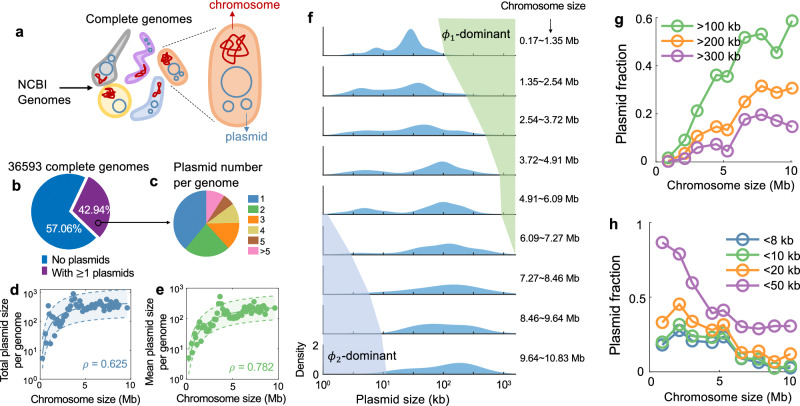
The balance between chromosomal and plasmid DNAs determines the genomic plasticity of prokaryotes. Natural selections, acting on the level of organisms or plasmids, shape the abundances of plasmid DNAs in prokaryotic genomes. Despite the importance of plasmids in health and engineering, there have been rare systematic attempts to quantitatively model and predict the determinants underlying the strength of different selection forces. Here, we develop a metabolic flux model that describes the intracellular resource competition between chromosomal and plasmid-encoded reactions. By coarse graining, this model predicts a landscape of natural selections on chromosome/plasmid balance, which is featured by the tradeoff between phenotypic and non-phenotypic selection pressures. This landscape is further validated by the observed pattern of plasmid distributions in the vast collection of prokaryotic genomes retrieved from the NCBI database. Our results establish a universal paradigm to understand the prokaryotic chromosome/plasmid interplay and provide insights into the evolutionary origin of plasmid diversity.


Conflict of interest statement

The authors declare no competing interests.

Figures

Fig. 1
Fig. 1. A mathematical model of the intracellular resource competition between chromosomal and plasmid genes.
a A schematic of the metabolic reactions encoded by chromosomes and plasmids. The model considers a cell as a network of biochemical reactions that involves nutrients, intermediates, host products, and plasmid products. The reactions were categorized into five classes, depending on the metabolite types involved. N1 to N5 represent the number of reactions in each class, respectively. The reactions in class 1 to 4 are encoded by chromosomes, while plasmids encode class 5. The size of a chromosome or plasmid determines the total number of reactions that the replicon encodes. b Quantification of phenotypic and non-phenotypic selection pressures. P0 and P1 represent the overall synthesis rates of host products without and with plasmids, respectively. Phenotypic selection pressure is defined as 1P0/P1, which describes to what extent host growth will be perturbed by plasmids. P2 stands for the overall synthesis rates of plasmid products. Non-phenotypic selection pressure can be measured by P1/P1+P2, which is associated with the capability of a plasmid to stably maintain itself. c Plasmid-encoded reactions compete for intermediates against chromosome-encoded reactions, leading to the redistribution of metabolic fluxes. f1, f2 and fx represent different fluxes. Constraints are imposed on the flux space: the net productions of all nutrients and intermediates equal zero. This confines the flux vector into a subspace (represented by the pentagon). The filled dots represent the solutions that optimize the objective functions.
Fig. 2
Fig. 2. The resource competition model predicts phenotypic and non-phenotypic selection pressures faced by prokaryotic plasmids.
a Phenotypic selection operates when plasmids impose large fitness burden on the host cells. b Coarse-grained relationships between phenotypic selection pressures and plasmid sizes. Data were shown as the mean ± standard deviations of 20 replicates. In each replicate, the structure of the metabolic network (involving 80 substances) and the configuration of the objective function were randomized. Different chromosome sizes (shown in different colors) were tested as examples. Here, chromosome or plasmid size is defined as the number of encoded reactions. Simulations were performed with α being 1. c Non-phenotypic selection operates when plasmids are incapable to stably maintain themselves against segregation loss. d Coarse-grained relationships between non-phenotypic selection pressures and plasmid sizes. Data were shown as the mean ± standard deviations of 20 replicates. e Phenotypic selection pressure can be promoted by increasing plasmid size or plasmid dose. Plasmid dose is associated with plasmid copy number. Simulations were performed with chromosome size being 2000. The number of metabolites was 80. Color density represents the mean value of 5 replicates. f Increasing plasmid size or plasmid dose reduces non-phenotypic selection pressure. Color density represents the mean value of 5 replicates.
Fig. 3
Fig. 3. The tradeoff between phenotypic and non-phenotypic selections shapes the chromosome/plasmid balance.
a The total selection pressure exhibits a biphasic change when plasmid size increases. Non-phenotypic selection plays a dominant role when plasmids are small, while large plasmids are primarily subject to phenotypic selection. Here, total selection pressure is calculated by summing up the two selective forces. Chromosome or plasmid size is defined as the number of encoded reactions. b The simulated relationship between total selection pressure and plasmid size when chromosome size varied. Data were presented as the mean ± standard deviations of 20 replicates. In each replicate, the structure of the metabolic network (involving 80 substances) and the configuration of the objective function were randomized. Three chromosome sizes were tested and shown as examples. c The simulated relationship between total selection pressure and plasmid size when plasmid dose varied. Data were presented as the mean ± standard deviations of 20 replicates. Three different α values were tested and shown as examples. d An illustrative summary of the evolutionary landscape of prokaryotic chromosome/plasmid balance. Chromosomes and plasmids are represented by twisted and round circles, respectively. The shaded area on the top-left corner represents the zone of strong phenotypic selection, while in the bottom-right corner, plasmids are subject to strong non-phenotypic selection.
Fig. 4
Fig. 4. Large-scale prokaryotic genome data validated the predicted evolutionary landscape.
a All the complete genomes of prokaryotes were retrieved from NCBI Genome dataset. b Among the 36,593 prokaryotic genomes, about 43% carry at least one plasmid. We only focused on the plasmid-carrying genomes in the following analysis. c The distribution of plasmid numbers in each genome. d Plasmid DNAs are enriched in prokaryotes with larger chromosomes. For each genome, we calculated the total amount of plasmid DNAs (TP). Then we divided the range of chromosome sizes into 80 bins with equal width. The average TP in each bin was calculated and plotted as a function of the mean chromosome size. The number of genomes in each bin ranges from 0 to 1344. Bins containing fewer than 10 genomes were deemed unrepresentative and not considered in the following analysis. The filled curve represents the fitting result using a first-order Hill function. The shaded area bounded with the dashed lines represents the 95% confidence interval. ρ stands for the Spearman’s correlation coefficient. e Prokaryotes with larger chromosomes in general contain larger plasmids. For each genome, we calculated the mean plasmid size (SP). Then the average SP in each bin was calculated and plotted as a function of the mean chromosome size. ρ stands for Spearman’s correlation coefficient. f The distribution of plasmid sizes in different ranges of chromosome sizes. Here, the range of chromosome sizes was divided into 10 bins with equal width. The number of genomes in each bin ranges from 75 to 15,308. g The fraction of large plasmids increases with chromosome size. Large plasmids were defined as plasmids with the sizes over a threshold. Three thresholds (100, 200, and 300 kb) were applied and shown in different colors. h The fraction of small plasmids decreases with chromosome size.

Similar articles

Cited by

References

    1. Rodríguez-Beltrán, J., DelaFuente, J., Leon-Sampedro, R., MacLean, R. C. & San Millan, A. Beyond horizontal gene transfer: the role of plasmids in bacterial evolution. Nat. Rev. Microbiol.19, 347–359 (2021). - PubMed
    1. San Millan, A. & MacLean, R. C. Fitness costs of plasmids: a limit to plasmid transmission. Microbiol. Spectr.5, 10.1128/microbiolspec. mtbp-0016-2017 (2017). - PMC - PubMed
    1. Werren, J. H. Selfish genetic elements, genetic conflict, and evolutionary innovation. Proc. Natl Acad. Sci. USA108, 10863–10870 (2011). - PMC - PubMed
    1. Carroll, A. C. & Wong, A. Plasmid persistence: costs, benefits, and the plasmid paradox. Can. J. Microbiol.64, 293–304 (2018). - PubMed
    1. Castañeda-Barba, S., Top, E. M. & Stalder, T. Plasmids, a molecular cornerstone of antimicrobial resistance in the One Health era. Nat. Rev. Microbiol.22, 18–32 (2023). - PubMed

LinkOut - more resources