. 2024 Dec;27(12):2326-2340.
doi: 10.1038/s41593-024-01794-1. Epub 2024 Nov 4.

Leveraging deep single-soma RNA sequencing to explore the neural basis of human somatosensation

Affiliations

Leveraging deep single-soma RNA sequencing to explore the neural basis of human somatosensation

Huasheng Yu et al. Nat Neurosci. 2024 Dec.

Abstract

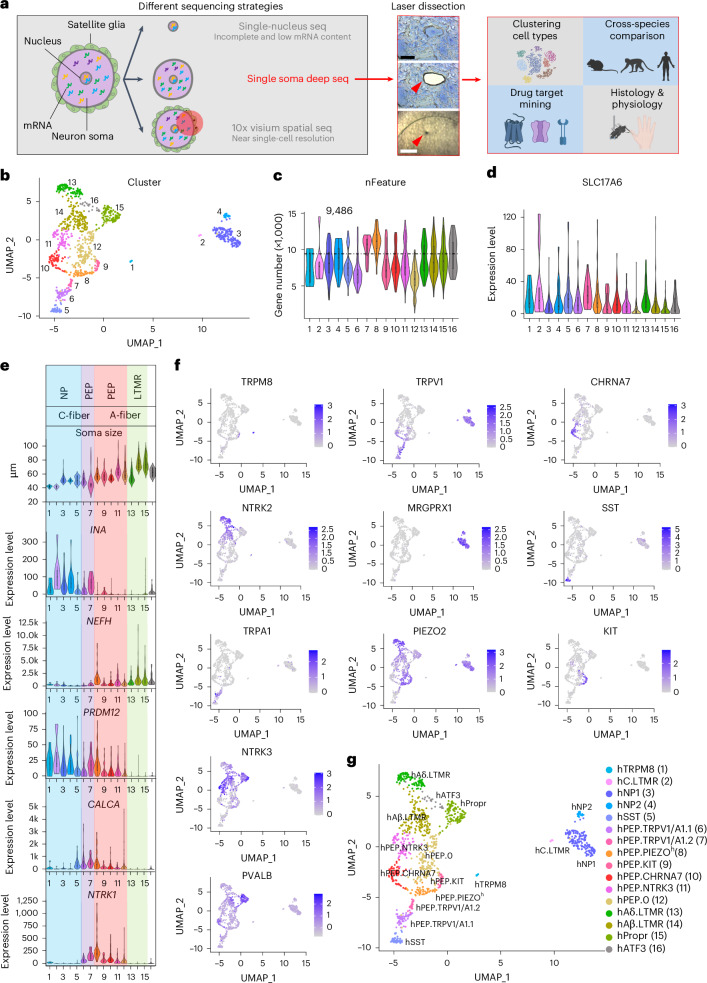
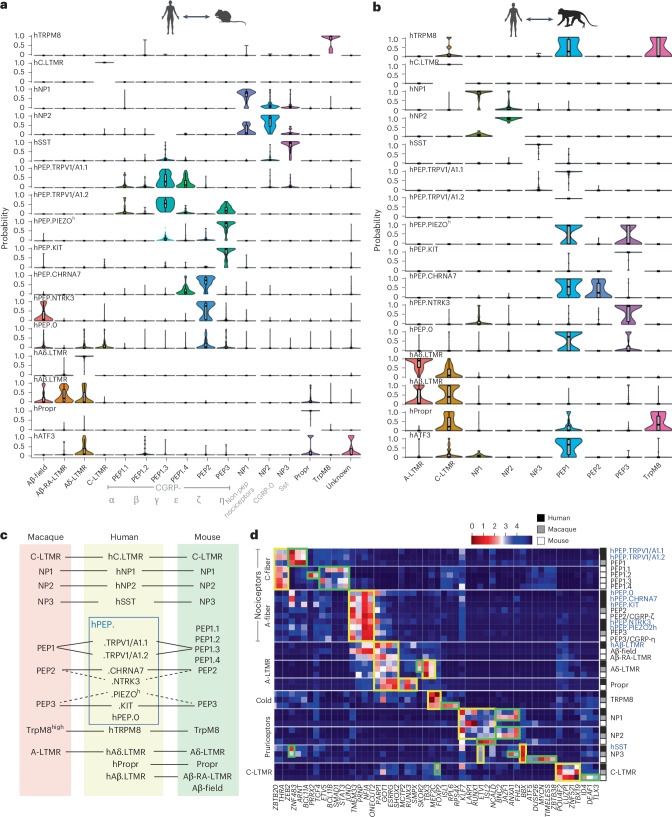
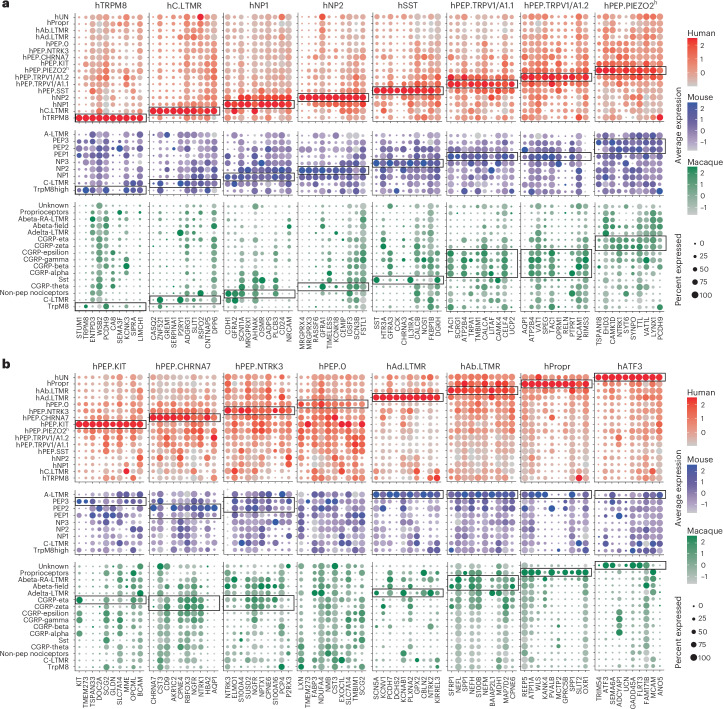
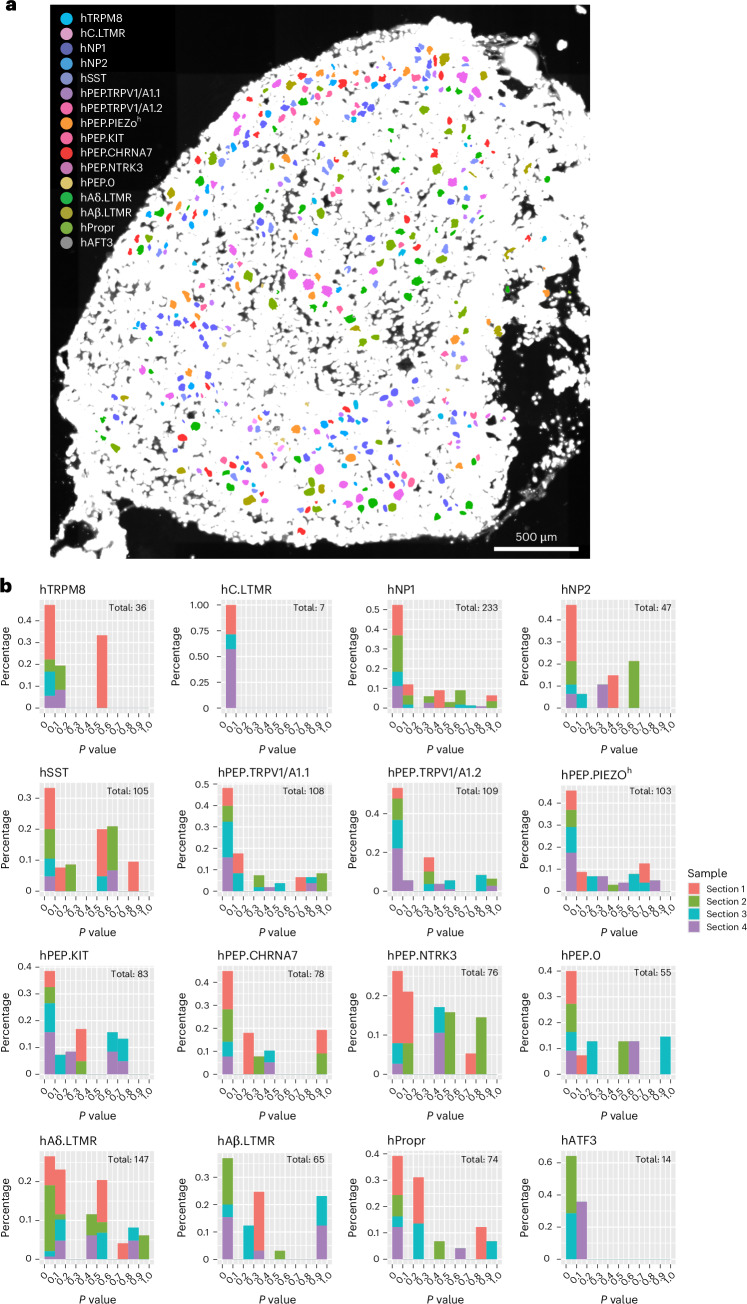
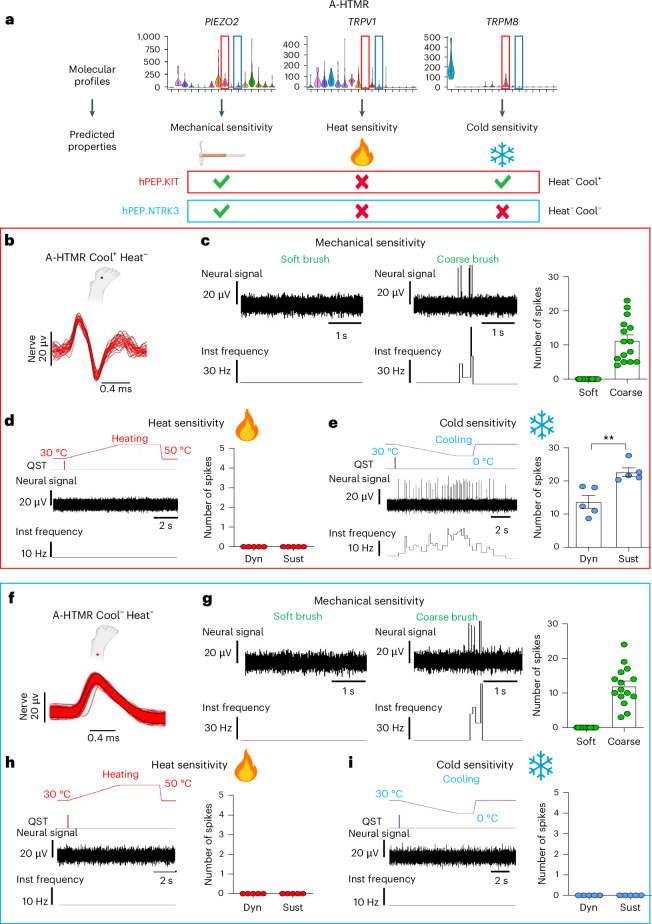
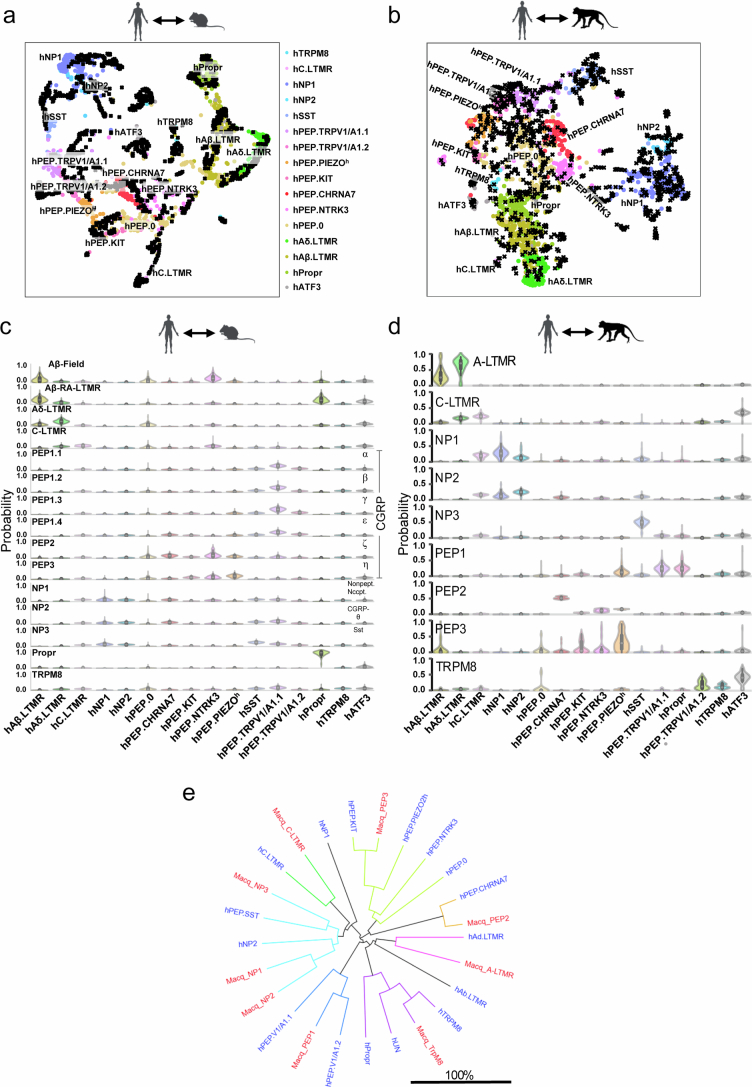
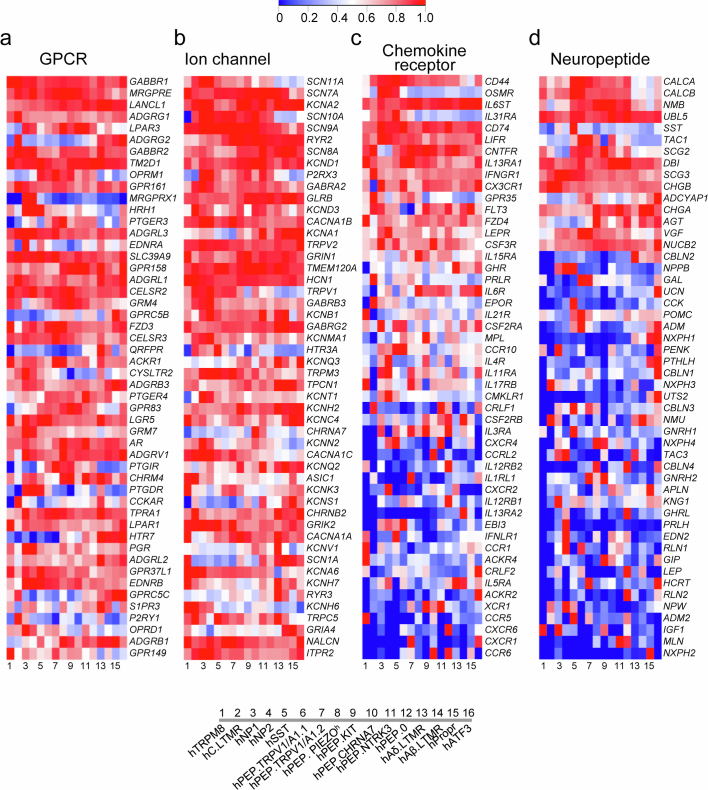
The versatility of somatosensation arises from heterogeneous dorsal root ganglion (DRG) neurons. However, soma transcriptomes of individual human (h)DRG neurons-critical information to decipher their functions-are lacking due to technical difficulties. In this study, we isolated somata from individual hDRG neurons and conducted deep RNA sequencing (RNA-seq) to detect, on average, over 9,000 unique genes per neuron, and we identified 16 neuronal types. These results were corroborated and validated by spatial transcriptomics and RNAscope in situ hybridization. Cross-species analyses revealed divergence among potential pain-sensing neurons and the likely existence of human-specific neuronal types. Molecular-profile-informed microneurography recordings revealed temperature-sensing properties across human sensory afferent types. In summary, by employing single-soma deep RNA-seq and spatial transcriptomics, we generated an hDRG neuron atlas, which provides insights into human somatosensory physiology and serves as a foundation for translational work.


Conflict of interest statement

Competing interests: The authors declare no competing interests.

Figures

Fig. 1
Fig. 1. Developing an LCM-based approach for single-soma deep RNA-seq of hDRG neurons.
a, Overall workflow of this study. Left, features associated with different strategies for single-cell RNA-seq of hDRG neurons. Middle, example of the laser dissection of an hDRG neuron soma. Right, summary of analyses and experiments. Scale bar, 50 μm (cell) and 500 μm (cap). b, UMAP plot showing the clusters of 1,066 hDRG neurons. c,d, Violin plots showing total number of detected genes (c) and the expression of neuronal marker SLC17A6 (d). e, The grouping clusters based on the top 50% soma diameter and the expression of INA, NEFH, PRDM12, CALCA and NTRK1. f, UMAPs showing some canonical marker gene expression in each cluster. The color gradient represents the log-normalized expression levels of each gene across cells. g, UMAP plot with names of each cluster. For violin plots in ce, the lower and upper bounds of the box correspond to the first quartile (Q1, 25%) and the third quartile (Q3, 75%), respectively. A gray dot within the box represents the median value (Q2, 50%). The lower end of the whiskers indicates the minimal value within 1.5 times the interquartile range (IQR) from the first quartile (Q1, 25%). The upper end of the whiskers indicates the maximal value within 1.5 times the IQR from the third quartile (Q3, 75%). Source data
Fig. 2
Fig. 2. Cross-species analysis of DRG neurons in human, macaque and mouse.
a,b, Conos label propagation from mouse (a, biological n = 6) and macaque (b, biological n = 5) to hDRG neuron (n = 6 DRGs obtained from n = 3 donors) clusters showing the cell type correlation. Mouse names combined Sharma and Usoskin nomenclature. For UMAPs of correspondent co-integration, from which these results were inferred, see Extended Data Fig. 4a,b. The lower and upper bounds of the box correspond to the first quartile (Q1, 25%) and the third quartile (Q3, 75%), respectively. A gray dot within the box represents the median value (Q2, 50%). The lower end of the whiskers indicates the minimal value within 1.5 times the interquartile range (IQR) from the first quartile (Q1, 25%). The upper end of the whiskers indicates the maximal value within 1.5 times the IQR from the third quartile (Q3, 75%). c, Summary of correspondence of DRG neuron clusters among three species. Solid lines depict clear match, and dashed lines represent partial similarity. d, Heatmap visualization of cross-species-conserved and species-specific TF-associated gene patterns across mouse, macaque and human. The color gradient bar depicts the distances of gene patterns from close (red) to distant (dark blue) in arbitrary units. Species are color coded in the right column. Yellow boxes, conserved GRNs; green boxes, species-specific GRNs. Non-pep, non-peptidergic. Source data
Fig. 3
Fig. 3. Comparison of marker gene expression across species.
a,b, Dot plots showing top 10 specific marker genes selected from each hDRG neuron cluster expressed in human (red), macaque (blue) and mouse (green) DRG neuron datasets. The color scale represents the average expression level (log-normalized counts) of each gene in the clusters. The black boxes highlight the corresponding cell types based on the label transfer and neural network scoring analysis. Non-pep, non-peptidergic. Source data
Fig. 4
Fig. 4. 10x Xenium spatial transcriptomics of hDRG neurons.
a, Overall workflow of 10x Xenium spatial transcriptomics and data analysis. b, Representative images of PGP9.5 (UCHL1, orange)/FABP7 (green) and H&E staining used for manual segmentation (the experiment was repeated independently four times with similar results). c, UMAP plot showing the cluster annotation of 1,340 hDRG neurons from 10x Xenium spatial transcriptomics. Four DRG sections from two donors (section 1, donor N3 L2; section 2, donor N4 L3; section 3, donor N4 T12; section 4, donor N4 T12) were used. d, Dot plot showing the top marker genes expressed in each hDRG neuron cell type from single-soma sequencing (blue) and Xenium (red). The color scale represents the normalized average expression level (from 0 to 1) of each gene in the clusters. e, Example images showing expression of marker genes expressed in each cell type (scale bar, 50 μm) (the experiment was repeated independently four times with similar results). f, Percentage of each cell type in the 10x Xenium dataset. Source data
Fig. 5
Fig. 5. Spatial distribution of hDRG neurons.
a, Spatial distribution of different types of DRG neurons in one example hDRG section (scale bar, 500 μm). b, Clustering probability of each neuron within a given type. Pearson’s chi-squared test with degree of freedom of 1 was used, and no adjustments for multiple comparisons were made for the data analysis. x axis is the P value, and y axis is the frequency (percentage of cell count). Different colors indicate data from different hDRG sections (section 1, donor N3 L2; section 2, donor N4 L3; section 3, donor N4 T12; section 4, donor N4 T12). Low P value (P < 0.05) indicates significant cell clustering. Source data
Fig. 6
Fig. 6. Molecular-profile-informed single-unit microneurography recordings of human skin afferents.
a, Receptive field locations of single afferents from superficial peroneal (S. peroneal), posterior antebrachial cutaneous (PABCN) and radial nerve recordings (n = 69). All units are color coded and presented as filled circles, except for RA2-LTMR, which is shown without filling to indicate its location on the glabrous side of digit 1. Data were collected from 62 healthy participants (29 males and 33 females, 19–41 years of age). b, Distribution of mechanical (monofilament) thresholds for HTMRs and LTMRs in the recorded samples. c, Individual and mean (± s.e.m.) conduction velocities of different HTMR and LTMR types in response to surface electrical or mechanical stimulation (Field-LTMR: 40.4 ± 1.9 m s−1, n = 4 units; SA1-LTMR: 44.9 ± 2.6 m s−1, n = 3 units; SA2-LTMR: 44.9 ± 1.2 m s−1, n = 3 units; A-HTMR: 50.0 ± 3.3 m s−1, n = 8 units; C-LTMR: 1.0 ± 0.05 m s−1, n = 10 units; C-HTMR: 0.7 ± 0.08 m s−1, n = 5 units). d, Temperature sensitivity of hA.LTMR sensory fibers predicted based on gene expression obtained from the single-soma deep RNA-seq (the same violin plot parameters as in Fig. 1). e, Superimposed spike activity of an hA.LTMR field unit in response to repeated sensory stimulation of the receptive field. The receptive field location is indicated by the blue dot. fh, Individual and mean (± s.e.m.) responses of hA.LTMR field units to soft brushing (f), heating (g, 4 °C per s) and cooling (h, 4 °C per s). The A-LTMR units responded robustly to soft brush stroking (n = 16 units, 54 trials, all displayed), with a mean ± s.e.m. of 19.0 ± 1.0 spikes. However, none of them responded to heating (n = 6 units, 17 trials) or cooling (n = 6 units, 15 trials). Each data point for heating and cooling (zero responses) represents at least two trials from an individual unit. Dyn, dynamic; Sust, sustained; Inst, instantaneous. Source data
Fig. 7
Fig. 7. Molecular-profile-informed single-unit microneurography recordings of human A-HTMRs.
a, Mechanical and temperature sensitivity of hA.HTMR sensory fibers predicted based on gene expression obtained from single-soma deep RNA-seq (the same violin plot parameters as in Fig. 1). b, Superimposed spike activity of an A-HTMR Cool+ Heat unit (putatively a hPEP.KIT neuron) in response to repeated sensory stimulation of the receptive field. The receptive field location is indicated by the blue dot. ce, Individual and mean (± s.e.m.) responses of A-HTMR Cool+ Heat units to brushing (c), heating (d) and cooling (e). The A-HTMR Cool+ Heat units predictably showed no response to soft brushing, but all responded to coarse brushing (n = 5 units, each tested in triplicate, all trials shown). Furthermore, they did not respond to heating but displayed responses to cooling during both the dynamic (4 °C per s) and sustained phases. Each data point for heating and cooling represents the mean of triplicate responses from an individual unit (n = 5 units). An increased response was observed during sustained cooling compared to dynamic cooling (two-tailed paired t-test: t(4) = 4.889, P = 0.0081). f, Superimposed spike activity of an A-HTMR Cool Heat unit in response to mechanical stimulation of the receptive field. The receptive field location is indicated by the red dot. gi, Individual and mean (± s.e.m.) responses of A-HTMR Cool Heat units to soft and coarse brushing (g), heating (h) and cooling (i). All A-HTMR Cool Heat units responded to coarse brushing, whereas none responded to soft brushing (n = 5 units, each tested in triplicate, all trials shown). Furthermore, none responded to heating or cooling. Each data point for heating and cooling represents a mean of triplicate responses from an individual unit (n = 5 units each). **P ≤ 0.01. Dyn, dynamic; Sust, sustained; Inst, instantaneous. Source data
Fig. 8
Fig. 8. Molecular-profile-informed single-unit microneurography recordings of human C-HTMRs and C-LTMRs.
a, Temperature sensitivity of hC-HTMRs and hC-LTMRs predicted based on gene expression from single-soma deep RNA-seq (the same violin plot parameters as in Fig. 1). b, Number of C-HTMRs responding to heating (MH), cooling (MC) and both (MHC). c,d, Individual and mean (± s.e.m.) responses of C-HTMRs to brushing (c,d), heating (c) and cooling (d). MH and MHC units showed no response to soft brushing but responded to coarse brushing (n = 7 units total, each tested in triplicate, all trials shown). Temperature data are shown as the mean of triplicate responses for each unit, with increased responses during sustained heating for MH and MHC units compared to dynamic heating (n = 7 units; two-tailed paired t-test: t(6) = 9.667, P < 0.0001). A similar pattern was observed for sustained cooling in MC and MHC units (n = 3 units total). e, Superimposed spike activity of an hC.LTMR in response to repeated sensory stimulation of the receptive field (marked by the green dot). fh, Individual and mean (± s.e.m.) responses of hC.LTMRs to soft brushing (f), heating (g) and cooling (h). C-LTMRs responded robustly to soft brushing (n = 17 units, 57 trials, all displayed). Heating was tested in 14 C-LTMRs, with half responding. Each data point represents the mean of triplicate responses, with increased responses during dynamic heating in heat-responsive C-LTMRs compared to sustained heating (n = 7 units; two-tailed paired t-test: t(6) = 6.591, P = 0.0006). All 14 units responded to cooling. Each data point represents the mean of triplicate responses, with increased responses during dynamic cooling compared to sustained cooling (two-way ANOVA: F1,24 = 144.6, P < 0.0001; Tukey’s test: P < 0.0001). No significant differences (P > 0.05) were observed in cooling (h) between heat-responsive and non-heat-responsive C-LTMRs (two-way ANOVA: F1,24 = 0.2860, P = 0.5977). i,j, Spike counts for A-HTMRs, C-LTMRs and C-HTMRs in response to cooling (i) or heating (j) stimuli. Each data point represents the mean (± s.e.m.) responses of five A-HTMR Cool+, seven C-LTMR Cool+ Heat+, three C-HTMR MC/MHC and seven C-HTMR MH/MHC units, tested in triplicate. For C-afferent responses, conduction delays were adjusted based on the latency of electrically triggered spiking. ***P ≤ 0.001; ****P ≤ 0.0001. Dyn, dynamic; NS, not significant; Sust, sustained; Inst, instantaneous. Source data
Extended Data Fig. 1
Extended Data Fig. 1. LCM RNA-seq statistics, clustering, and additional marker gene expression.
(a-c) Size distribution of all DRG neurons (a) and dissected neuronal soma (b). (c) Cumulative curve of size distribution of all DRG neurons in (a) and dissected neuronal somata in (b) and statistic comparison by two-sided Kolmogorov–Smirnov test. (d-f) Violin plots showing total number of detected genes in different batches (d), donors (e), and DRG levels (f). (g-i) UMAP plots showing the contribution of individual batches (g), donors (h) and DRG levels (i) to each cluster. The insets in each panel show a zoomed-in view of hTRPM8 and hC.LTMR clusters. (j-k) Violin plots showing the expression of pan-neuronal markers SYP and UCHL1. (l-m) A representative image of human DRG neurons stained by HistoGeneTM dye (l) and quantification of the percentage of neurons with or without the nucleus in 20-μm human DRG tissue sections (m, 447 neurons from 10 sections of 5 DRGs, 3 donors). Scale bar, 50 μm. (n) The distribution of soma diameters of dissected neurons in each cluster. For violin plots in d-f, j-k and n, the lower and upper bounds of the box correspond to the first quartile (Q1, 25%) and the third quartile (Q3, 75%), respectively. A grey dot within the box represents the median value (Q2, 50%) The lower end of the whiskers indicates the minimal value within 1.5 times the interquartile range (IQR) from the first quartile (Q1, 25%). The upper end of the whiskers indicates the maximal value within 1.5 times the IQR from the third quartile (Q3, 75%). (o) UMAPs showing expression pattern of additional canonical marker genes in each cluster. The color scale represents the log-normalized expression levels of each gene across cells. Source data
Extended Data Fig. 2
Extended Data Fig. 2. Validation of hDRG neuron clustering.
(a) Clustering of hDRG neurons by Conos. (b) The accuracy of neural-network classifier in learning hDRG neurons was visualized as learning curve. The Y-axis represents learning accuracy, and the X-axis represents the training epoch numbers. Following the training epochs, the maximum accuracy plateaus of this learning curve reaching ~88%. (c) Percentage bar chart visualization, the consistency of assigned hDRG neurons by the neural-network scoring module. Blue and red sections of the bars indicate ratio of cells within each type with and without, respectively, consistent assigned to itself. (d) hierarchical heatmap visualization of the probabilistic similarity across cell types. The color gradient depicts similarity score from high (yellow, 100% similarity) to low (dark blue, 0% similarity). (e) Percentage of each cell type in single-soma RNA-seq dataset, 1066 neurons total. Source data
Extended Data Fig. 3
Extended Data Fig. 3. Correlation analysis of human DRG neuron cell types across our dataset and three published datasets.
(a-f) Heatmaps comparing the similarities of human DRG neuron cell types between different datasets analyzed by Seurat Integration, Mapping and Annotating Query Datasets module. The color gradient represents cell type similarity. The maximum similarity is 1. Single-soma indicates the dataset of this study, single-nucleus dataset 1 indicates the Nguyen et al. dataset, single-nucleus dataset 2 indicates the Jung et al. dataset, and spatial indicates the Tavares-Ferreira et al dataset. Source data
Extended Data Fig. 4
Extended Data Fig. 4. Cross-species comparison of sensory neuron types among human, macaque, and mouse.
(a-b) UMAPs of Conos co-clustering of human and mouse (a) or macaque (b) DRG neurons. These co-clustering were used for label propagation inferences shown on Fig. 2a & b. Each pair UMAPs were plotted with the same coordinates, the human clusters are shown in color, the small black uncolored crosses depict mouse and macaque clusters. (c-d) Probabilistic neural network probability scores of mouse (Sharma dataset, biological N = 6) (c) and macaque (Kupari, SmartSeq2 dataset, biological N = 5) (d) DRG neuron types tested on human trained module (n = 6 DRGs obtained from N = 3 donors). The violin plot parameters are the same as the supplementary fig. 1. (e) Radial hierarchical dendrogram showing the similarity between cell types in humans (h, blue) and macaques (Macq_, red). Branch lengths indicate the degree of similarity. The scale bar from center to the terminus represents 100% similarity. Source data
Extended Data Fig. 5
Extended Data Fig. 5. Marker gene expression and validation in human DRG neurons by RNAScope in situ hybridization.
(a-m) Marker genes selected for labeling of different clusters (left) and validation by multiplex FISH (middle). The fluorescent images show detected transcripts in one example hDRG neuron (cell body outlined by the white dashed line. These experiments were repeated with DRG sections from two donors (donor N3, lumbar DRG L2; donor N4, thoracic DRG T12). The violin plot parameters are the same as the Extended Data Fig. 1. Scale bar: 25 μm. Source data
Extended Data Fig. 6
Extended Data Fig. 6. Expression of additional marker or functional genes in human, mouse and macaque DRG neuron cell types.
(a-c) Dot plots showing the expression of additional marker or functional genes in human (a), mouse (b) and macaque (c) DRG neuron cell types. The color scale represents the log-normalized expression levels of each gene across cells. (d) Violin plot showing the expression of opioid receptors in mouse and human DRG neurons. The violin plot parameters are the same as the Extended Data Fig. 1. Source data
Extended Data Fig. 7
Extended Data Fig. 7. Single-soma deep RNA-seq dataset is powerful for molecular discovery.
(a) Comparison of the number of GPCRs, ion channels, chemokine receptors, and neuropeptides in single-soma, spatial, and single-nucleus RNA-seq datasets. “Single-soma” is the dataset from this study, “Spatial” refers to the dataset from the Tavares-Ferreira et al, and “Single-nucleus” refers to the dataset from the Nguyen et al. The circles represent the number of detected genes in these gene families across the three datasets. The heatmaps display the expression levels of the top genes from each of the three datasets. The color scale represents the expression level normalized to the maximum gene expression in each dataset. (b-c) Expression of putative itch receptors in hDRG neurons shown by dot plots. Some receptors are highly enriched (b), while some receptors are barely detected (c) in human itch populations, which are highlighted by red boxes. (d) Novel GPCRs, ion channels, and other genes enriched in human itch populations shown by dot plot. For dot plots in panel b-d, the size of the dot represents the percentage of cells within a cluster, and the color corresponds to the average expression (scaled data) across all cells within a cluster for each gene shown. Source data
Extended Data Fig. 8
Extended Data Fig. 8. Expression of drug targets in hDRG neurons.
(a-d) Heatmap showing the expression of top 50 GPCRs (a), ion channels (b), chemokine receptors (c) and neuropeptides (d) in hDRG neurons. Genes were ranked by average expression level in all DRG neurons. Color scale represents the average gene expression level normalized to the maximum average gene expression within each clusters. Source data
Extended Data Fig. 9
Extended Data Fig. 9. Immunostaining of different types of sensory fibers in the human skin using molecular makers identified by single-soma deep RNA-seq dataset.
(a-f) Double immunostaining of human skin sections showing SST+ sensory fibers are a subset of CGRP+ sensory fibers in the dermis, the dermis-epidermis junction, and entering the epidermis (a-c) and near the hair follicle (d-f). The white dashed line indicates the dermis-epidermis junction. Yellow arrows indicate SST + /CGRP+ sensory afferents, green arrows indicate CGRP+ only sensory afferents (g-o). Double immunostaining of KIT with PGP9.5 (g-i), NEFH (j-l) and CGRP (m-o) in human hairy skin showing KIT+ sensory afferents are a subset of CGRP + /NEFH+ sensory afferents around the hair follicles. Inserts in large white rectangles are 2X enlargements of areas in the small white rectangles. Yellow dashed lines outline hair follicles. Yellow arrows indicate double positive sensory afferents, green arrows indicate PGP9.5+ only or CGRP+ only or NEFH+ only sensory afferents. In mo, white arrows indicate macrophages that were previously known to be KIT + . Given that the macrophage KIT immunolabeling is far more intense than that on the innervation, the macrophages are overexposed and blurred at the exposure setting needed to capture the labeling of the innervation. The experiment was repeated independently three times with similar results. Epi, epidermis; hf, hair follicle; sd, sweat gland duct; pnc, pilo-neural complex; sbg, sebaceous gland. Scale bar, 100 μm. Source data
Extended Data Fig. 10
Extended Data Fig. 10. Molecular expression in the hPEP.KIT and hC.LTMR populations, and additional physiological characterization from human A-, C-HTMRs and C-LTMRs.
(a) Validation of TRPM8, PIEZO2, CGRP, CASQ2 and TRPV1 expression in the hPEP.KIT and hC.LTMR populations by multiplex FISH (The experiment was repeated independently two times with similar results, the same violin plot parameters as the Fig. 1). Scale bar, 25 μm. (b) Receptive field locations of A-HTMR Cool+ and Cool- units. (c-e) Comparisons between A-HTMR subtypes showed no significant differences in monofilament thresholds (median ± IQR, n = 5 units each; Two-tailed independent, Mann-Whitney test: U = 10.50, P = 0.7619; panel c), coarse-brush responses (mean of triplicate responses per unit, pooled mean ± SEM, n = 5 units each; Two-tailed unpaired t-test: t(8) = 0.2692, P = 0.7946; panel d), and conduction velocities (median ± IQR, Cool- units: n = 5, Cool+ units: n = 3; Two-tailed independent Mann Whitney test: U = 6, P = 0.7857, panel e). (f) Superimposed spike activity of a C-HTMR Heat+ (MH) unit in response to repeated sensory stimulations of the receptive field. (g-l) Responses of a C-HTMR (MH) to soft-brushing (g), coarse-brushing (h), heating (i), and capsaicin (j). (k) Response of a C-HTMR (MC) to cooling. (l) Response of a TRPM8 (mechano-unresponsive C cold) unit to menthol. (m) Individual and mean ( ± SEM) responses of C-LTMR Heat+ and C-HTMR Heat+ units to capsaicin. Capsaicin to the receptive field evoked spontaneous activity in both C-HTMRs (n = 3 units) and C-LTMRs (n = 5 units). The effect was more robust (F (1, 6) = 150.1, P < 0.0001) and longer-lasting (F (2.695, 16.17) = 15.92, P < 0.0001) in C-HTMRs compared to C-LTMRs (2-way RM-ANOVA). Multiple comparisons were performed using Uncorrected Fisher’s LSD test. The duration of spontaneous activity in C-HTMRs is truncated to 120 s (post-capsaicin removal), aligning with the disappearance of spontaneous activity in C-LTMRs. (n) Example trace of a heat-unresponsive C-LTMR. (o) Soft-brush responses were not different between heat-responsive and non-heat-responsive C-LTMRs (mean of at least two responses per unit, pooled mean ± SEM, n = 7 units each; Two-tailed unpaired t-test: t(12) = 0.6649, P = 0.5187). (p) Example trace showing no response to menthol in a hC.LTMR. *P < 0.05, **P < 0.01. Source data

Update of

References

    1. Burma, N. E., Leduc‐Pessah, H., Fan, C. Y. & Trang, T. Animal models of chronic pain: advances and challenges for clinical translation. J. Neurosci. Res.95, 1242–1256 (2017). - PubMed
    1. Hill, R. NK1 (substance P) receptor antagonists—why are they not analgesic in humans? Trends Pharmacol. Sci.21, 244–246 (2000). - PubMed
    1. Haberberger, R. V., Barry, C., Dominguez, N. & Matusica, D. Human dorsal root ganglia. Front. Cell. Neurosci.13, 271 (2019). - PMC - PubMed
    1. Middleton, S. J. et al. Studying human nociceptors: from fundamentals to clinic. Brain144, 1312–1335 (2021). - PMC - PubMed
    1. Tang, F. et al. mRNA-Seq whole-transcriptome analysis of a single cell. Nat. Methods6, 377–382 (2009). - PubMed