. 2024 Dec;20(12):1329-1345.
doi: 10.1038/s44320-024-00070-5. Epub 2024 Nov 4.

Identifying T-cell clubs by embracing the local harmony between TCR and gene expressions

Affiliations

Identifying T-cell clubs by embracing the local harmony between TCR and gene expressions

Yiping Zou et al. Mol Syst Biol. 2024 Dec.

Abstract

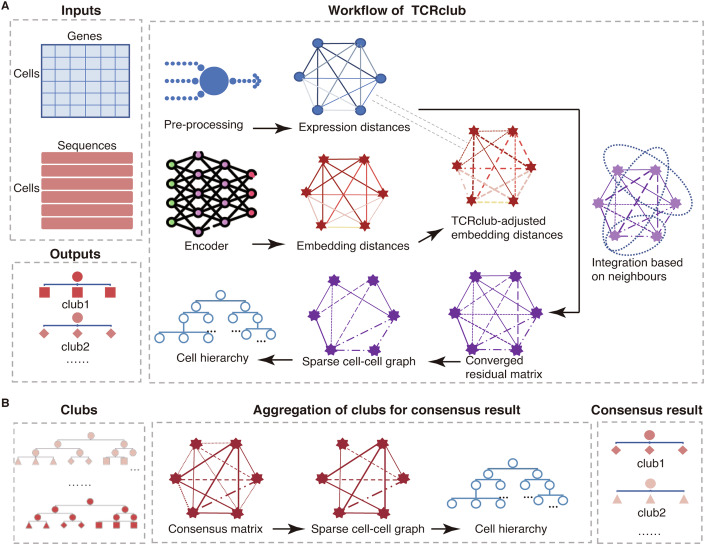
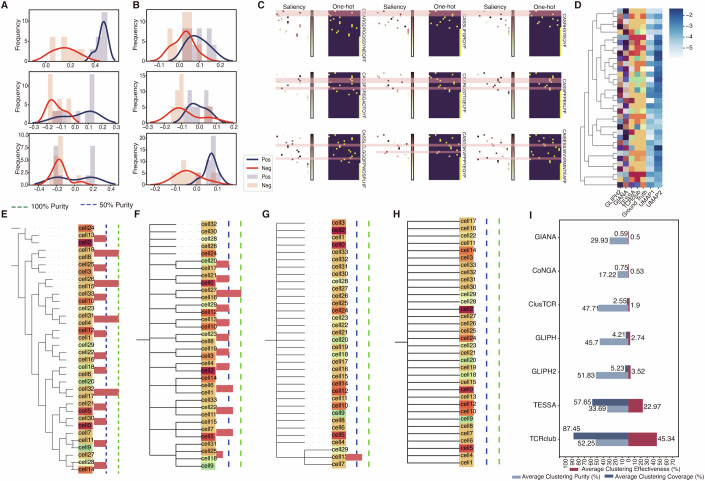
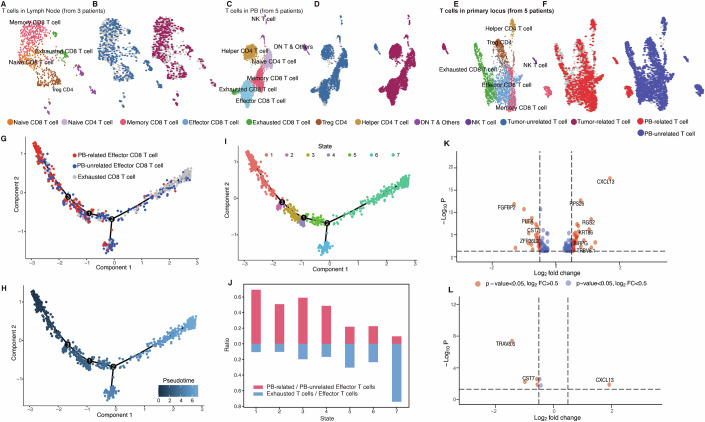
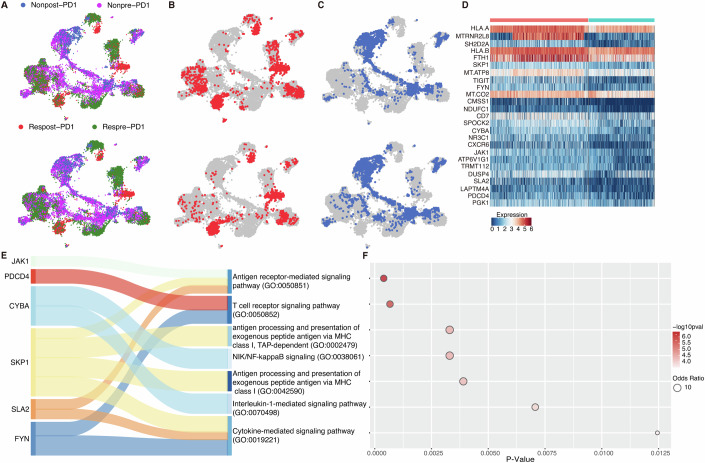
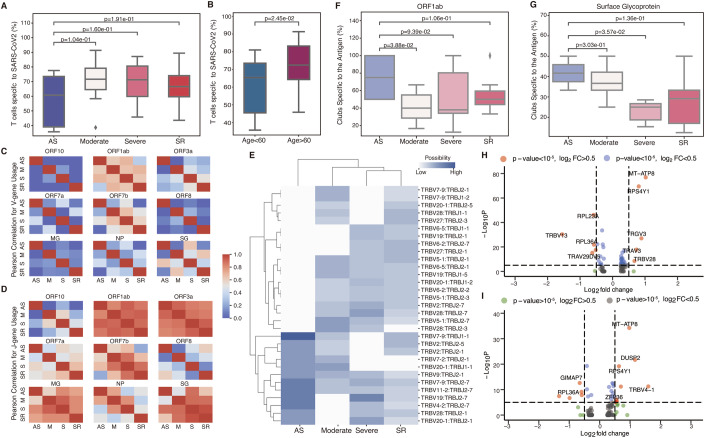
T cell receptors (TCR) and gene expression provide two complementary and essential aspects in T cell understanding, yet their diversity presents challenges in integrative analysis. We introduce TCRclub, a novel method integrating single-cell RNA sequencing data and single-cell TCR sequencing data using local harmony to identify functionally similar T cell groups, termed 'clubs'. We applied TCRclub to 298,106 T cells across seven datasets encompassing various diseases. First, TCRclub outperforms the state-of-the-art methods in clustering T cells on a dataset with over 400 verified peptide-major histocompatibility complex categories. Second, TCRclub reveals a transition from activated to exhausted T cells in cholangiocarcinoma patients. Third, TCRclub discovered the pathways that could intervene in response to anti-PD-1 therapy for patients with basal cell carcinoma by analyzing the pre-treatment and post-treatment samples. Furthermore, TCRclub unveiled different T-cell responses and gene patterns at different severity levels in patients with COVID-19. Hence, TCRclub aids in developing more effective immunotherapeutic strategies for cancer and infectious diseases.

Keywords: Integration; Local Harmony; Single-Cell Analysis; T-Cell Clustering.


Conflict of interest statement

Disclosure and competing interests statement. The authors declare no competing interests.

Figures

Figure 1
Figure 1. Schematic overview of TCRclub.
(A) The workflow of TCRclub. (B) Aggregation of clubs for consensus result.
Figure 2
Figure 2. Performance evaluation of TCRclub for T cell clustering.
(AC) Density histograms of three clubs obtained from the same sample illustrate the distribution of concept scores. The blue histograms represent the club of interest, while the red histograms represent other clubs from the same sample. (A) Three clubs presenting different prominent epitopes. (B) Three clubs without prominent epitopes. (C) Saliency maps for the three clubs in (A). Each row displays the saliency maps for the top four TCRs with the highest concept scores within the club. The dark-background heatmap indicates the one-hot embedding (see Appendix Supplementary Methods) for each TCR, while the white-background heatmap represents the saliency of each amino acid in the TCR. The color bar denotes the saliency level, with deeper colors indicating higher importance. Shared attentional positions are highlighted in red. (D) Heatmap comparing the clustering results of different models with the ground truth. RNA expressions were dimensionally reduced by uniform manifold approximation and projection (UMAP) and are depicted in blue. The ground truth shows the verified pMHCs of T cells, with each pMHC assigned a unique color. In the ground truth, the same colors depict T cells with the same pMHC. For the models, T cells were colored according to the clustering result. For example, if the largest number of T cells in the cluster is against a particular pMHC, then all the T cells in this cluster will be assigned the color corresponding to that pMHC in the ground truth colormap. If a T cell does not belong to any cluster, it is assigned a color that is not present in the ground truth colormap. Therefore, the clustering result that aligns more closely with the colormap of the ground truth indicates higher purity and clustering coverage. (EH) iTOL plots display the hierarchy of the clustering results from TCRclub (E), TESSA (F), and GLIPH2 (G). GIANA, CoNGA, and ClusTCR did not generate any clusters in the depicted example (H). Same as in (D), T cells are color-coded based on the verified pMHCs, where identical colors represent T cells recognizing the same pMHC. TCRclub (E) exhibits a tree-like structure, where T cells associated with the same node in the club layer are anticipated to share similar functions. Conversely, alternative models. Other models (FH) generate produced flat cell groupings, where T cells affiliated with the same child node are expected to exhibit similar functions. The blue and green dotted lines mark the 50 and 100% clustering purity, respectively. (I) Comparison of TCRclub with other models in terms of average effectiveness, purity, and coverage of the dataset.
Figure 3
Figure 3. TCRclub reveals the dynamic journey: early-stage activated T cells transition to late-stage exhausted phenotype in cholangiocarcinoma patients.
(A) UMAP plot of lymph T cells labeled with distinct colors and accompanied by cell type annotations. (B) Tumor-unrelated T cells (left) and tumor-related T cells (right) depicted in lymph samples. (C) UMAP plot of PB T cells labeled with distinct colors and accompanied by cell type annotations. (D) Tumor-unrelated T cells (left) and Tumor-related T cells (right) visualized in PB samples. (E) UMAP plot showing T cells labeled with varying colors for tumor primary locus samples, with corresponding cell type annotations. (F) PB-related T cells (left) and PB-unrelated T cells (right) are depicted in tumor samples. (G) Trajectory plot depicting the progression of effector CD8 T cells and exhausted CD8 T cells within tumor samples. (H) Pseudotime trajectory plot of effector CD8 T cells and exhausted CD8 T cells within tumor samples. (I) Trajectory plot demonstrating the states of effector CD8 T cells and exhausted CD8 T cells within tumor samples. (J) The ratio of PB-related to PB-unrelated effector CD8 T cells, along with the ratio of effector CD8 T cells to exhausted T cells in each state depicted in (I). Monocle 2 was employed for trajectory and pseudotime analysis. (K) Volcano plot displaying DEGs for PB-unrelated effector CD8 T cells (n = 520) compared with PB-related effector CD8 T cells (n = 440). The p values were generated from the two-sided Wilcoxon rank-sum test. (L) Volcano plot depicting DEGs for PB-unrelated memory CD8 T cells (n = 313) compared with PB-related memory CD8 T cells (n = 222). The p values were generated from the two-sided Wilcoxon rank-sum test.
Figure 4
Figure 4. Investigating the mechanisms of response to Anti-PD1 therapy in BCC patients using TCRclub.
(A) UMAP plots of T cells colored according to the original cell-type labels. The upper plot displays the original labels prior to applying TCRclub, while the lower plot shows the re-assigned labels after the TCRclub application. (B) UMAP plots of T cells colored according to the cell-type labels before and after applying TCRclub. The upper plot depicts the original Respost-PD1 labels before the TCRclub application, while the lower plot highlights the re-assigned Respost-PD1 cells in red after the TCRclub application. (C) UMAP plots of T cells colored according to the cell-type labels before and after applying TCRclub. The upper plot shows the original Nonpost-PD1 labels before the TCRclub application, while the lower plot highlights the re-assigned NonPost-PD1 cells in red after the TCRclub application. (AC) share the same legend. (D) Heatmap illustrating the DEGs discovered by analyzing the post-PD1 T cells related to the pre-PD1 T cells in responders. The top 25 genes with the highest p values are depicted. (E, F), Sankey plot (E) and Bubble plot (F) presenting the pathway enrichment analysis for the DEGs identified in the Respost-PD1 T cells related to the Respre-PD1 T cells (Respost-PD1 T cells, n = 671; Nonpost-PD1 T cells, n = 450). Seven enriched pathways, sorted based on the −log10 p values, along with their associated DEGs in (D), are displayed. The p values were generated from the two-sided Wilcoxon rank-sum test.
Figure 5
Figure 5. TCRclub characterizes antigen-specific T-cell response and gene patterns in COVID-19 patients.
(A, B) Percentage of T cells specific to SARS-CoV-2 across different severity levels (A) and age groups (B). Number of samples: AS, n = 5; Moderate, n = 13; Severe, n = 11; SR, n = 12; Age <60, n = 20; Age >60, n = 21. The p values were generated from the one-sided Mann–Whitney U-test. (C, D) Correlation of the usage of various V genes (C) and J genes (D) between different severity levels for different antigens. MG denotes membrane glycoprotein. NP denotes nucleocapsid phosphoprotein, and SG represents surface glycoprotein. (E) Most frequent V-J gene pairs for T cells specific to ORF1ab in different severity levels. (F, G) Percentage of T-cell clubs specific to ORF1ab (F) and surface glycoprotein (G) among patients with different severity levels. Number of samples: AS, n = 4; Moderate, n = 11; Severe, n = 10; SR, n = 12 (F) and AS, n = 2; Moderate, n = 10; Severe, n = 6; SR, n = 10 (G). The p values were generated from the one-sided Mann–Whitney U-test. (H, I) Volcano plots of DGEs for T-cell clubs specific to ORF1ab (H) and surface glycoprotein (I) in severe patients, compared with AS and moderate patients. The p values were generated from the two-sided Wilcoxon rank-sum test. Number of cells: AS and moderate, n = 1291; Severe, n = 1318 (H); AS and moderate, n = 802; Severe, n = 457 (I). Data information: For boxplots in (A, B, F, G), The central band represents the median. The lower and upper hinges represent the first and third quartiles, respectively. Whiskers are drawn to the farthest datapoint within ±1.5 × IQR from the nearest hinge.

Similar articles

References

    1. Albacker LA, Wu J, Smith P, Warmuth M, Stephens PJ, Zhu P, Yu L, Chmielecki J (2017) Loss of function jak1 mutations occur at high frequency in cancers with microsatellite instability and are suggestive of immune evasion. PLoS ONE 12(11):e0176181 - PMC - PubMed
    1. Ancona M, Ancona M, Ceolini E, Öztireli C, Gross MH (2017) Towards better understanding of gradient-based attribution methods for deep neural networks. In: International conference on learning representations. OpenReview
    1. Asgari S, Pousaz LA (2021) Human genetic variants identified that affect covid susceptibility and severity. 600(7889):390–391 - PubMed
    1. Azizi E, Carr AJ, Plitas G, Cornish AE, Konopacki C, Prabhakaran S, Nainys J, Wu K, Kiseliovas V, Setty M, Choi K, Fromme RM, Dao P, McKenney PT, Wasti RC, Kadaveru K (2018) Gene expression omnibus GSE114724. https://www.ncbi.nlm.nih.gov/geo/query/acc.cgi?acc=GSE114724
    1. Borcherding N, Zhang W (2020) Gene expression omnibus GSE121636. https://www.ncbi.nlm.nih.gov/geo/query/acc.cgi?acc=GSE121636

MeSH terms

Substances

LinkOut - more resources