Comparative Study
. 2024 Nov 4;14(1):26666.
doi: 10.1038/s41598-024-78393-4.

Explainable fully automated CT scoring of interstitial lung disease for patients suspected of systemic sclerosis by cascaded regression neural networks and its comparison with experts

Affiliations
Comparative Study

Explainable fully automated CT scoring of interstitial lung disease for patients suspected of systemic sclerosis by cascaded regression neural networks and its comparison with experts

Jingnan Jia et al. Sci Rep. .

Abstract

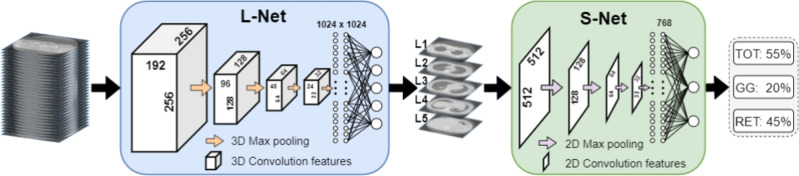
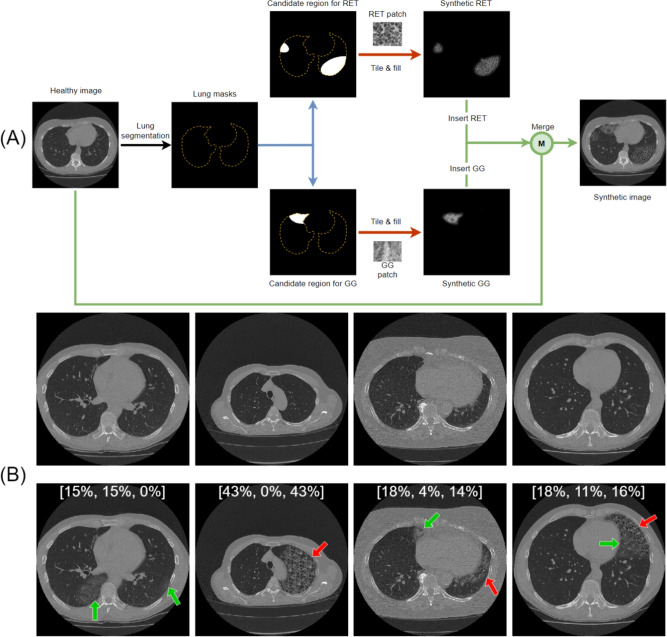
Visual scoring of interstitial lung disease in systemic sclerosis (SSc-ILD) from CT scans is laborious, subjective and time-consuming. This study aims to develop a deep learning framework to automate SSc-ILD scoring. The automated framework is a cascade of two neural networks. The first network selects the craniocaudal positions of the five scoring levels. Subsequently, for each level, the second network estimates the ratio of three patterns to the total lung area: the total extent of disease (TOT), ground glass (GG) and reticulation (RET). To overcome the score imbalance in the second network, we propose a method to augment the training dataset with synthetic data. To explain the network's output, a heat map method is introduced to highlight the candidate interstitial lung disease regions. The explainability of heat maps was evaluated by two human experts and a quantitative method that uses the heat map to produce the score. The results show that our framework achieved a κ of 0.66, 0.58, and 0.65, for the TOT, GG and RET scoring, respectively. Both experts agreed with the heat maps in 91%, 90% and 80% of cases, respectively. Therefore, it is feasible to develop a framework for automated SSc-ILD scoring, which performs competitively with human experts and provides high-quality explanations using heat maps. Confirming the model's generalizability is needed in future studies.


Conflict of interest statement

The authors declare no conflicts of interest. The corresponding author is responsible for submitting a competing interests statement on behalf of all authors of the paper. This statement must be included in the submitted article file.

Figures

Fig. 1
Fig. 1
Illustration of five levels in the same CT volume from one patient of systemic sclerosis. Interstitial lung disease scores from human experts are annotated on the top of each image. The level numbers are annotated at the bottom. TOT = total disease extent, GG = ground glass opacity, RET = reticular pattern.
Fig. 2
Fig. 2
Proposed framework for SSc-ILD scoring based on two cascaded neural networks. L-Net outputs five values of anatomical levels. S-Net outputs three values for automatic SSc-ILD scoring. TOT = total disease extent, GG = ground glass pattern, RET = reticular pattern.
Fig. 3
Fig. 3
Network architecture selection for L-Net (A) and S-Net (B). #par: number of trainable parameters; #FLOPs: number of floating point operations; MAE: mean absolute error. VGG11 and ConvNeXt achieve the lowest MAE for L-Net and S-Net, respectively. p-values in (A) were obtained by the Wilcoxon signed rank test between each network and VGG11; p-values in (B) were obtained by the Wilcoxon signed rank test between each network and ConvNeXt.
Fig. 4
Fig. 4
Data synthesis flowchart and examples. (A) Flowchart to synthesize images with different disease patterns. Blue arrows indicate the generation of random candidate lesion regions; blue arrows indicate the generation of candidate regions, red arrows indicate the filling of patterns; green arrows indicate the insertion of patterns. (B) Four pairs of synthetic examples. The upper row shows the original images; the lower row shows the corresponding synthetic images. Green arrows point to GG; red arrows point to RET. Different pattern combinations are shown from left to right: only GG, only RET, GG and RET without overlap, GG and RET with overlap. The scores of these synthetic images are shown on the image in the order of [TOT, GG, RET]. TOT = total disease extent, GG = ground glass pattern, RET = reticular pattern.
Fig. 5
Fig. 5
Testing results of the L-Net in selecting slices on the five levels, L1-L5. (A) Bland-Altman plot and (B) Correlation plot. The average spacing between slices was 1.2 mm.
Fig. 6
Fig. 6
Heat map visualization for various test images. The percentages on the scale now indicate how much the output score (in percent points) changes after replacing an area with a healthy patch. Each row represents one axial slice from a different patient. The first column is the original image and the subsequent three columns show the heat maps of the three disease patterns. Different colours represent the magnitude of score change. From top to bottom, the images show increasing disease severity. The automatic ILD score is shown on the top of each image followed by the ground truth (human consensus) between parentheses. TOT = total disease extent, GG = ground glass pattern, RET = reticular pattern.
Fig. 7
Fig. 7
Heat map performance evaluated by the two observers (pie charts in the upper row) and the association between the heat map derived ILD scoring and L&S-Net’s output (scatter plots in the lower row), to indicate its explainability. TOT = total disease extent, GG = ground glass pattern, RET = reticular pattern.

References

    1. Denton, C. P. & Khanna, D. Systemic sclerosis. The Lancet390, 1685–1699 (2017). - PubMed
    1. Wells, A. U. Interstitial lung disease in systemic sclerosis. La Presse Médicale43, e329–e343. 10.1016/J.LPM.2014.08.002 (2014). - PubMed
    1. Chassagnon, G. et al. Deep Learning-based Approach for Automated Assessment of Interstitial Lung Disease in Systemic Sclerosis on CT Images. Radiology: Artificial Intelligence2, e190006. 10.1148/ryai.2020190006 (2020). - PMC - PubMed
    1. Assayag, D., Kaduri, S., Hudson, M., Hirsch, A. & Baron, M. High Resolution Computed Tomography Scoring Systems for Evaluating Interstitial Lung Disease in Systemic Sclerosis Patients. Rheumatology, an open access journal Assayag et al. Rheumatology1, 3, 10.4172/2161-1149.S1-003 (2012).
    1. Goh, N. S. et al. Interstitial lung disease in systemic sclerosis: a simple staging system. American journal of respiratory and critical care medicine177, 57–59. 10.1164/RCCM.200706-877OC (2008). - PubMed

Publication types