. 2024 Nov 4;7(1):1435.
doi: 10.1038/s42003-024-07138-w.

Allostery in homodimeric SARS-CoV-2 main protease

Affiliations

Allostery in homodimeric SARS-CoV-2 main protease

Emanuele Fornasier et al. Commun Biol. .

Abstract

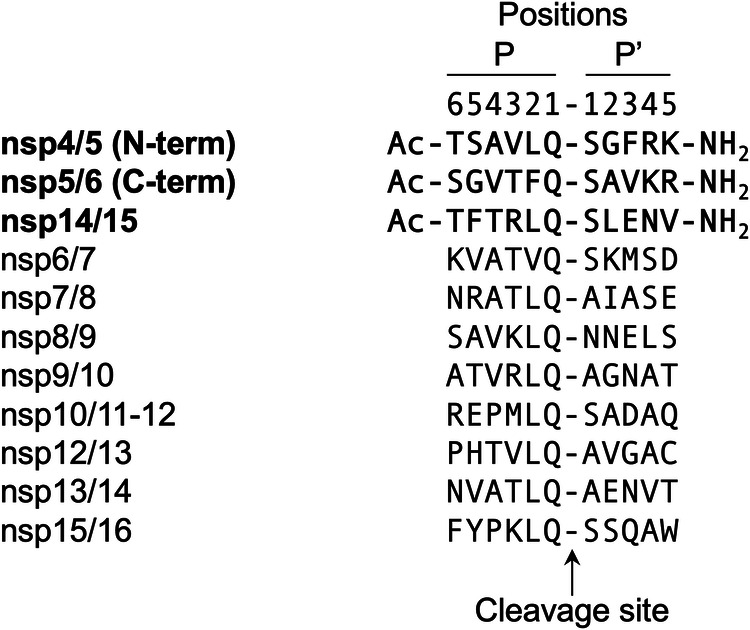
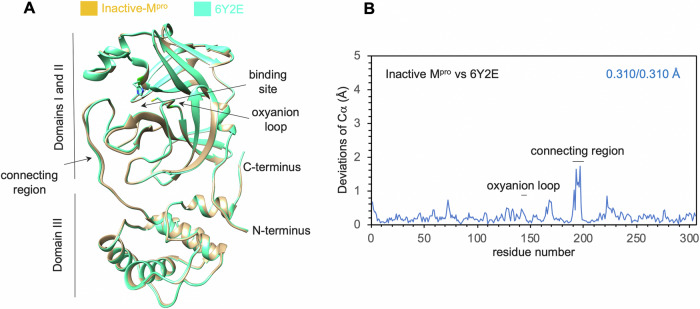
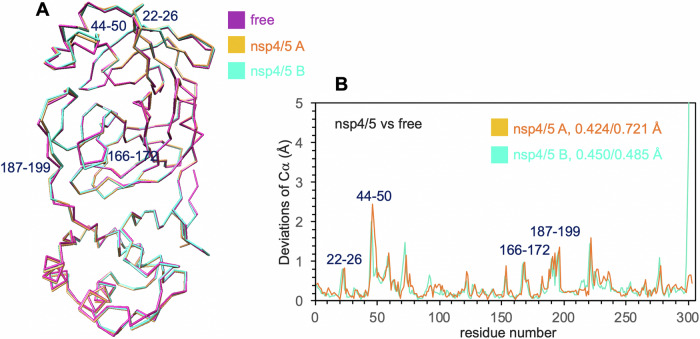
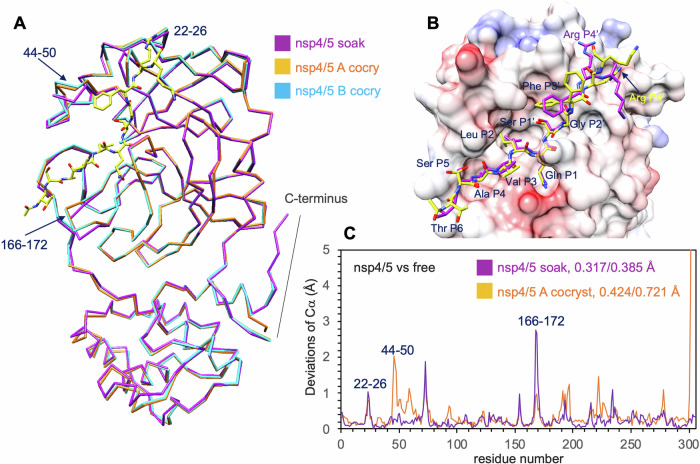
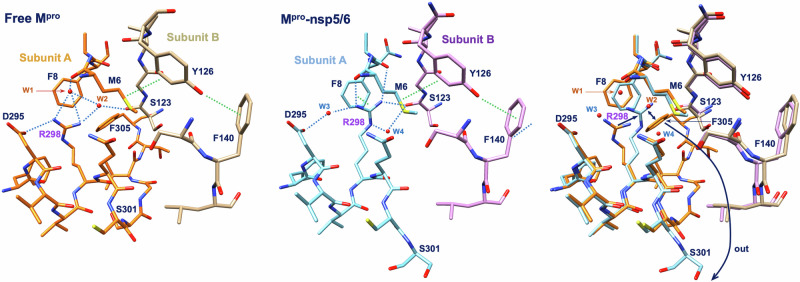
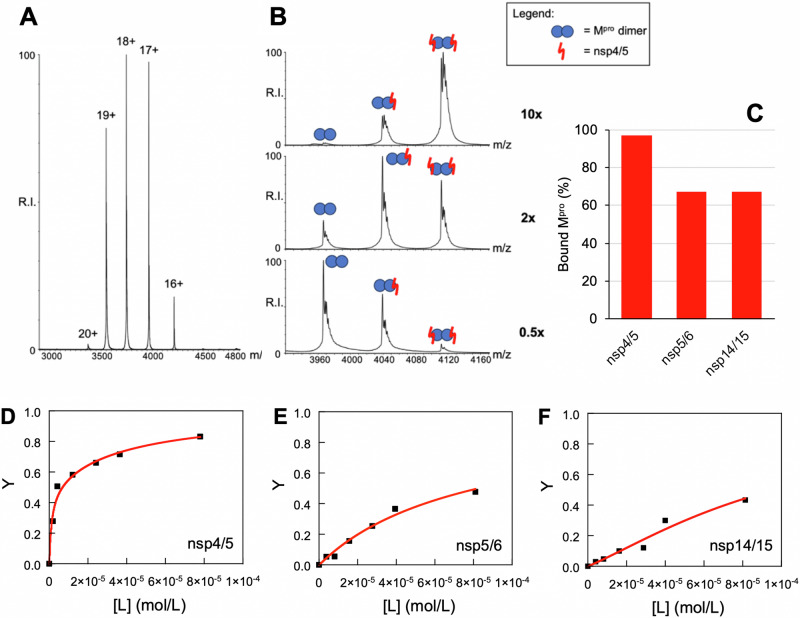
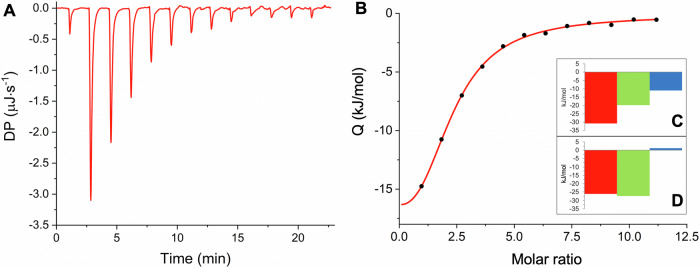
Many enzymes work as homodimers with two distant catalytic sites, but the reason for this choice is often not clear. For the main protease Mpro of SARS-CoV-2, dimerization is essential for function and plays a regulatory role during the coronaviral replication process. Here, to analyze a possible allosteric mechanism, we use X-ray crystallography, native mass spectrometry, isothermal titration calorimetry, and activity assays to study the interaction of Mpro with three peptide substrates. Crystal structures show how the plasticity of Mpro is exploited to face differences in the sequences of the natural substrates. Importantly, unlike in the free form, the Mpro dimer in complex with these peptides is asymmetric and the structures of the substrates nsp5/6 and nsp14/15 bound to a single subunit show allosteric communications between active sites. We identified arginines 4 and 298 as key elements in the transition from symmetric to asymmetric dimers. Kinetic data allowed the identification of positive cooperativity based on the increase in the processing efficiency (kinetic allostery) and not on the better binding of the substrates (thermodynamic allostery). At the physiological level, this allosteric behavior may be justified by the need to regulate the processing of viral polyproteins in time and space.


Conflict of interest statement

The authors declare no competing interests.

Figures

Fig. 1
Fig. 1. Mpro substrate peptides.
Sequences of the peptides synthesized and studied in this work are shown in bold. The other sequences processed by Mpro are indicated for comparison. The conventional terminology for the positions of the residues in the substrate peptides (P and P’ positions) is indicated.
Fig. 2
Fig. 2. Structure of the free form of the inactive mutant of Mpro (symmetric dimer).
A The superposition of our inactive mutant of Mpro and wtMpro (6Y2E) shows how the two mutations Cys145Ala and His41Ala did not introduce significant alterations in the structure of the enzyme. His41 and Cys145 in the active site of 6Y2E wtMpro are shown in stick. B Plot of the deviations of the Cα atoms versus the residue number for inactive Mpro (this study) superposed to active wtMpro (PDB 6Y2E); total rmsd values (in Å) are indicated for the best aligned and total atom pairs, respectively. The region connecting the second and third domains of Mpro, residues 190-198 (“connecting region”), shows the highest variations. The structure of the oxyanion loop and other relevant areas surrounding the active site are conserved.
Fig. 3
Fig. 3. Binding of the substrate peptide nsp4/5 induces the formation of an asymmetric dimer.
A, B The substrate peptide nsp4/5 (in sticks) bound to the two active sites of dimeric Mpro. C, D Close-up views of the substrate peptide nsp4/5 at the active site of subunits A and B, respectively. The surface is colored according to the electrostatic potential. Note the differences in the residues at the extremities, in particular P6 and P5’ (missed in nsp4/5 bound to chain B). E, F Subunits A and B, respectively, colored according to B-factors (from 25 Å2 blue to 75 Å2 red; average B for all atoms 50.7 Å2). The major differences are at domain I (circled) facing the binding site, in particular at residues 44–50. Asp48 (in stick) and its distance to Gln P1 (dashed line, between Cα atoms) are indicated. In (A, B, E, F) the C-terminal ends are indicated to underline their differences in the two subunits.
Fig. 4
Fig. 4. Binding of the substrate peptide nsp4/5 induces structural modifications of the active site.
A Superposition of chains A and B of the nsp4/5-Mpro complex to the free form of the enzyme. The highest variations induced by binding are near the active site, and locate at β-turn 22–26, residues 166–172 (part of the β-hairpin loop), connecting region 187–199 and, mainly, residues 44–50. B Plot of the deviations of the Cα atoms versus the residue number of the two subunits of the nsp4/5-Mpro complex superposed to free Mpro; total rmsd values (in Å) for the best aligned and total atom pairs, respectively, are indicated.
Fig. 5
Fig. 5. Comparison between soaked and cocrystallized complexes of substrate peptide nsp4/5.
A Superposition of the peptide substrate nsp4/5 complexes for the soaked and cocrystallized structures. The C-terminal tail of the nsp4/5 soaked structure is similar to the free enzyme and to subunit B in the cocrystallized structure, but different from subunit A in the cocrystallized structure. B Superposition of nsp4/5 in the soaked and cocrystallized structures; surface colored according to electrostatics corresponds to the soaked structure. Note that Arg P4’ is in very different positions. C Plot of the deviations of the Cα atoms versus the residue number of cocrystallized and soaked nsp4/5-Mpro complexes, superposed to free Mpro; total rmsd values (in Å) are indicated for the best aligned and total atom pairs, respectively.
Fig. 6
Fig. 6. The substrate peptide nsp5/6 binds to only one subunit.
A, B The substrate peptide nsp5/6 (green carbon atoms, in sticks) bound to only one subunit (A) of dimeric Mpro; the C-terminal tail of subunit A is disordered in solution. In subunit B, the active site is empty, residues 44–52 are missing, and the C-terminal tail is in the canonical position in the inter-subunit space, near the binding site of A. C superposition of substrate peptides nsp4/5 and nsp5/6; the backbone is similar from position P3 to position P2’. Lys P4’ and Arg P5’ are flexible and were not modeled in nsp5/6. Surface colored according to electrostatics corresponds to the nsp5/6 complex. D Plot of the deviations of the Cα atoms versus the residue number of the two subunits of the nsp5/6-Mpro complex superposed on free Mpro; total rmsd values (in Å) are indicated for best aligned and total atom pairs, respectively.
Fig. 7
Fig. 7. As nsp5/6, the substrate peptide nsp14/15 binds to only one subunit.
A, B The substrate peptide nsp14/15 (green carbon atoms, in sticks) binds to only one subunit (A) of the dimeric Mpro, similarly to nsp5/6. The C-terminal tail of subunit A is disordered in solution. In subunit B, the active site is empty, residues 44–52 are missing and the C-terminal tail is in the canonical position in the inter-subunit space, near the binding site of (A). C Superposition of nsp14/15 and nsp4/5; the backbone is similar from position P4 to P2’, while positions P5, P6, P3’ and P4’ are different. The surface of the nsp14/15 complex colored according to electrostatics is shown. D Plot of the deviations of the Cα atoms versus the residue number of the two subunits of the nsp14/15-Mpro complex, superposed on free Mpro; total rmsd values (in Å) are indicated for best aligned and total atom pairs, respectively.
Fig. 8
Fig. 8. Arg298 movement connected to the first binding.
In the free form of Mpro, Arg298 interacts mainly with Asp295 from the same subunit, as shown in the left panel. As a consequence of the first binding to subunit A (nsp5/6 in the central panel), Arg298-A moves away from Asp295-A towards Met6-A and Ser123-B, making a stacking interaction with Phe8-A. The stacking interaction of aromatic residues Phe8-A, Met6-A, Tyr126-B and Phe140-B, connecting Arg298-A to the active site of subunit B, are indicated with green dotted lines. Main hydrogen bonds are indicated with blue dotted lines. The superposition of the two structures with the underlined main movements around Arg298-A are shown in the right panel. Electron density maps are reported in Supplementary Fig. 7.
Fig. 9
Fig. 9. Arg4 movement connected to the second binding.
In the nsp4/5 complex, Arg4-B is inserted into subunit A (left panel) and interacts strongly with Glu290-A. The same interaction is seen in symmetric free-Mpro where it is repeated for the symmetrically related Arg-A and Glu290-B. Instead, in the asymmetric nsp4/5 complex, Arg4-A moves away from Glu290-B toward Gln127-B and Lys137-B (central panel). In the right panel, superposition of the two conformations is shown, with light green and dark green dotted lines indicating the different interactions of Arg4-B and Arg4-A, respectively (as reported in the left and central panels). Electron density maps are reported in Supplementary Fig. 8.
Fig. 10
Fig. 10. Analysis of the Mpro interactions with substrate peptides by nMS.
Representative ESI-MS spectrum of free Mpro at a concentration of 8.5 μM (monomer) (A) and of samples containing a 1:0.5, 1:2, and 1:10 molar ratio of Mpro and nsp4/5 (B) in 150 mM ammonium acetate. C Histograms displaying the percentage of Mpro molecules with at least one active site occupied by the ligand (bound Mpro) observed at the 1:10 molar ratio between Mpro and each peptide. D, E, F Representative saturation curves of Mpro active sites (Y is the fraction of active sites occupied by the ligand) by increasing amounts of substrate peptides nsp4/5, nsp5/6 and nsp14/15, respectively. In the abscissa, [L] is the concentration of the free ligand (i.e. substrate peptides). The red curves refer to the fitting by the sequential binding model (see experimental, Eq. (3)); fitting R2 = 0.985 for nsp4/5 (D), 0.982 for nsp5/6 (E) and 0.958 for nsp14/15. The derived apparent and intrinsic dissociation constants reported in Table 2 are the mean of the values obtained by the fittings of two independent titration experiments. Reported errors are the half-difference between the maximum and the minimum values.
Fig. 11
Fig. 11. ITC substrate binding measurements.
In (A, B), representative raw ITC data and final binding thermogram of the Mpro titration by the peptide substrate nsp4/5, respectively. In (B), the red curve refers to the sequential binding model fitting as implemented in the Microcal PEAQ-ITC analysis software (reduced χ2 = 0.027). The derived dissociation constants reported in Table 2 are the mean of three independent experiments. Errors are the half-difference between the maximum and the minimum values. In insert panels C and D, the energetics of the first and second bindings are reported, respectively. ΔG in red, ΔH in green and ΔS in blue.
Fig. 12
Fig. 12. wtMpro kinetics with the substrate peptide nsp4/5.
A representative plot (one out of three experiments) of the initial velocities v0 versus increasing concentrations of substrate peptide nsp4/5. The experimental points (black squares) were fitted with the Hill equation (left, R2 = 0.999) (see experimental, Eq. (4)). The inserted panel, which represents the zoomed-in data at very low substrate concentrations, shows the sigmoidal trend typical of a positive cooperativity; for comparison, the hyperbolic fitting with the classical Michaelis-Menten model is shown with a grey dotted line. The same plot was then fitted with an allosteric model (Eq. (7)) described in the experimental section (right, R2 = 0.999). R2 is the coefficient of determination of the fittings. The final Hill coefficient h, the apparent dissociation constants K1’ and K2’, as well as the kinetic constants kc1 and kc2 are reported in Table 2. The reported values of h, kc1 and kc2 are the mean of three independent experiments, and the errors are the half-difference between the maximum and the minimum values.
Fig. 13
Fig. 13. Proposed model of the Mpro catalytic cycle regulated by positive cooperativity.
State (1) corresponds to the structure of the symmetric free enzyme, state (2) to the complexes with nsp5/6 or 14/15, and state (3) to the complex with nsp4/5. For nsp4/5, K2’ > K1’, and K2 approximately twice K1 (moderate negative cooperativity for binding), while kc2 is 1.20 s−1 and kc1 is 0.014 s−1, determining the overall positive cooperativity of the catalysis. Further details are discussed in the main text.

References

    1. Xia, B. & Kang, X. Activation and maturation of SARS-CoV main protease. Protein Cell2, 282–290 (2011). - PMC - PubMed
    1. Zhang, L. et al. Crystal structure of SARS-CoV-2 main protease provides a basis for design of improved α-ketoamide inhibitors. Science368, 409–412 (2020). - PMC - PubMed
    1. Kim, T. H. et al. The role of dimer asymmetry and protomer dynamics in enzyme catalysis. Science355, eaag2355 (2017). - PubMed
    1. Snijder, E. J., Decroly, E. & Ziebuhr, J. Chapter Three - The Nonstructural Proteins Directing Coronavirus RNA Synthesis and Processing. in Advances in Virus Research (ed. Ziebuhr, J.) vol. 96 59–126 (Academic Press, 2016). - PMC - PubMed
    1. Dai, W. et al. Structure-based design of antiviral drug candidates targeting the SARS-CoV-2 main protease. Science368, 1331–1335 (2020). - PMC - PubMed

Substances

LinkOut - more resources