. 2025 Mar;46(3):777-793.
doi: 10.1038/s41401-024-01407-4. Epub 2024 Nov 4.

Intestinal human carboxylesterase 2 (CES2) expression rescues drug metabolism and most metabolic syndrome phenotypes in global Ces2 cluster knockout mice

Affiliations

Intestinal human carboxylesterase 2 (CES2) expression rescues drug metabolism and most metabolic syndrome phenotypes in global Ces2 cluster knockout mice

Yao-Geng Wang et al. Acta Pharmacol Sin. 2025 Mar.

Abstract

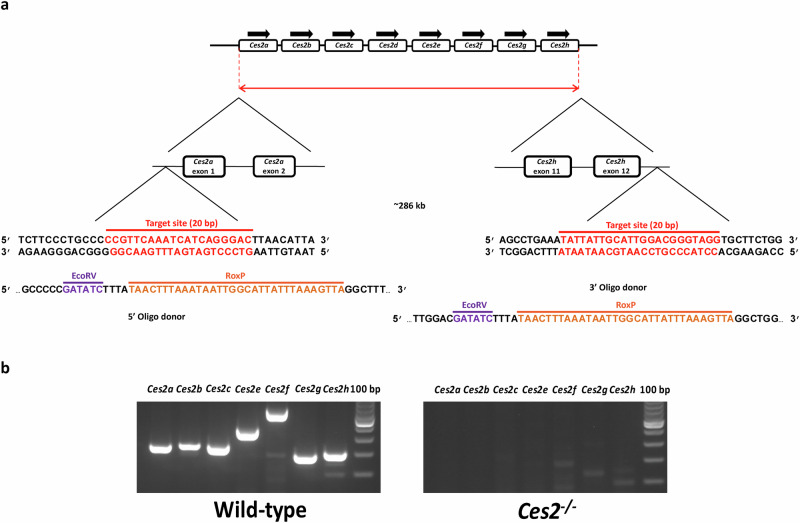
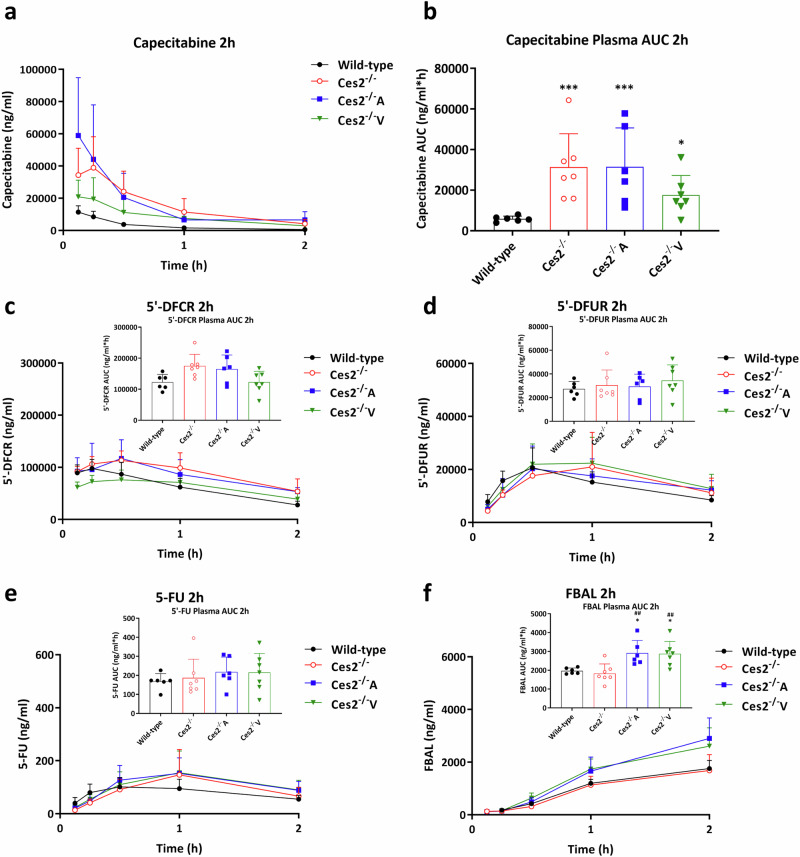
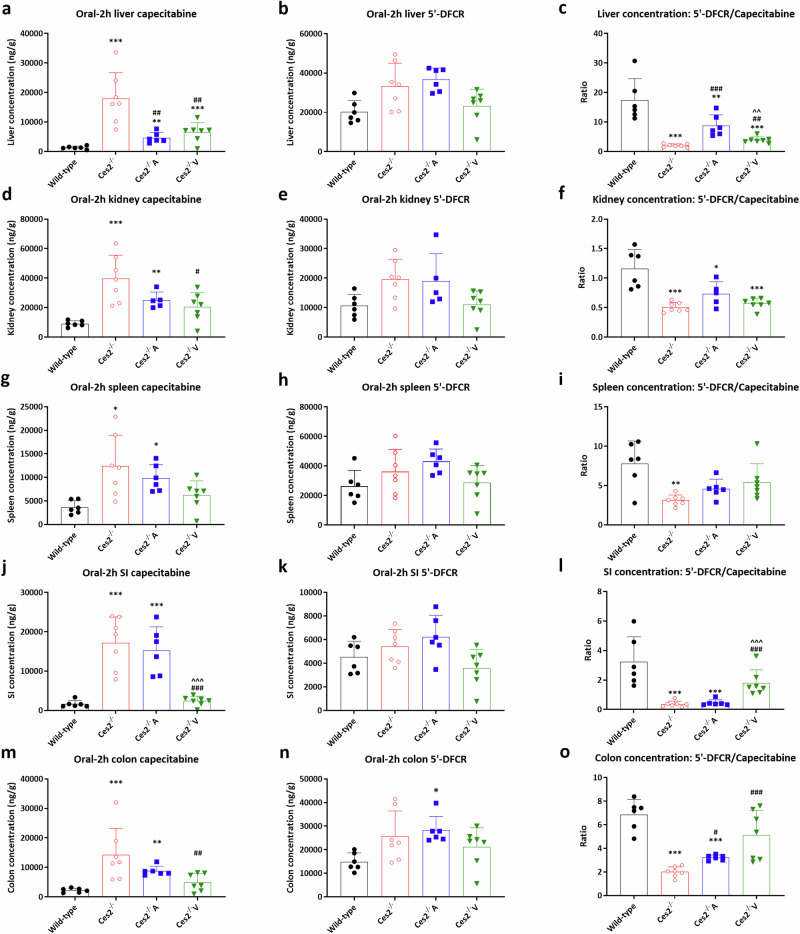
Carboxylesterase 2 (CES2) is expressed mainly in liver and intestine, but most abundantly in intestine. It hydrolyzes carboxylester, thioester, and amide bonds in many exogenous and endogenous compounds, including lipids. CES2 therefore not only plays an important role in the metabolism of many (pro-)drugs, toxins and pesticides, directly influencing pharmacology and toxicology in humans, but it is also involved in energy homeostasis, affecting lipid and glucose metabolism. In this study we investigated the pharmacological and physiological functions of CES2. We constructed Ces2 cluster knockout mice lacking all eight Ces2 genes (Ces2-/- strain) as well as humanized hepatic or intestinal CES2 transgenic strains in this Ces2-/- background. We showed that oral availability and tissue disposition of capecitabine were drastically increased in Ces2-/- mice, and tissue-specifically decreased by intestinal and hepatic human CES2 (hCES2) activity. The metabolism of the chemotherapeutic agent vinorelbine was strongly reduced in Ces2-/- mice, but only marginally rescued by hCES2 expression. On the other hand, Ces2-/- mice exhibited fatty liver, adipositis, hypercholesterolemia and diminished glucose tolerance and insulin sensitivity, but without body mass changes. Paradoxically, hepatic hCES2 expression rescued these metabolic phenotypes but increased liver size, adipose tissue mass and overall body weight, suggesting a "healthy" obesity phenotype. In contrast, intestinal hCES2 expression efficiently rescued all phenotypes, and even improved some parameters, including body weight, relative to the wild-type baseline values. Our results suggest that the induction of intestinal hCES2 may combat most, if not all, of the adverse effects of metabolic syndrome. These CES2 mouse models will provide powerful preclinical tools to enhance drug development, increase physiological insights, and explore potential solutions for metabolic syndrome-associated disorders.

Keywords: capecitabine; carboxylesterase 2; glucose homeostasis; lipid metabolism; metabolic syndrome; vinorelbine.


Conflict of interest statement

Competing interests: The research group of Alfred Schinkel declares no conflict of interest, nor do any of the other authors.

Figures

Fig. 1
Fig. 1. Ces2 knockout mouse model generation and characterization.
a Schematic overview of the CRISPR-Cas9 strategy for deletion of the Ces2 cluster genes and (b) PCR analysis for all known functional Ces2 genes in tail DNA of WT and Ces2−/− mice.
Fig. 2
Fig. 2. Generation and characterization of human CES2 liver- or intestine-specific transgene expressing mouse models.
a Schematic structure of ApoE promoter-HCR1-driven expression cassette containing human CES2 cDNA; (b) schematic structure of Villin promoter-driven expression cassette containing human CES2 cDNA; (c) western blot analysis of crude membrane fractions of liver, kidney, small intestine (SI) and colon from wild-type, Ces2–/–, human CES2 liver transgenic (Ces2–/–A) and human CES2 intestine transgenic (Ces2–/–V) mice; human liver and human small intestinal (SI) lysates were used as positive controls and for comparison on the Western blots; (d) immunohistochemical staining of human CES2 in liver, small intestine and kidney of wild-type, Ces2–/–A and Ces2–/–V mice.
Fig. 3
Fig. 3. Capecitabine plasma pharmacokinetic results in CES2-modified mouse models.
Plasma concentration-time curves (a) and AUC0-2h (b) of capecitabine and corresponding results of metabolites 5’-DFCR (c), 5’-DFUR (d), 5-FU (e) and FBAL (f) in female wild-type, Ces2–/–, Ces2–/–A and Ces2–/–V mice over 2 h after oral administration of 500 mg/kg capecitabine. Data are given as mean ± SD (n = 5–7). *, P < 0.05; ***, P < 0.001 compared to wild-type mice. ##, P < 0.01; compared to Ces2–/– mice. No statistical differences were found between Ces2–/–A and Ces2–/–V mice. Statistical analysis was applied after log-transformation of linear data.
Fig. 4
Fig. 4. Tissue distribution results of capecitabine and its first metabolite 5’-DFCR.
Liver, kidney, spleen, small intestine (SI) and colon concentrations of capecitabine (a, d, g, j and m) and 5’-DFCR (b, e, h, k and n), and capecitabine to 5’DFCR conversion ratios in above mentioned tissues (c, f, i, l and o) in female wild-type, Ces2–/–, Ces2–/–A and Ces2–/–V mice over 2 h after oral administration of 500 mg/kg capecitabine. Data are given as mean ± SD (n = 5–7). *, P < 0.05; **, P < 0.01; ***, P < 0.001 compared to wild-type mice. #, P < 0.05; ##, P < 0.01; ###, P < 0.001 compared to Ces2–/– mice. ^^, P < 0.01; ^^^, P < 0.001 for comparison between Ces2–/–A and Ces2–/–V mice. Statistical analysis was applied after log-transformation of linear data.
Fig. 5
Fig. 5. Vinorelbine plasma pharmacokinetic results in CES2-modified mouse models.
Plasma concentration-time curves and AUC0–4h of vinorelbine and its metabolite deacetylvinorelbine in male wild-type, Ces2–/–, Ces2–/–A and Ces2–/–V mice over 4 h after oral administration (ad) or intravenous injection (eh) of 10 mg/kg vinorelbine. Data are given as mean ± SD (n = 6–7). *, P < 0.05; ***, P < 0.001 compared to wild-type mice. ##, P < 0.01; ###, P < 0.001 compared to Ces2–/– mice. Statistical analysis was applied after log-transformation of linear data.
Fig. 6
Fig. 6. Basic physiological analysis of the CES2 mouse models.
Body weight development from 4 to 20 weeks of age for females (a) and males (b); representative images of gonadal white adipose tissue of male mice from each mouse strain (c) and semi-quantified gonadal white adipose tissue adipositis levels (d) of 20-week-old wild-type, Ces2–/–, Ces2–/–A and Ces2–/–V mice after body weight measurement from 4 weeks to 20 weeks of age. Data are given as mean ± SD (n = 19–20). *, P < 0.05; **, P < 0.01; ***, P < 0.001 compared to wild-type mice. #, P < 0.05; ##, P < 0.01; ###, P < 0.001 compared to Ces2–/– mice. ^, P < 0.05; ^^, P < 0.01; ^^^, P < 0.001 for comparison between Ces2–/–A and Ces2–/–V mice. Statistical analysis was applied after log-transformation of linear data. For the scoring criteria in panel (d), please refer to the supplementary methods section 2.5.1; the Kruskal-Wallis rank test was used.
Fig. 7
Fig. 7. Lipid disposition, metabolism and homeostasis in the CES2 mouse models.
Semi-quantified Oil-red-O staining lipid droplet levels (a) and representative Oil-red-O staining images for liver lipid accumulation for each mouse strain (b) in male wild-type, Ces2–/–, Ces2–/–A and Ces2–/–V 20-week old mice (n = 19–21; body weight of each individual mouse presented is indicated); (c) liver lipid contents in male wild-type, Ces2–/–, Ces2–/–A and Ces2–/–V 20-week old mice (n = 8); (d) plasma triglyceride basal concentration (overnight fast) before very low-density lipoprotein (VLDL) production and secretion and oral lipid tolerance test in male wild-type, Ces2–/–, Ces2–/–A and Ces2–/–V 12-week old mice (n = 20–24); (e) VLDL production and secretion and (f) oral lipid tolerance test in male wild-type, Ces2-/-, Ces2-/-A and Ces2-/-V 12-week old mice (n = 10–12). Data are given as mean ± SD. *, P < 0.05; **, P < 0.01; ***, P < 0.001 compared to wild-type mice. #, P < 0.05; ##, P < 0.01; ###, P < 0.001 compared to Ces2-/- mice. ^^, P < 0.01; for comparison between Ces2–/–A and Ces2–/–V mice. Statistical analysis was applied after log-transformation of linear data. For the scoring criteria in panel (a), please refer to the supplementary methods section 2.5.2; the Kruskal-Wallis rank test was used.
Fig. 8
Fig. 8. Glucose metabolism and homeostasis in the CES2 mouse models.
The plasma glucose concentration time curve (a), plasma glucose concentration to basal glucose concentration (before glucose administration) ratio time curve (b) and glucose AUC0-3h (c) in male wild-type, Ces2–/–, Ces2–/–A and Ces2–/–V 12-week old mice over a 3 h glucose tolerance test after oral administration of 1 mg/g glucose; The plasma glucose concentration time curve (d), plasma glucose concentration to basal glucose concentration (before insulin injection) ratio time curve (e) and glucose AUC0-3h (f) in male wild-type, Ces2–/–, Ces2–/–A and Ces2–/–V 16-week old mice over a 3-h insulin tolerance test after i.p. injection of 0.5 U/kg insulin. Data are given as mean ± SD (n = 15–16). *, P < 0.05; **, P < 0.01; ***, P < 0.001 compared to wild-type mice. #, P < 0.05; ##, P < 0.01; ###, P < 0.001 compared to Ces2–/– mice. Statistical analysis was applied after log-transformation of linear data.

References

    1. Wang D, Zou L, Jin Q, Hou J, Ge G, Yang L. Human carboxylesterases: a comprehensive review. Acta Pharm Sin B. 2018;8:699–712. - PMC - PubMed
    1. Sanghani SP, Sanghani PC, Schiel MA, Bosron WF. Human carboxylesterases: an update on CES1, CES2 and CES3. Protein Pept Lett. 2009;16:1207–14. - PubMed
    1. Satoh T, Hosokawa M. The mammalian carboxylesterases: from molecules to functions. Annu Rev Pharmacol Toxicol. 1998;38:257–88. - PubMed
    1. Yoshida T, Fukami T, Kurokawa T, Gotoh S, Oda A, Nakajima M. Difference in substrate specificity of carboxylesterase and arylacetamide deacetylase between dogs and humans. Eur J Pharm Sci. 2018;111:167–76. - PubMed
    1. Laizure SC, Herring V, Hu Z, Witbrodt K, Parker RB. The role of human carboxylesterases in drug metabolism: have we overlooked their importance? Pharmacotherapy. 2013;33:210–22. - PMC - PubMed

LinkOut - more resources