. 2024 Dec;56(12):2804-2814.
doi: 10.1038/s41588-024-01967-5. Epub 2024 Nov 4.

Grapevine pangenome facilitates trait genetics and genomic breeding

Affiliations

Grapevine pangenome facilitates trait genetics and genomic breeding

Zhongjie Liu et al. Nat Genet. 2024 Dec.

Abstract

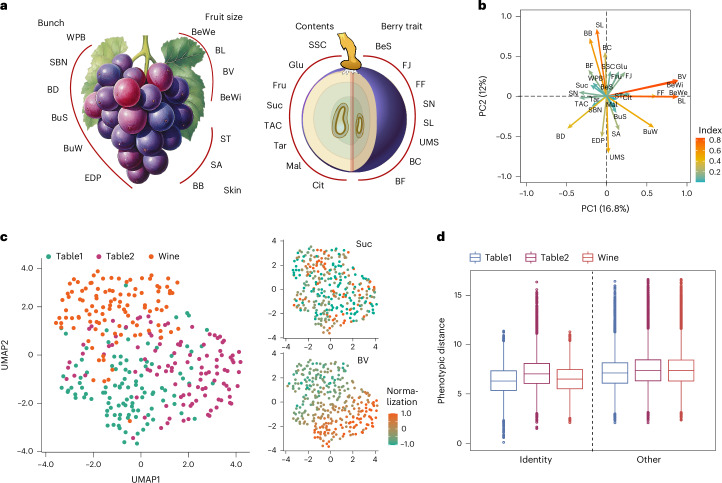
Grapevine breeding is hindered by a limited understanding of the genetic basis of complex agronomic traits. This study constructs a graph-based pangenome reference (Grapepan v.1.0) from 18 newly generated phased telomere-to-telomere assemblies and 11 published assemblies. Using Grapepan v.1.0, we build a variation map with 9,105,787 short variations and 236,449 structural variations (SVs) from the resequencing data of 466 grapevine cultivars. Integrating SVs into a genome-wide association study, we map 148 quantitative trait loci for 29 agronomic traits (50.7% newly identified), with 12 traits significantly contributed by SVs. The estimated heritability improves by 22.78% on average when including SVs. We discovered quantitative trait locus regions under divergent artificial selection in metabolism and berry development between wine and table grapes, respectively. Moreover, significant genetic correlations were detected among the 29 traits. Under a polygenic model, we conducted genomic predictions for each trait. In general, our study facilitates the breeding of superior cultivars via the genomic selection of multiple traits.


Conflict of interest statement

Competing interests: The authors declare no competing interests.

Figures

Fig. 1
Fig. 1. T2T genome assemblies and the construction of Grapepan v.1.0.
a, NGx plot showing the assembly continuity of the 18 newly assembled haplotypes compared with the published PNT2T assembly. Two haplotypes (haplotype 1 and haplotype 2) of the same individual are distinguished. b, Assessment of the assembly for nine sequenced grape accessions (BMNG, HMNG, MH, WG, MF, PN, SM, TS and BM). The quality values demonstrate the base-level accuracy of each sample. The phasing accuracy is indicated by the percentages of switch errors and hamming errors. c, Comparative genomics of 27 (published genomes only selected the primary haplotype) assemblies and one assembly of Muscadinia rotundifolia as outgroup for chromosome 1. d, Total length of MC pangenome sequences with different numbers of haplotypes; M represents megabase pairs and G represents gigabase pairs. e, Validation of pangenome deletions and insertions involved counting SVs of varying lengths and calculating the accuracy. f, PCA of the first two components of the 466 sequenced grape accessions. Different grape groups are distinguished by different colors. The samples used to construct Grapepan v.1.0 represent a wide range of genetic diversity. PC, principal component. g, The decay of LD was calculated based on three different datasets: SVs, SNPs and SVs + SNPs.
Fig. 2
Fig. 2. The correlation of 29 agronomic traits among different grape populations.
a, Schematic diagram of agronomic traits of grape fruits investigated, including five identified categories. Traits in each category are labeled. b, PCA map showing the relationships among all agronomic traits. The distance between variables and the origin measures the quality (index by cos2 value) of the variables. c, UMAP plot (base map) generated from 29 trait scores for three grape populations. Scores were scaled and centered (Z-score) across all individuals for each trait independently. The points indicate individual grapes and are colored by different populations. UMAP plots from content of Suc and BV traits were generated by mapping these scores to the UMAP base map. d, Box plot of mean pairwise phenotypic distances within the population (identity), and between all other populations (other). Sample sizes are 5,778, 5,778, 5,565, 23,112, 23,112 and 22,896 pairs. Boxes, 25% to 75% quartiles; horizontal line, median; whiskers, inner fence within 1.5× box height; circles, outliers within 1.5× box height; asterisks, outliers beyond 1.5× box height. Statistical significance was determined by two-sided Student’s t-tests. BB, berry bloom; BC, berry color; BD, bunch density; BeS, berry shape; BF, particularity of flavor; BuS, bunch shape; BuW, weight of a single bunch; Cit, content of citric acid; EDP, ease of detachment from pedicel; FF, firmness of flesh; FJ, juiciness of flesh; Mal, content of malic acid; SA, astringent of skin; SBN, number of subsidiary bunch; SL, length of seeds; SN, number of seeds; ST, thickness of skin; UMS, uniformity of time of physiological stage of full maturity of the berry; WPB, number of wings of the primary bunch.
Fig. 3
Fig. 3. Candidate loci associated with agronomic traits and their genomic footprints of artificial selection.
a, Integrated GWAS map for 29 grape agronomic traits. The ordinate represents the PVE of the trait. bd, Three significant SVs for BL1 (b), SN6 (c) and Suc1 (d) GWAS loci and their populational frequencies. Left, Gene models with coding regions and transcription direction. The corresponding deletions and insertions are highlighted. Right, Proportions of different genotypes in three populations. e,f, The GWAS results and linkage for SSC7 (e) and BeWi9 (f) loci. Statistical significance was determined by generalized least squares F-test. g, The nucleotide diversity (π) and FST around this candidate region. The vertical dashed lines indicate the combined GWAS loci of BeWi or SSC traits, VL represents V. labrusca. h, Proportions of different genotypes at significant SNP sites in BeWi (nGT0/0 = 272, nGT0/1 = 51) and SSC (nGT0/0 = 288, nGT0/1 = 58) in 2016 (center line, median; box limits, first and third quartiles; whiskers, 1.5× interquartile range). nGT0/0 and nGT0/1 refer to the counts of different genotypes at significant SNP sites. Statistical significance was determined by two-sided Student’s t-tests. i, Gene annotation in candidate region (upper) and expression level (transcripts per kilobase of exon model per million mapped reads) of genes in the candidate region in different grape cultivars (lower).
Fig. 4
Fig. 4. Divergent selection on agronomic traits among subpopulations.
a,b, Selection of the XP-EHH genomic scan for the Table1 versus Table2 (a) and Wine versus Table1 (b). nSites = 8,508, FDR (Benjamini–Hochberg) correction. Arrows indicate the highly correlated loci associated with the agronomic traits analyzed by GWAS. c,d, GSEA analyzes genes ranked in divergent regions of the genome and included two comparisons, Table1 versus Table2 (c) and Wine versus Table1 (d). The vertical dashed lines indicate the leading-edge subset and the max rank of the enriched gene.
Fig. 5
Fig. 5. Missing heritability, genetic correlations and genomic predictions of agronomic traits.
a, The heritability of 29 traits contributed by genomic SVs and SNPs. The contributions from SNP and SV were distinguished. b, The genetic correlations among 29 traits. FDR (Benjamini–Hochberg) corrected. c, The genotypes of the gene Vitvi011368 and SSC in each group. Top, schematic diagram of a deletion in the region including the gene Vitvi011368. Bottom, SSC2 values in each group with different genotypes (center line, median; box limits, first and third quartiles; whiskers, 1.5× interquartile range). The sample sizes, from left to right, are [6, 50, 54], [6, 40, 61] and [10, 42, 50]. Statistical significance was determined using two-sided Student’s t-tests. d, GWAS result and LD analysis of the BL2 locus, which contained a candidate gene, Vitvi018414. Differences in BL between populations and genotypes were estimated (center line, median; box limits, first and third quartiles; whiskers, 1.5× interquartile range). The sample sizes, from left to right, are [38, 70], [12, 96] and [103, 3]. Statistical significance was determined using two-sided Student’s t-tests. e, Linear regression analysis for phenotype prediction between SSC2 values and values predicted by LDpred2-auto. The confidence interval (CI) is shown by gray shading. The smoothed line represents a linear regression fit of the actual data, and the shading represents the CI. Sample size n = 29. f, Linear regression analysis for phenotype prediction between BL values and predicted values by lassoum2. The significance of the linear relationship between variables was evaluated through Pearson correlation coefficients. The smoothed line represents a linear regression fit of the actual data, and the shading represents the CI. Sample size n = 29. °Bx, degrees Brix; NS, nonsignificant.

References

    1. Myles, S. et al. Genetic structure and domestication history of the grape. Proc. Natl Acad. Sci. USA108, 3530–3535 (2011). - PMC - PubMed
    1. Zhou, Y., Massonnet, M., Sanjak, J. S., Cantu, D. & Gaut, B. S. Evolutionary genomics of grape (Vitis vinifera ssp. vinifera) domestication. Proc. Natl Acad. Sci. USA114, 11715–11720 (2017). - PMC - PubMed
    1. McGovern, P. et al. Early neolithic wine of Georgia in the South Caucasus. Proc. Natl Acad. Sci. USA114, E10309–E10318 (2017). - PMC - PubMed
    1. Freitas, S. et al. Pervasive hybridization with local wild relatives in Western European grapevine varieties. Sci. Adv.7, eabi8584 (2021). - PMC - PubMed
    1. Magris, G. et al. The genomes of 204 Vitis vinifera accessions reveal the origin of European wine grapes. Nat. Commun.12, 7240 (2021). - PMC - PubMed