. 2024 Dec;56(12):2815-2826.
doi: 10.1038/s41588-024-01968-4. Epub 2024 Nov 4.

The ZmCPK39-ZmDi19-ZmPR10 immune module regulates quantitative resistance to multiple foliar diseases in maize

Affiliations

The ZmCPK39-ZmDi19-ZmPR10 immune module regulates quantitative resistance to multiple foliar diseases in maize

Mang Zhu et al. Nat Genet. 2024 Dec.

Erratum in

Abstract

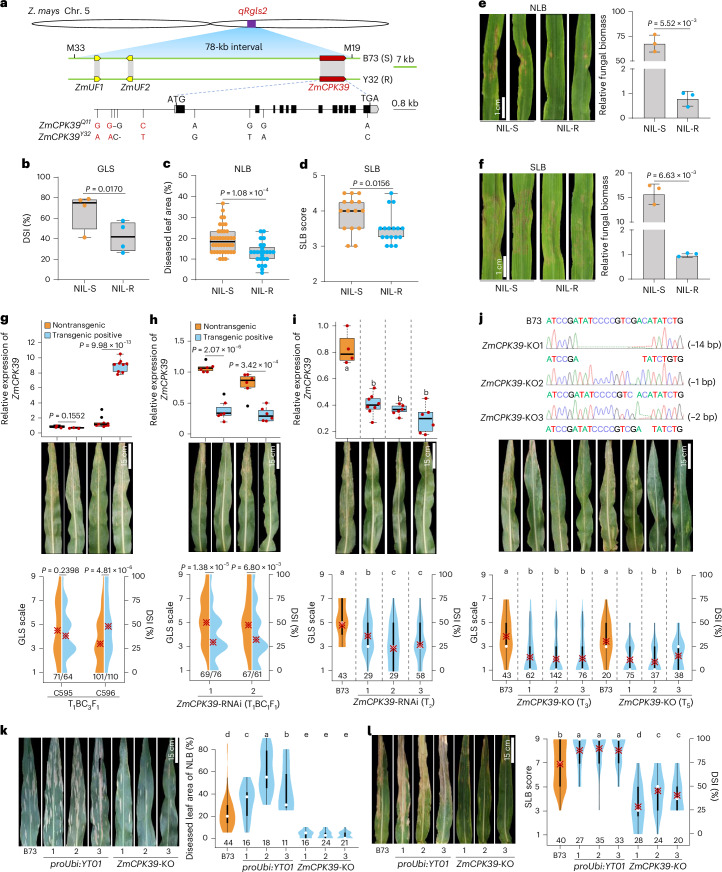
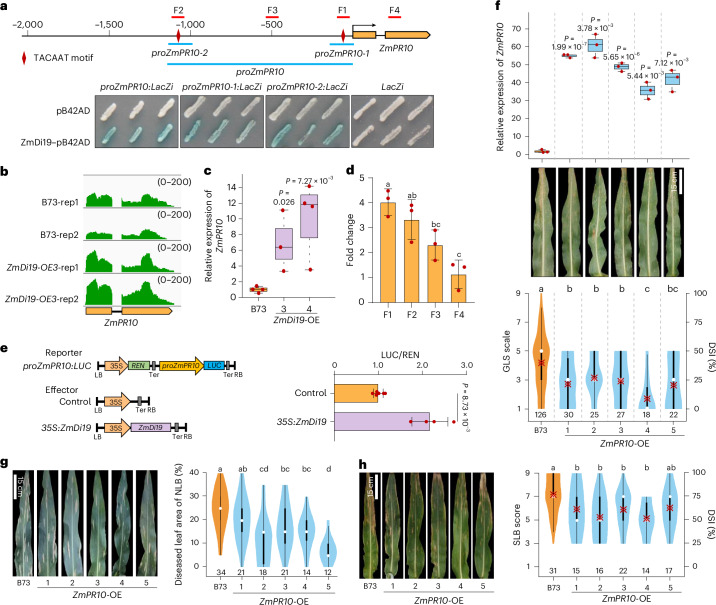
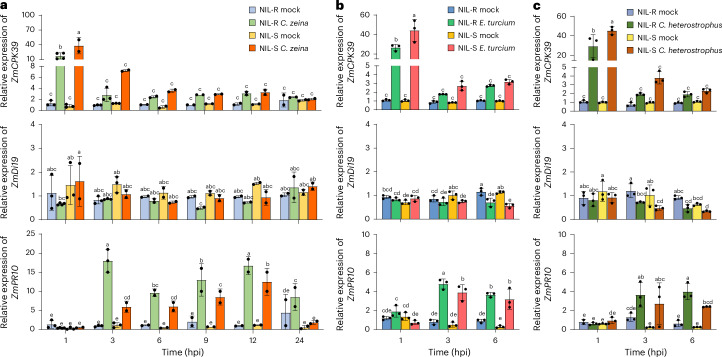
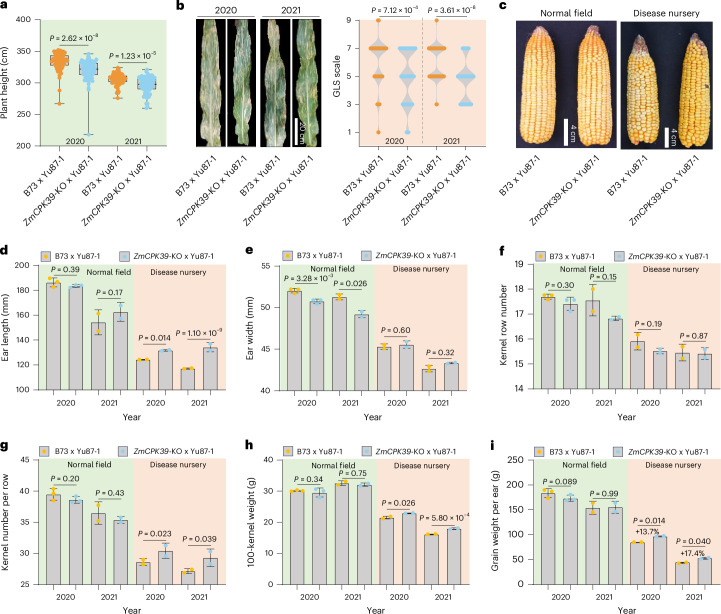
Gray leaf spot, northern leaf blight and southern leaf blight are three of the most destructive foliar diseases affecting maize (Zea mays L.). Here we identified a gene, ZmCPK39, that encodes a calcium-dependent protein kinase and negatively regulates quantitative resistance to these three diseases. The ZmCPK39 allele in the resistant line displayed significantly lower pathogen-induced gene expression than that in the susceptible line. A marked decrease in ZmCPK39 abundance mitigated the phosphorylation and degradation of the transcription factor ZmDi19. This led to elevated expression of ZmPR10, a gene known to encode an antimicrobial protein, thereby enhancing maize resistance to foliar diseases. Moreover, the F1 hybrid with reduced ZmCPK39 expression favored disease resistance, thereby increasing yield. Hence, the discovery of the ZmCPK39-ZmDi19-ZmPR10 immune module provides insight into the mechanisms underlying broad-spectrum quantitative disease resistance and also offers a new avenue for the genetic control of maize foliar diseases.


Conflict of interest statement

Competing interests: The authors declare no competing interests.

Figures

Fig. 1
Fig. 1. Map-based cloning of the causative gene at the qRgls2 locus.
a, The mapped qRgls2 region contains three predicted genes. For the ZmCPK39 gene, gray boxes represent untranslated regions (UTRs), and black boxes indicate exons. bd, Resistance performance of NIL-S and NIL-R plants against GLS (b; n = 180), NLB (c; n = 65) and SLB (d; n = 32) in the field. e,f, qRgls2 conferred resistance to NLB (e) and SLB (f) in the growth chamber. Relative accumulation of E. turcicum (e) and C. heterostrophus (f) was quantified by RT–qPCR with three biological replicates (n = 3). Error bars, mean ± s.d. Scale bars = 1 cm. g, Functional verification of the intact native ZmCPK39Y32 allele in T1BC3F1 populations (n = 346). h,i, RNAi-mediated functional verification of ZmCPK39 in segregation backcross populations (h; n = 273) and homozygous transgenic lines (i; n = 159). Relative expression of ZmCPK39 in gi was determined by RT–qPCR (n = 3, 3; n = 9, 9; n = 6, 6; n = 6, 6; n = 4, 8, 6, 6). j, Functional verification using CRISPR–Cas9-induced ZmCPK39-KO lines in T3 (n = 323) and T5 (n = 170) generations. k,l, ZmCPK39 negatively regulates maize resistance to NLB (k; n = 150) and SLB (l; n = 207). Scale bars in gl = 15 cm. In b, statistical significance indicated by the P value was determined by a paired t test. Statistical significance in ch was determined by a two-tailed Student’s t test. Lowercase letters in il indicate significant differences determined by Duncan’s multiple-range test. In each box and whisker plot, the error bars represent the minimum and maximum values. Centerline, median; box limits, 25th and 75th percentiles. Whiskers mark the range of the data, excluding outliers. The violin plot in gl shows the phenotypic data distribution. The bars within violin plots represent the 95% confidence interval. The bold black line indicates the interquartile range. The white dots show the medians. An asterisk in a violin plot denotes the DSI value of each transgenic event. Chr. 5, chromosome 5. Source data
Fig. 2
Fig. 2. ZmDi19 interacts with ZmCPK39 and positively regulates maize resistance to GLS, NLB and SLB.
ac, Interaction of ZmCPK39 with ZmDi19 was detected using SLC (a), Co-IP (b) and pull-down assays (c). Scale bar in a = 1 cm. d, Y2H assay between ZmCPK39 and intact ZmDi19, as well as its ZmDi19 (1–135 amino acids) and ZmDi19 (136–228 amino acids) regions. e, ZmCPK39 and ZmDi19 were colocated at the plasma membrane. Scale bar = 20 μm. f, BiFC assay revealed the interaction between ZmCPK39 and ZmDi19 at the plasma membrane. Scale bar = 20 μm. g, ZmDi19-KO lines showed reduced GLS resistance in the T4 generation (n = 133). h, ZmDi19 expression levels in ZmDi19-OE lines and B73 were determined by RT–qPCR (n = 5, 3, 6, 3, 4). i, Overexpression of ZmDi19 enhanced GLS resistance in T1BC1F1 (n = 587) and T1BC3F1 (n = 273) populations. j,k, ZmDi19 positively regulates maize resistance to NLB (j; n = 256) and SLB (k; n = 136). Scale bar = 15 cm. Data in a are presented with five independent trials (n = 5). Statistical significance in a, g, j and k indicated by different lowercase letters was determined by Duncan’s multiple-range test. In h and i, statistical significance indicated by the P value was determined by a two-tailed Student’s t test. In the box and whisker plot, the error bars represent the minimum and maximum values. Centerline, median; box limits, 25th and 75th percentiles. Whiskers mark the range of the data, excluding outliers. The violin plots in g and ik show the phenotypic data distribution. The bars within the violin plots represent the 95% confidence interval. The bold black line indicates the interquartile range. The white dots show the medians. An asterisk in a violin plot denotes the DSI value of each transgenic event. The Co-IP, pull-down, Y2H and BiFC assays are repeated at least twice. DDO, double dropout medium. Source data
Fig. 3
Fig. 3. ZmCPK39 degrades ZmDi19 through phosphorylation at its Ser-117 site.
a, ZmDi19 expression levels among B73, its ZmCPK39-OE and ZmCPK39-KO plants were determined by RT–qPCR (n = 6, 6, 5). Error bars, mean ± s.d. b, ZmCPK39 promoted the degradation of ZmDi19 in vivo. Top, the reporter construct. Error bars, mean ± s.d. (n = 5). c, ZmCPK39 promoted the degradation of ZmDi19 that was inhibited by MG132 in vivo. Top, the effector construct. Error bars, mean ± s.d. (n = 6, 4, 6, 4). d, ZmDi19 levels decreased with the enrichment of ZmCPK39. REN and actin serve as loading controls. e, ZmCPK39 promoted ZmDi19 degradation that was inhibited by MG132. Actin serves as a loading control. f, ZmCPK39 phosphorylates ZmDi19 in the Phos-tag assay. A slow-migrating phosphorylated ZmDi19 band was marked as a red star. g, The phosphorylation activity of ZmCPK39 was enhanced with an increase in Ca2+ concentration. h, ZmCPK39 phosphorylates ZmDi19 in a Ca2+-dependent manner. i, The phosphorylation sites on ZmDi19. j, The cell-free degradation assay revealed that phosphorylation on Ser-117 in ZmDi19 promoted its degradation. HSP90 was used as a control. Error bars, mean ± s.d. (n = 3). k, The degradation of ZmDi19 mediated by its Ser-117 phosphorylation was inhibited by MG132. In ac and j, lowercase letters indicate significant differences determined by Duncan’s multiple-range test. In h, the correlation coefficient and P value were determined using the Pearson method. The in vitro degradation assay and in vivo phosphorylation assay were repeated twice. LC–MS/MS, liquid chromatography–tandem mass spectrometry. Source data
Fig. 4
Fig. 4. ZmDi19 activates gene expression of ZmPR10 and positively regulates maize resistance to GLS, NLB and SLB.
a, ZmDi19 binds to the promoter of ZmPR10 in the Y1H assay. b, Enrichment of the ZmPR10 transcript in ZmDi19-overexpressing transgenic plants compared to B73. c, The ZmPR10 expression levels in ZmDi19-overexpressing transgenic plants and B73 were determined by RT–qPCR with four or three samples as biological replicates (n = 4, 3, 4). d, DNA affinity purification qPCR identified significant enrichment in the fragment containing the TACAAT motif in the ZmPR10 promoter. The fragments F1 through F4 used in DNA affinity purification qPCR are indicated in a. Relative DNA-binding levels of ZmDi19 protein were normalized against the relative levels of input DNA. Fold changes were calculated relative to the F4 enriched level. Error bars, mean ± s.d. (n = 3). e, ZmDi19 promoted the transcriptional activity of proZmPR10. Error bars, mean ± s.d. (n = 6, 4). fh, Overexpression of ZmPR10 resulted in enhanced maize resistance to GLS (f; n = 248), NLB (g; n = 120) and SLB (h; n = 115). Scale bar = 15 cm. Statistical significance in c, e and f, as indicated by P value, was determined using a two-tailed Student’s t test. In d and fh, statistical significance indicated by different lowercase letters was determined by Duncan’s multiple-range test. In the box and whisker plot in c and f, the error bars represent the minimum and maximum values. Centerline, median; box limits, 25th and 75th percentiles. Whiskers mark the range of the data, excluding outliers. The violin plots in f and g show the phenotypic data distribution. The bars within violin plots represent the 95% confidence interval. The bold black line indicates the interquartile range, and the white dots show the medians. An asterisk in a violin plot denotes the DSI value of each transgenic event. Source data
Fig. 5
Fig. 5. Dynamic gene expression profiles of ZmCPK39, ZmDi19 and ZmPR10 upon challenged with C. zeina, E.turcicum and C. heterostrophus.
a–c, Gene expression profiles of ZmCPK39, ZmDi19 and ZmPR10 induced by the GLS causal pathogen C. zeina (a; n = 3, 4, 3, 2; n = 3, 3, 3, 2; n = 2, 2, 2, 2; n = 2, 2, 2, 2; n = 2, 2, 2, 2; n = 2, 2, 2, 2), the NLB causal pathogen E. turcicum (b; n = 3, 3, 3, 3; n = 3, 3, 3, 3; n = 3, 3, 3, 3) and the SLB causal pathogen C. heterostrophus (c; n = 3, 3, 3, 3; n = 3, 3, 3, 3; n = 3, 3, 3, 3). Two, three or four samples were taken as biological replicates (n). Each dot indicates the expression level of a single biological replicate. Gene expression levels of inoculated NILs are presented relative to those in noninoculated NILs. Error bars, mean ± s.d. Lowercase letters indicate significant differences as determined by Duncan’s multiple-range test. The experiments were repeated independently two times. Source data
Fig. 6
Fig. 6. Genetic effect of ZmCPK39 on agronomic traits and GLS resistance of F1 hybrids under normal field and disease nursery.
a, Plant height of hybrids under noninfected conditions in 2020 (n = 158) and 2021 (n = 139). b, GLS resistance of hybrids in 2020 (n = 243) and 2021 (n = 139). Left, the symptoms of two sets of F1 hybrids. Right, knockout of ZmCPK39 significantly enhanced GLS resistance in F1 hybrids. Scale bar = 20 cm. In the box and whisker plots, the error bars represent the minimum and maximum values. Centerline, median; box limits, 25th and 75th percentiles. Whiskers mark the range of the data, excluding outliers. ci, Ear photograph (c), ear length (d), ear width (e), kernel row number (f), kernel number per row (g), 100-kernel weight (h) and grain weight per ear (i) of hybrids under normal field and disease nursery conditions in 2 years. Scale bar in c = 4 cm. Yield-related ear traits were evaluated under noninfected and infected conditions with at least two replicates in 2020 (n = 220) and 2021 (n = 144). Statistical significance in a, b, and di, as indicated by P value, was determined using a two-tailed Student’s t test. Error bars, mean ± s.d. Source data
Fig. 7
Fig. 7. A working model of ZmCPK39-mediated maize resistance to GLS, NLB and SLB.
Maize line with the resistance allele, like Y32, exhibited a relatively lower expression level of ZmCPK39 following pathogen infection, thereby alleviating ZmDi19 degradation. Accumulation of ZmDi19 in turn induces upregulation of the downstream gene ZmPR10 by binding to its promoter, resulting in enrichment of ZmPR10 and enhanced maize resistance to GLS, NLB and SLB. Conversely, maize line with the susceptible allele, such as Q11, ZmCPK39 is highly induced after pathogen infection, thereby accelerating ZmDi19 degradation. Reduced ZmDi19 levels result in the downregulation of ZmPR10 and susceptibility to GLS, NLB and SLB. Scale bar = 10 cm.
Extended Data Fig. 1
Extended Data Fig. 1. Sequential fine mapping and the genetic effect of qRgls2.
a,b, Two rounds of sequential fine mapping in 2015 (a) and 2016 (b) restricted qRgls2 to the ~78-kb interval. The green dotted lines indicate the left and right boundaries of the mapped qRgls2 region. S, deduced susceptibility; R, deduced resistance. DSI values are given as mean ± standard error. A significant difference (P < 0.05) in DSI between homozygous and heterozygous offspring indicates the presence of the resistance allele at qRgls2 in the heterozygous region of the parental recombinant. If no significant difference is observed (P > 0.05), it suggests the absence of qRgls2. ‘Total number of plants’ indicates the sample sizes of recombinant-derived progeny with the same recombinant type. c, The genetic effect of qRgls2 on GLS was evaluated in BC5F8 (n = 888) and BC7F8 (n = 1244) populations. Statistical significance indicated by p-value was determined by a paired t test. In each box and whisker plot, the error bars represent minimum and maximum values. Centerline, median; box limits, twenty-fifth and seventy-fifth percentiles. Whiskers mark the range of the data, excluding outliers. Source data
Extended Data Fig. 2
Extended Data Fig. 2. Sequence alignment and expression analysis of annotated genes in the qRgls2 region.
a,b, Sequence alignment of the ZmUF1 (a) and ZmUF2 (b) genes between Q11 and Y32. Black lines mark the positions of the introns in both genes. The red font highlights the base difference in ZmUF2 between Q11 and Y32. c, Alignment of the deduced amino acid sequences of ZmCPK39 between Y32 and B73/Q11. Red and green lines indicate the kinase domain and four Ca2+-binding EF-hand (EFh) motifs, respectively. Blue font represents the difference between the long and short transcripts, and the red font indicates an amino acid divergence between Y32 and Q11/B73. The myristoylation modification site at the second reside (G2) of ZmCPK39 is indicated by a blue arrow. d, Detection of gene expression of three annotated genes using RT-PCR. gDNA, genomic DNA. ddH2O is used as negative control. M, DL2000 marker. The expression assay was conducted independently at least twice. Source data
Extended Data Fig. 3
Extended Data Fig. 3. Overexpression of ZmCPK39 enhanced maize susceptibility to GLS.
a,b, Resistance performance of homozygous ZmCPK39Y32-OE lines. The long (a; n = 73) and short (b; n = 81) transcripts of the resistant ZmCPK39Y32 allele were overexpressed in the B73 background. c,d, Resistance performance of ZmCPK39Y32-OE in the segregation populations. The overexpressed transgenic plants with long (c) and short (d) transcripts of the resistant ZmCPK39Y32 allele were crossed and backcrossed to Q11, generating T1BC1F1 (c; n = 156) and T1BC3F1 (d; n = 390) backcross populations, respectively. e, Resistance performance of ZmCPK39Q11-OE in the segregation populations (n = 462). The overexpressed transgenic plants with the long transcript of the susceptible ZmCPK39 Q11 allele were crossed and backcrossed to Q11 to generate T1BC1F1, T1BC2F1 and T1BC3F1 backcross populations. The relative expression of ZmCPK39 was determined by RT-qPCR. More than three samples were taken as biological replicates (n = 3). Each dot indicates the expression level of a single biological replicate. In each box and whisker plot, the error bars represent the minimum and maximum values. Centerline, median; box limits, twenty-fifth and seventy-fifth percentiles. Whiskers mark the range of the data, excluding outliers. The bars within violin plots represent the 95% confidence interval. The bold black line indicates the interquartile range, and the white dots show the medians. An asterisk in a violin plot denotes the DSI value of each transgenic event. Statistical significance, as indicated by p-value, was determined using a two-tailed Student’s t test. Source data
Extended Data Fig. 4
Extended Data Fig. 4. Assessment of transgenic plants in their resistance to NLB and SLB in growth chamber.
a,b, Overexpression (proUbi:YT01) and knockout (ZmCPK39-KO) of ZmCPK39 significantly reduced and increased maize resistance to NLB (a) and SLB (b), respectively. c,d, Overexpression (ZmDi19-OE) and knockout (ZmDi19-KO) of ZmDi19 significantly increased and decreased maize resistance to NLB (c) and SLB (d), respectively. e,f, Overexpression of ZmPR10 (ZmPR10-OE) significantly reduced maize resistance to NLB (e) and SLB (f). The accumulations of fungal pathogens E. turcicum (NLB) and C. heterostrophus (SLB) were represented as relative fungal biomass, calculated by gene expression levels of pathogen actin relative to maize ZmGAPDH based on RT-qPCR. Three samples were taken as biological replicates (n = 3). Error bars, mean ± SD (n = 3). Scale bar, 1 cm. Statistical significance, as indicated by p-value, was determined using a two-tailed Student’s t-test. Source data
Extended Data Fig. 5
Extended Data Fig. 5. Molecular characterization of ZmCPK39.
a, Haplotype analysis of the ZmCPK39 gene from 106 accessions. The GLS scale of each haplotype was represented as the mean value. b, Phylogenetic analysis of haplotypes. The seven haplotypes were classified into A and B groups. c, The distribution of GLS scales in the two groups. Box and whisker plots with individual data points represent GLS scales of accessions. d, Gene expressions of ZmCPK39 in two NILs at the maturity stage under both infected and non-infected conditions. Error bars, mean ± SD (n = 4, 4; 3, 3). e, Onion epidermal cells were bombarded with the empty vector 35S:EGFP or the 35S:ZmCPK39–EGFP construct, and the latter was further subjected to plasmolysis. Scale bars, 50 μm. f, Maize protoplasts were transformed with the empty vector 35S:EGFP (left) or 35S:ZmCPK39–EGFP construct (middle) or 35S:ZmCPK39G2A–EGFP construct (right). Scale bars, 10 μm. The subcellular localization experiment was repeated twice with the same results. g, The kinase activities of ZmCPK39Q11 and ZmCPK39Y32 at increasing Ca2+ concentrations using syntide-2 as substrate. The residual ATP was detected using the Kinase-Lumi kit, and the relative light unit (RLU) was used to indicate ZmCPK39 kinase activity under different Ca2+ concentrations. Error bars, mean ± SD (n = 5). Statistical significance, as indicated by p-value, was determined using a two-tailed Student’s t-test (c,d), or the Pearson method (g). In each box and whisker plot, the error bars represent the minimum and maximum values. Centerline, median; box limits, twenty-fifth and seventy-fifth percentiles. Whiskers mark the range of the data, excluding outliers. Source data
Extended Data Fig. 6
Extended Data Fig. 6. GLS resistance performance of four ZmCPK39-interacting proteins using CRISPR–Cas9.
a, Yeast two-hybrid (Y2H) screening identified four proteins interacting with ZmCPK39. DDO, double dropout medium; QDO, quadruple dropout medium. b, Knockout of ZmDi19 decreased GLS resistance (n = 206). ce, Knockout of ZmKnox2 (c; n = 157), ZmPUF49 (d; n = 166) and ZmDUF1639 (e; n = 194) had no influence on GLS resistance. be, Left: sequence alterations of the target genes in knockout lines based on PCR sequencing. Right: the violin plots show the distribution of GLS scales for each knockout event in the field. The bars within the violin plots represent the 95% confidence interval. The bold black line indicates the interquartile range. The white dots show the medians. Asterisks in the violin plots represent DSI values in each group. Lowercase letters indicate significant differences determined by Duncan’s multiple-range test. Source data
Extended Data Fig. 7
Extended Data Fig. 7. Subcellular localization of ZmDi19 and screening of its targeted candidate genes.
a, Maize protoplasts transfected with the empty vector (left) and the ZmDi19–GFP construct (right). Scale bars, 10 μm. b, N. benthamiana leaves transformed with the control vector (left) and the ZmDi19–GFP construct (right). Scale bars, 50 μm. c, Differentially expressed genes (DEGs) in ZmDi19-OE plants compared to B73. The blue and red dots indicate the downregulated and upregulated genes, respectively. d, Venn diagrams show overlapping DEGs and DAPs in ZmDi19-OE plants. Of 17 overlapping genes, 8 harbor the TACA(A/G)T motif in their promoters and 9 do not. e, Identification of candidate genes regulated by ZmDi19. The heatmap shows fold changes at the RNA and protein levels of 8 candidate genes in ZmDi19-OE plants compared to B73. Yeast one-hybrid (Y1H) assay was used to detect the binding of ZmDi19 to the promoters of 8 candidate genes.
Extended Data Fig. 8
Extended Data Fig. 8. Effect of ZmPR10 on the growth of E. turcicum and C. heterostrophus.
a,b, ZmPR10 significantly inhibits the growth of E. turcicum, both on leaves (a) and in culture medium (b). Error bars, mean ± SD (n = 8). c,d, ZmPR10 restricts the growth of C. heterostrophus on leaves (c) and in culture medium (d). Error bars, mean ± SD (n = 6). (1) indicates purified ZmPR10 protein. (2) indicates boiled ZmPR10 protein as the control. Scale bar, 1 cm. Statistical significance, as indicated by p-value, was determined using a two-tailed Student’s t-test. Source data
Extended Data Fig. 9
Extended Data Fig. 9. Plant heights of transgenic plants involved in ZmCPK39, ZmDi19 and ZmPR10.
a, ZmCPK39-KO mutant showed a severe reduction in plant height. Left: the plant architecture of wild-type B73 and its three ZmCPK39-KO mutants. Scale bar, 19 cm. Right: the plant height of the three ZmCPK39-KO mutants was significantly reduced compared to the recipient line B73 (n = 179). b, Comparison of plant heights of ZmDi19-KO and ZmDi19-OE lines with their recipient line B73 (n = 212). c, Comparison of plant heights of ZmPR10-OE lines with their recipient line B73 (n = 165). Lowercase letters in ac indicate significant differences determined by Duncan’s multiple-range test. Source data
Extended Data Fig. 10
Extended Data Fig. 10. Phylogenetic analysis of annotated CPK proteins and the divergence between ZmCPK39 and ZmCPK38 in their interaction with ZmDi19.
a, The annotated 41 CPK proteins in maize, two IV subfamily CPKs in rice and 34 CPK proteins in Arabidopsis were used for phylogenetic analysis. b, Interaction between ZmCPK38 and ZmDi19 in yeast two-hybrid assay. The Y2H assay indicated that ZmCPK38 does not interact with ZmDi19. DDO, double dropouts, medium lacking Leu and Trp; QDO, quadruple dropouts, medium lacking Ade, His, Leu and Trp.

References

    1. Crous, P. W. et al. Species of Cercospora associated with grey leaf spot of maize. Stud. Mycol.55, 189–197 (2006). - PMC - PubMed
    1. Chang, H. S. & Fan, K. C. Comparative studies on some biology and pathology of corn and broom corn isolates of Exserohilum turcicum (Pass) Leonard & Suggs. Bot. Bull. Acad. Sin.27, 209–218 (1986).
    1. Balint-Kurti, P. et al. Precise mapping of quantitative trait loci for resistance to southern leaf blight, caused by Cochliobolus heterostrophus race O, and flowering time using advanced intercross maize lines. Genetics176, 645–657 (2007). - PMC - PubMed
    1. Ward, J. M. J., Laing, M. D. & Nowell, D. C. Chemical control of maize grey leaf spot. Crop Prot.16, 265–271 (1997).
    1. Juliatti, F. C., Pedrosa, M. G., Silva, H. D. & da Silva, J. V. C. Genetic mapping for resistance to gray leaf spot in maize. Euphytica169, 227–238 (2009).

MeSH terms

LinkOut - more resources