. 2024 Nov 4;7(1):1433.
doi: 10.1038/s42003-024-07148-8.

Complexity and weak integration promote the diversity of reef fish oral jaws

Affiliations

Complexity and weak integration promote the diversity of reef fish oral jaws

M D Burns et al. Commun Biol. .

Abstract

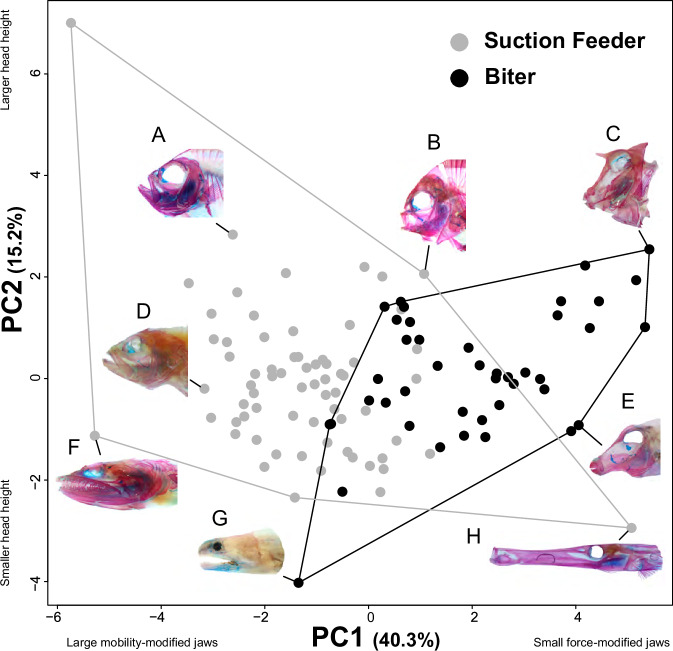
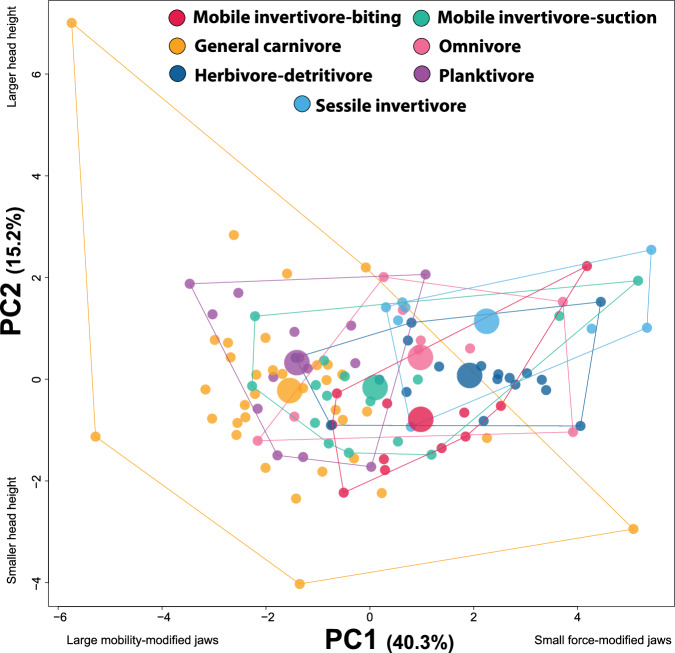
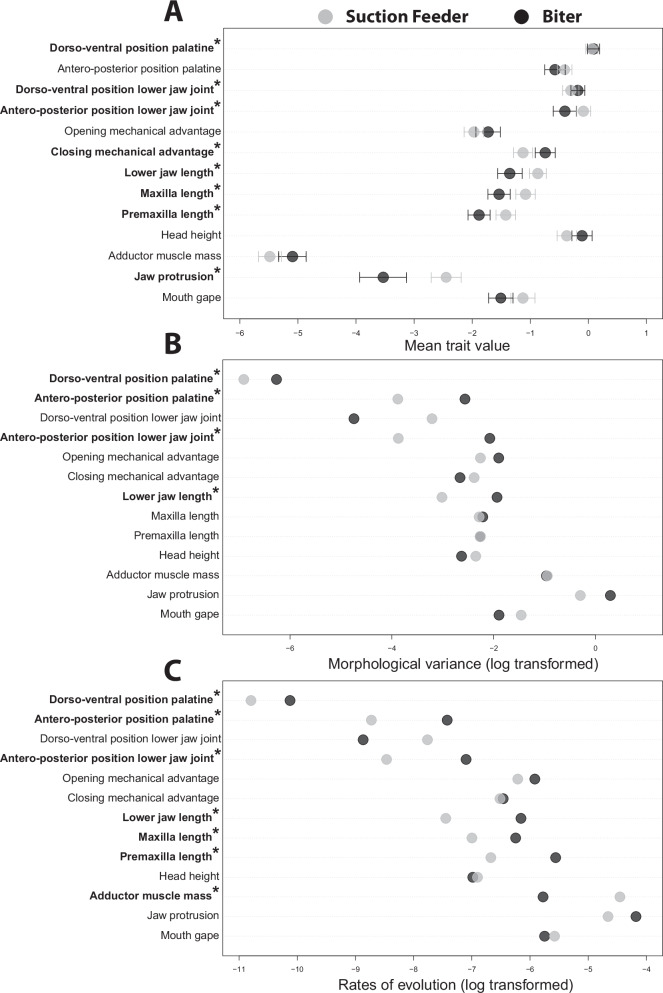
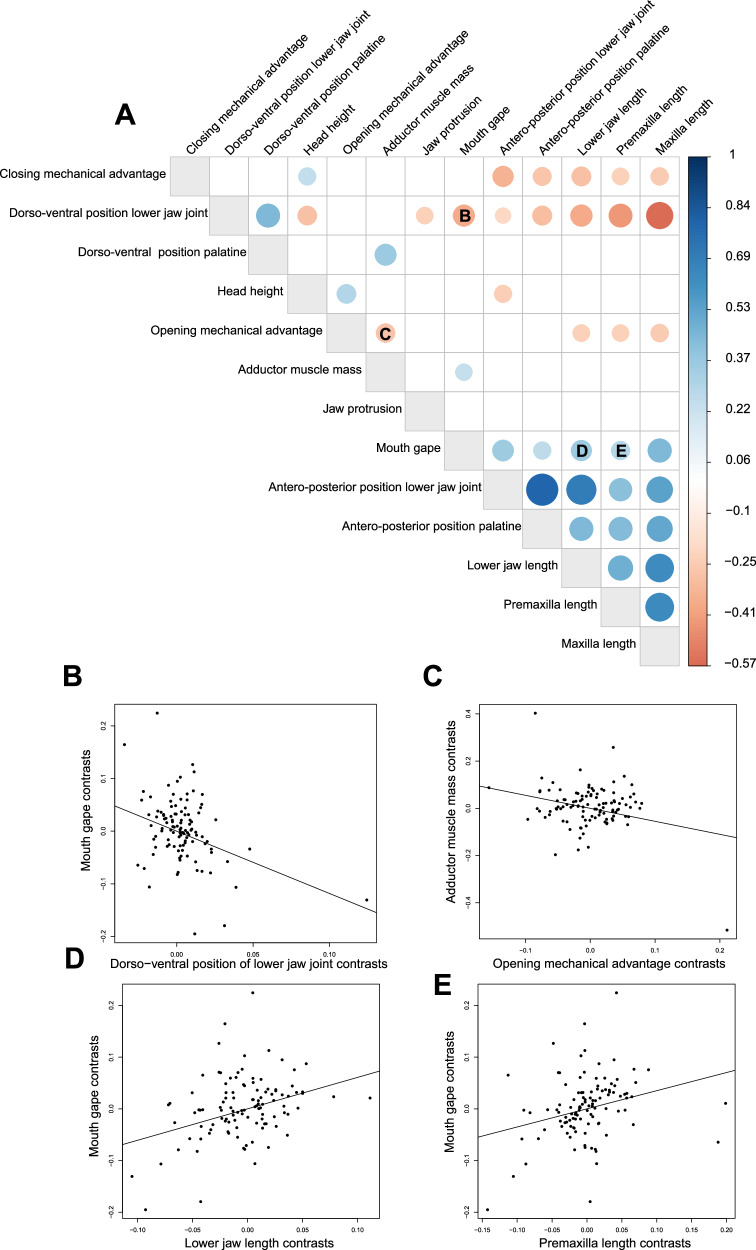
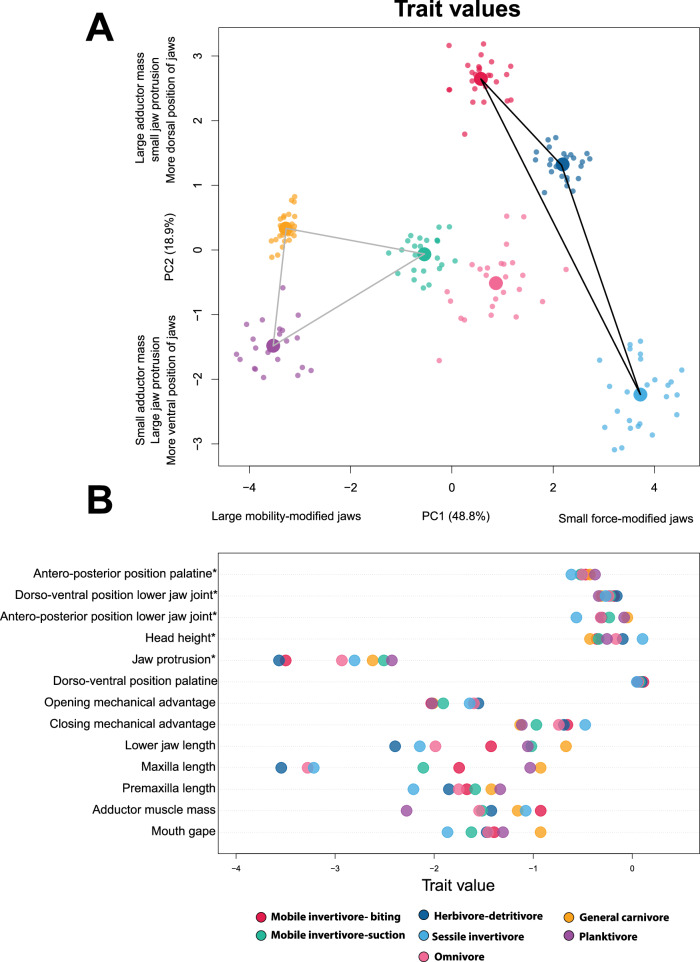
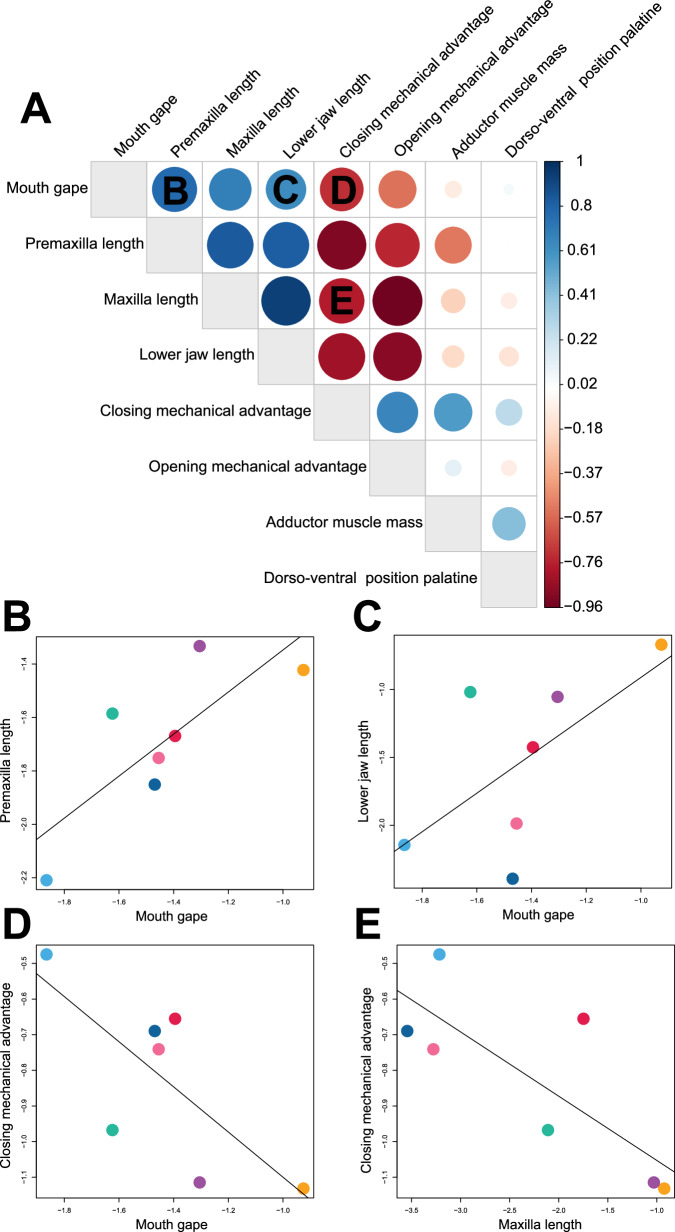
Major trade-offs often manifest as axes of diversity in organismal functional systems. Overarching trade-offs may result in high trait integration and restrict the trajectory of diversification to be along a single axis. Here, we explore the diversification of the feeding mechanism in coral reef fishes to establish the role of trade-offs and complexity in a spectacular ecological radiation. We show that the primary axis of variation in the measured musculo-skeletal traits is aligned with a trade-off between mobility and force transmission, spanning species that capture prey with suction and those that bite attached prey. We found weak or no covariation between about half the traits, reflecting deviations from the trade-off axis. The dramatic trophic range found among reef fishes occurs along the primary trade-off axis, with numerous departures that use a mosaic of trait combinations to adapt the feeding mechanism to diverse challenges. We suggest that morphological evolution both along and independent of a major axis of variation is a widespread mechanism of diversification in complex systems where a global trade-off shapes major patterns of diversity. Significant additional diversity emerges as systems use weak integration and complexity to assemble functional units with many trait combinations that meet varying ecological demands.


Conflict of interest statement

The authors declare no competing interests.

Figures

Fig. 1
Fig. 1. The 13 craniofacial traits measured for each species.
A A lateral view of the head of a cleared and stained coral reef fish (Lutjanus kasmira) illustrating 9 of the 13 traits measured and the location of the horizontal and vertical body axis used for position measurements. (1) length of the dentigerous arm of the premaxilla, (2) length of the maxilla, (3) lower jaw length, (4) jaw closing in-lever length (used to calculate mechanical advantage) (5) jaw opening in-lever length (used to calculate mechanical advantage), (6) head length, (7) antero-posterior and dorso-ventral position of the lower jaw joint, (8) antero-posterior and dorso-ventral position of the anteriormost portion of the palatine, (9) location of the intersection of a horizontal body axis that passed through the tip of the first tooth in the premaxilla and the last vertebrate centra and a vertical axis, orthogonal to the first axis that passed through the center of the orbit of the eye. B Illustration of the head region showing (10) head height, (11) jaw protrusion, and (12) the adductor mandibulae. C Illustration of the jaws showing the (13) mouth gape measurement.
Fig. 2
Fig. 2. Principal component analysis showing major axes of craniofacial variation in 110 species of coral reef fishes for each functional feeding mode.
Each point corresponds to a species and is colored by feeding mode. Photos show representative species illustrating morphological variation across the plot including (A) Pristigenys serrula, (B) Dascyllus trimaculatus, (C) Acanthostracion quadricornis, (D) Cephalopholis baenck, (E) Canthigaster solandri, (F) Synodus saurus, (G) Echidna nebulosa, and (H) Aulostomus maculatus.
Fig. 3
Fig. 3. Principal component analysis showing major axes of craniofacial variation in 110 species of coral reef fishes for each diet.
Each point is the average shape of a species, colored by diet. Large circles denote the location of the centroid for each diet.
Fig. 4
Fig. 4. Dot plots showing differences between biters and suction feeders for all 13 oral jaw and craniofacial traits.
Dot plots of (A) the mean trait value for each trait with confidence intervals around the mean, (B) log transformed morphological variance, and (C) log transformed rates of evolution. Traits that differed significantly between the functional feeding groups (p < 0.05) are bolded and have an asterisk.
Fig. 5
Fig. 5. Heatmap of trait correlations and bivariate plots showing weak correlations between most traits.
A Heatmap of trait correlations. Blank boxes are trait correlation values that were not larger than the correlations from the Brownian motion simulation. Darker blue colors indicate a stronger positive correlation, while darker red colors indicate a stronger negative correlation. The size of the circle indicates the strength of the correlation. Letters BE correspond to the bivariate plots. BE Evolutionary correlations of the independent contrasts for a sampling of oral jaw traits that show weak, but significant, correlations.
Fig. 6
Fig. 6. Principal components analysis and dot plots showing differences in the optimal or mean trait values for each diet.
A Principal component analysis of optimal or mean trait values for all 13 oral jaw traits showing that, while trait combinations associated with diet are largely aligned with an overarching trade-off between jaw strength and mobility, there is variation in trait combinations beyond this trend. The black polygon represents diets that feed primarily through biting. The gray polygon represents diets that feed primarily through suction. Omnivores (pink circle) are represented by an almost equal split of biters and suction feeders. B Dotplot showing the variation in trait values between the diet groups for each trait. Asterisks denote traits in which the mean trait value was used instead of the optimal trait value as the multi-peak OU models could not converge.
Fig. 7
Fig. 7. Heatmap of correlation coefficients and bivariate plots showing the relationships between optimal trait values for the different diets.
A Heatmap of correlation coefficients from the regression analysis of diets between the optimal trait values. Darker blue colors indicate a stronger positive correlation, while darker red colors indicate a stronger negative correlation. The size of the circle indicates the strength of the correlation. Letters BE correspond to the bivariate plots. BE Bivariate plots of the diets for a sampling of oral jaw trait optima that exhibit deviations from the overall relationship trend despite a significant correlation.

Similar articles

Cited by

References

    1. Wilson, D. S. & Yoshimura, J. On the Coexistence of Specialists and Generalists. Am. Nat.144, 692–707 (1994).
    1. Koehl, M. A. R. When does morphology matter? Annu. Rev. Ecol. Syst.27, 501–542 (1996).
    1. Wainwright, P. C. Functional versus morphological diversity in macroevolution. Annu. Rev. Ecol. Evol. Syst.38, 381–401 (2007).
    1. Garland, T., Downs, C. J. & Ives, A. R. Trade-offs (and constraints) in organismal biology. Physiol. Biochem. Zool.95, 82–112 (2022). - PubMed
    1. Wang, X. & Clarke, J. A. The evolution of avian wing shape and previously unrecognized trends in covert feathering. Proc. R. Soc. B Biol. Sci.282, 20151935 (2015). - PMC - PubMed