. 2024 Nov;6(11):2082-2099.
doi: 10.1038/s42255-024-01159-9. Epub 2024 Nov 4.

A pathogenic role for IL-10 signalling in capillary stalling and cognitive impairment in type 1 diabetes

Affiliations

A pathogenic role for IL-10 signalling in capillary stalling and cognitive impairment in type 1 diabetes

Sorabh Sharma et al. Nat Metab. 2024 Nov.

Abstract

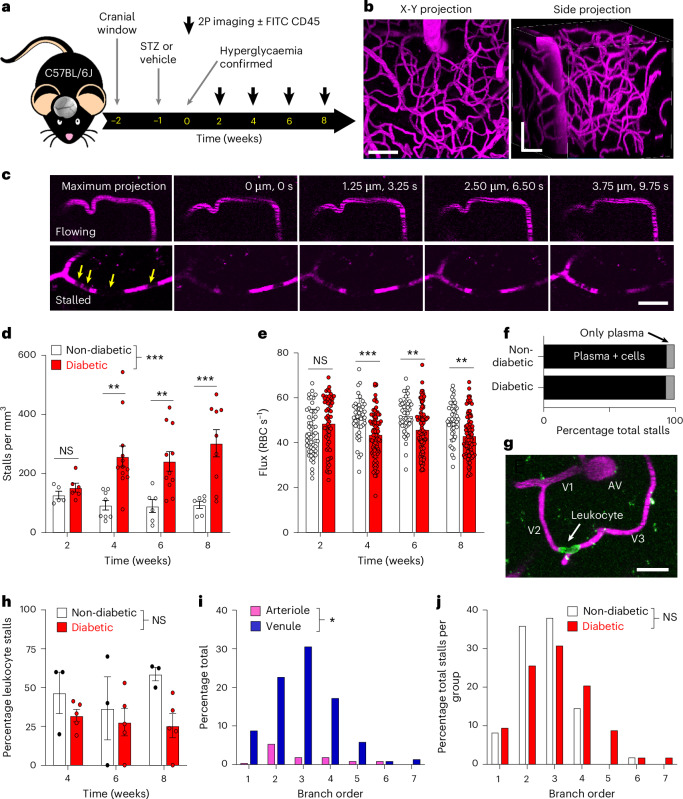
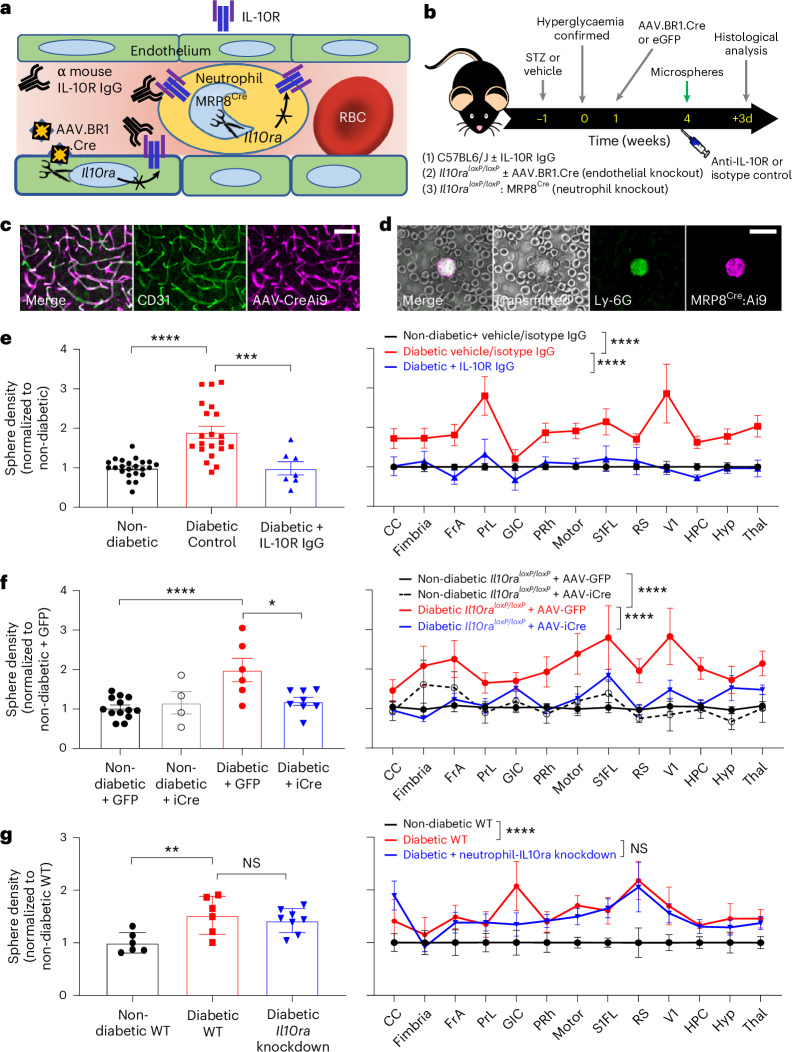
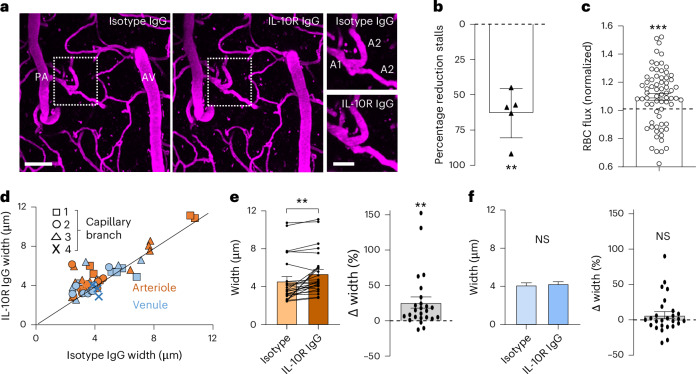
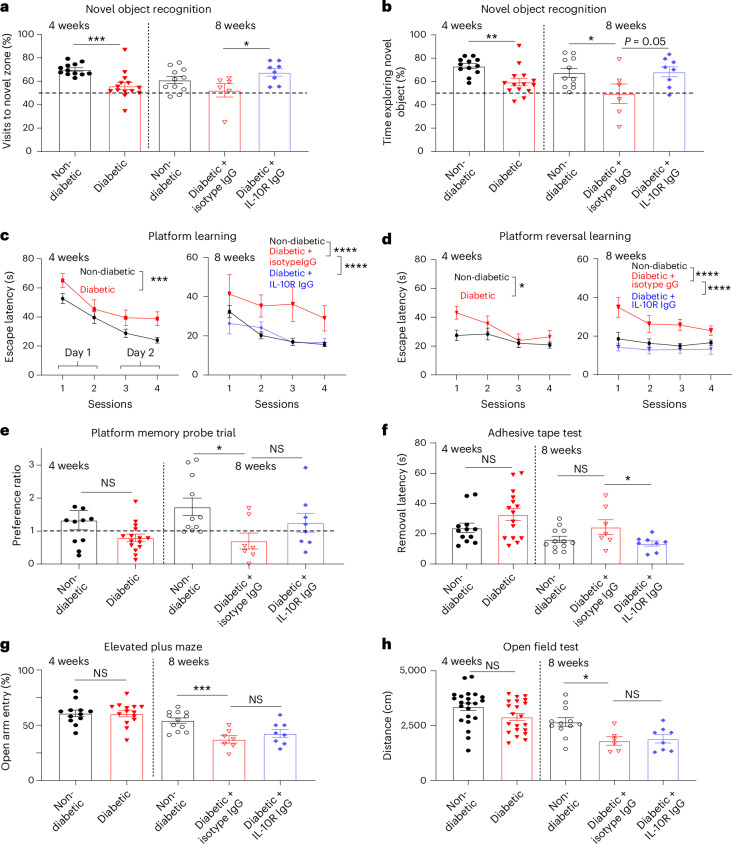
Vascular pathology is associated with cognitive impairment in diseases such as type 1 diabetes; however, how capillary flow is affected and the underlying mechanisms remain elusive. Here we show that capillaries in the diabetic mouse brain in both sexes are prone to stalling, with blocks consisting primarily of erythrocytes in branches off ascending venules. Screening for circulating inflammatory cytokines revealed persistently high levels of interleukin-10 (IL-10) in diabetic mice. Contrary to expectation, stimulating IL-10 signalling increased capillary obstruction, whereas inhibiting IL-10 receptors with neutralizing antibodies or endothelial specific knockdown in diabetic mice reversed these impairments. Chronic treatment of diabetic mice with IL-10 receptor neutralizing antibodies improved cerebral blood flow, increased capillary flux and diameter, downregulated haemostasis and cell adhesion-related gene expression, and reversed cognitive deficits. These data suggest that IL-10 signalling has an unexpected pathogenic role in cerebral microcirculatory defects and cognitive impairment associated with type 1 diabetes.


Conflict of interest statement

Competing interests: The authors declare no competing interests.

Figures

Fig. 1
Fig. 1. In vivo imaging shows abnormally high levels of stalled capillaries and lower RBC flux in the diabetic mouse cortex.
a, Experimental timeline of diabetes induction and two-photon imaging. b, Maximal intensity two-photon X-Y and side (X-Z) projections showing the cerebral vasculature (shown in magenta). c, Successive images through a Z-stack show flowing or stalled capillaries. Note the streaking pattern caused by RBC movement in flowing capillaries or absence of streaking in those that are stalled. The yellow arrows indicate unlabelled cells stalled in the capillary. d, Estimated stalls per mm3 in non-diabetic (n = 5, 8, 6 and 6 mice for weeks 2, 4, 6 and 8, respectively) and diabetic mice (n = 6, 12, 11 and 10 mice for weeks 2, 4, 6 and 8, respectively) in the weeks after hyperglycaemia was confirmed. P values for 2, 4, 6 and 8 weeks: 0.9865, 0.0012, 0.0096 and 0.0004, respectively. e, RBC flux (RBC s−1) in non-diabetic (n = 53, 45, 45 and 45 capillaries for weeks 2, 4, 6 and 8, respectively) and diabetic capillaries (n = 57, 90, 90 and 90 capillaries for weeks 2, 4, 6 and 8, respectively) over time. P values for 2, 4, 6 and 8 weeks: 0.1278, 0.0002, 0.0031 and 0.0012, respectively. f, Percentage of stalls with blood cells plugging the capillary or without (plasma + cells or just plasma). g, Representative image showing a CD45.2-labelled leucocyte plugging a second-order branch (V2) from an AV. h, Graph showing the percentage of leucocyte-stalled capillaries in non-diabetic and diabetic groups (n = 3 and 5 mice, respectively) at different time points. Note that leucocytes were not imaged at the 2-week time point. i, Percentage of stalled capillaries as related to the branch order of the PA or AV. j, Percentage of stalled capillaries as a function of branch order in each experimental group. Data in d,e,h were analysed with a two-way ANOVA and Šidák’s multiple-comparisons test. Data in I,j were analysed with a two-sided Mann–Whitney U-test. NS, not significant, *P < 0.05, **P < 0.01, ***P < 0.001. b, Scale bar, 50 µm. c,g, Scale bar, 20 µm. Data are expressed as the mean ± s.e.m. Source data
Fig. 2
Fig. 2. Effect of insulin treatment and sex on capillary obstruction.
a, Top, Timeline of diabetes induction and microsphere injection. Bottom, Representative widefield images showing fluorescent microspheres (green) plugging the lumen of capillaries filled with fluorescent dextran (magenta) in the somatosensory cortex. b, Weekly blood glucose levels in the experimental groups (non-diabetic, n = 7; diabetic, n = 14; diabetic + insulin, n = 6 mice). ***P < 0.001, ****P < 0.0001. c, Weekly body weight measurements in the experimental groups (non-diabetic, n = 7; diabetic, n = 14; diabetic + insulin, n = 6 mice). d, Quantification of microsphere-plugged capillaries across the forebrain in non-diabetic, uncontrolled diabetic and insulin-treated mice (n = 16, 15 and 6 mice, respectively; **P = 0.0013, NS P = 0.55). e, Regression analysis showing a significant relationship between blood glucose levels and density of microsphere-plugged capillaries in the mouse forebrain (n = 37 mice). f, Density of microsphere-plugged capillaries across different brain regions in each experimental group (*P = 0.037, ****P < 0.0001). g, Regional density of microsphere-plugged capillaries as a function of sex (non-diabetic, n = 8 male and 8 female mice; diabetic, n = 7 male and 8 female mice). CC, corpus callosum; FrA, frontal association cortex; GIC, granular or dysgranular insular cortex; HPC, hippocampus; Hyp, hypothalamus; motor, primary or secondary motor cortex; PRh, peri-rhinal cortex; PrL, prelimbic cortex; RS, retrosplenial cortex; S1FL, primary forelimb somatosensory cortex; Thal, thalamus; V1, primary visual cortex. Data in b,c,f,g were analysed using a two-way ANOVA followed by Tukey’s multiple-comparisons test when appropriate. Data in d were analysed using a two-tailed unpaired t-test. Data in e were analysed with a two-sided linear regression. a, Scale bars from left to right: 1 mm, 50 µm and 20 µm. Data are expressed as the mean ± s.e.m. Source data
Fig. 3
Fig. 3. Elevated levels of IL-10 in diabetic blood is associated with capillary plugging.
a, Multiplex immunoassay showing normalized expression of cytokines and chemokines in the blood serum of non-diabetic (n = 12) and diabetic (n = 10 mice) mice collected 8 weeks after confirmation of hyperglycaemia. *P < 0.05, **P < 0.01, ***P < 0.001. b, IL-10 levels were elevated in diabetic blood serum 4 weeks after confirmation of hyperglycaemia (non-diabetic = 12, diabetic = 12 mice; *P = 0.031). c, Experimental timeline to examine the effect of intravenous injection of IL-10 or control albumin protein on capillary plugging. d, Normalized density of microsphere-plugged capillaries in the forebrain of control and IL-10-injected mice (n = 8 and 6 mice, respectively; ***P = 0.0005). Data in a,b,d were analysed using a two-tailed unpaired t-test. Data are expressed as the mean ± s.e.m. Source data
Fig. 4
Fig. 4. IL-10 receptor inhibition with neutralizing antibodies or endothelial cell-specific knockdown alleviates capillary plugging in diabetic mice.
a, Illustration showing how IL-10R signalling could impact capillary obstructions through vascular endothelial cells or neutrophils and the therapeutic approaches tested. b, Experimental timeline and three treatment groups to inhibit IL-10R signalling: (1) injection of IL-10R neutralizing antibodies in C57BL/6J wild-type (WT) mice; (2) injection of AAV.BR1.iCre or control virus (AAV.BR1.eGFP) in Il10raloxP/loxP mice for endothelial cell-specific knockdown of Il10ra receptors; (3) neutrophil-specific knockdown using Il10raloxP/loxP mice crossed with MRP8Cre mice. c,d, Representative images showing validation of Cre recombinase activity in either brain endothelial cells using CD31 immunolabelling (c) or neutrophils using Ly-6G antibody (d) with Cre-dependent tdTomato reporter mouse (Ai9). e, Effect of IL-10R neutralizing antibody treatment on the density of microsphere-plugged capillaries in non-diabetic controls, diabetic controls or diabetic + IL-10R IgG-treated mice (n = 23, 21 and 7 mice, respectively). Microsphere densities are shown collapsed across all forebrain regions (left, ***P = 0.0004, ****P < 0.0001) or in specific brain regions (right, ****P < 0.0001). f, Effect of endothelial cell-specific Il10ra knockdown on density of plugged capillaries across the forebrain (left, *P = 0.011, ****P < 0.0001) or in specific brain regions (right, ****P < 0.0001) in non-diabetic (AAV-GFP: n = 13 mice; AAV-iCre: n = 4 mice) and diabetic mice injected with AAV-GFP (n = 6 mice) or AAV-iCre (n = 8 mice). g, Density of microsphere-plugged capillaries in the forebrain (left, NS P = 0.76, **P = 0.009) or specific brain regions (right, NS P = 0.33, ****P < 0.0001) in non-diabetic WT (n = 6 mice), diabetic WT (n = 6 mice) or diabetic Il10ra knockdown in neutrophils (diabetic IL-10ra knockdown, n = 8 mice). Data in e,f were analysed using a two-tailed unpaired t-test (left) or a two-way ANOVA followed by Šidák’s multiple-comparisons test (right). c,d, Scale bar, 20 µm. Data are expressed as the mean ± s.e.m. Source data
Fig. 5
Fig. 5. Treating diabetic mice with IL-10R neutralizing antibody lowers stalling rates, and increases capillary flux and capillary width.
a, Representative in vivo two-photon Z-projection images showing the fluorescently labelled vasculature (shown in magenta) in the diabetic somatosensory cortex after injection of isotype control antibody and again after treatment with IL-10R neutralizing antibody 1 week later. The insets on the right show lower-order capillary branches off the PA in each treatment condition. b, Percentage reduction in stalling density in diabetic mice treated with IL-10R neutralizing antibody relative to isotype controls (n = 5 mice imaged after both treatments). P = 0.009 c, RBC flux in capillaries from diabetic mice treated with IL-10R neutralizing antibody normalized to the diabetic isotype controls (n = 69 capillaries from five mice). d, Unity plot showing the width of the proximal capillary branches (branches 1–4) off the PA (brown, n = 25 capillaries from four mice) or AV (blue, n = 25 capillaries from four mice) after isotype control or IL-10R neutralizing antibody treatment. e, Absolute or percentage change in width of the capillaries branching off the PA (brown) (n = 25 capillaries from four mice). f, Absolute or percentage change in width of capillaries branching off the AV (n = 27 capillaries from four mice). Data in e,f (left) were analysed with a two-tailed paired t-test. Data b,c,e,f (right) were analysed with a two-sided one-sample t-test. **P value in b: 0.009; P values in e (left) 0.001 and e (right) 0.003; ***P = 0.0002. a, Scale bar, 50 µm (inset, 20 µm). Data are expressed as the mean ± s.e.m. Source data
Fig. 6
Fig. 6. Effect of IL-10R neutralizing antibody on CBF in diabetic mice.
a, Schematic showing the timeline of the experimental procedures and the CBF measurements using laser Doppler flowmetry. CBF measurements included peak amplitude, time to peak and area under the curve (a.u.c.). b, Normalized blood flow changes in response to inhalation of 5% CO2. ce, Peak amplitude (c), time to peak (d) and a.u.c. (e) in non-diabetic or diabetic mice treated with isotype control or IL-10R neutralizing antibody (n = 12, 11 and 16 mice, respectively). Significance in c: **P = 0.005 and 0.0002; significance in e: **P = 0.005 and 0.006. f, Normalized blood flow changes in response to 100-Hz vibrotactile stimulation of the limb. gi, Peak amplitude (g), time to peak (h) and a.u.c. (i) in the three groups (non-diabetic, n = 11; diabetic + isotype, n = 11; diabetic + IL-10R IgG, n = 16 mice). Significance in g: *P = 0.030 and 0.024; significance in h: *P = 0.031 and 0.013; significance in i: *P = 0.011, **P = 0.006. j, Normalized blood flow changes in response to 1% isoflurane mixed in air. km, Peak amplitude (k), time to peak (l) and a.u.c. (m) of blood flow changes in the three groups (non-diabetic, n = 12; diabetic + isotype, n = 10; diabetic + IL-10R IgG, n = 16 mice). The grey areas in b,f,j indicate the duration of the stimuli used to evoke changes in blood flow (60, 10 and 30 s, respectively). Data in ce,gi,km were analysed using a two-tailed unpaired t-test. Data are expressed as the mean ± s.e.m. Source data
Fig. 7
Fig. 7. Long-term IL-10 receptor inhibition improves cognitive function in diabetic mice.
a,b, Graphs showing the frequency of visits to the novel object zone (a, *P = 0.027, ***P = 0.0008) or percentage time spent exploring a novel object (b, *P = 0.040, **P = 0.002) at 4 weeks in non-diabetic or diabetic mice (n = 12 and 14 mice, respectively), or at 8 weeks in non-diabetic or diabetic mice treated with isotype control or IL-10R neutralizing antibody (n = 11, 6 and 8 mice, respectively). c, Escape latency for learning the hidden platform location in the Morris water maze at 4 weeks in non-diabetic and diabetic mice (***P = 0.0004; n = 26 and 23 mice, respectively) or at 8 weeks (****P < 0.0001; n = 12, 7 and 8 mice for non-diabetic, diabetic + isotype and diabetic + IL-10R neutralizing antibody, respectively). d, Escape latency for learning the new platform location in the water maze (‘platform reversal learning’) in non-diabetic and diabetic mice at 4 (*P = 0.01; n = 12 and 15 mice, respectively) and 8 (****P < 0.0001; n = 12, 7 and 8 mice for non-diabetic, diabetic + isotype and diabetic + IL-10R neutralizing antibody, respectively) weeks. e, Preference for quadrant with hidden platform (‘platform memory probe trial’) in non-diabetic and diabetic mice at 4 (NS P = 0.07; n = 11 and 15 mice, respectively) and 8 (NS P = 0.171, *P = 0.015; n = 11, 7 and 8 mice for non-diabetic, diabetic + isotype and diabetic + IL-10R neutralizing antibody, respectively) weeks. f, Graph showing latency of tape removal (s) in different experimental groups at 4 (NS P = 0.115; n = 12 and 15 mice) and 8 (NS P = 0.093, *P = 0.047; n = 12, 7 and 8 mice) weeks. g, Percentage of time spent in the open arms of the elevated plus maze at 4 (NS P = 0.92; n = 12 and 14 mice) and 8 (NS P = 0.92; ***P = 0.0007; n = 12, 7 and 8 mice) weeks. h, Distance travelled by mice in each experimental group in the open field test at 4 (NS P = 0.057; n = 22 and 21 mice) and 8 (NS P = 0.734, *P = 0.013; n = 12, 6 and 8 mice) weeks. In a,b,eh, a two-tailed unpaired t-test was used to analyse the data at each time point. Data in c,d were analysed using a two-way ANOVA followed by Tukey’s multiple-comparisons test. Data are expressed as the mean ± s.e.m. Source data
Fig. 8
Fig. 8. IL-10R neutralizing antibody treatment downregulates the genes associated with haemostasis and cell adhesion.
a, Volcano plot showing DEGs as a function of log2 fold change and statistical significance (two-sided P value adjusted for multiple comparisons) between diabetic mice treated with IL-10R neutralizing antibody versus isotype control (n = 6 mice per group). The top ten genes most significantly upregulated or downregulated have been labelled. b, Heatmap showing the scaled expression of the top 30 most significantly upregulated or downregulated DEGs in diabetic IL-10R IgG-treated mice relative to isotype controls (bottom, individual mouse IDs 33–44). c, Dot plot showing KEGG enrichment analysis of DEGs (two-sided test) for the top 20 upregulated (left) or downregulated (right) pathways. d, Histograms showing normalized read counts for genes implicated in regulating cell adhesion and platelet activation, which were significantly downregulated with IL-10R antibody treatment (n = 6 mice per group, all Padj < 0.05). Data are expressed as the mean ± s.d. Source data
Extended Data Fig. 1
Extended Data Fig. 1. Blood serum cytokine levels in non-diabetic and diabetic mice.
a, Concentration for each cytokine/chemokine (pg/mL) in blood serum of non-diabetic (black dots) and STZ induced diabetic mice (red dots) at 8 weeks. b-e, Graphs show expression of CCL2/MCP-1 (b), CXCL1/KC (c), IL-17A (d), and CXCL9/MIG (e) in blood serum 4 weeks after confirmation of hyperglycemia (n=8 mice/group). f, Expression of blood serum cytokines in non-obese diabetic (NOD, n=10 mice) mice normalized to non-diabetic controls (NOR, n = 13 mice). Data in b-f analysed by unpaired two-tailed t-tests. Data are expressed as mean ± SEM. *p<0.05. Source data
Extended Data Fig. 2
Extended Data Fig. 2. Validation of IL10ra knockdown in endothelial cells and neutrophils.
a, Isolated endothelial cells (n=2 mice/group) showing enriched expression of genes typically expressed in endothelium (Vegfr2, Tie2, Cd31, Cdh5), with very low levels of gene expression associated with astrocytes (Gfap), neurons (NeuN), leukocytes (Cd45) or microglia (Tmem119). b, Box plot shows median, upper/lower quartile and max/min values from qPCR data showing loss of Exon 3 IL10ra gene expression in endothelial cells isolated from Il10ra floxed mice injected with AAV-BR1-iCRE (n=4 mice), relative to controls (WT: Wild type; Il10ra flox/flox: Il10ra flox/flox mice; WT mice injected with AAV-BR1-iCRE). c, Breeding strategy and representative PCR results (reproduced >5 times) for Mrp8cre:IL10ra floxed mice. Source data
Extended Data Fig. 3
Extended Data Fig. 3. Treating diabetic mice with IL-10 neutralizing antibody reduced the density of microsphere plugged capillaries in the brain.
a, Experimental timeline. b, Density of microsphere plugged capillaries in the forebrain in diabetic mice treated with isotype control antibody or IL-10 neutralizing antibody, normalized to non-diabetic controls (*p=0.015, **p=0.009; n=8, 9 and 8 mice per group). Data in b analysed with two-tailed unpaired t-tests. Data are expressed as mean ± SEM. Source data
Extended Data Fig. 4
Extended Data Fig. 4. Blood glucose levels in diabetic mice at 4 weeks across different treatment groups.
Blood glucose levels in diabetic mice at 4 weeks. One-way ANOVA indicated no significant differences between diabetic groups (F(5,38)=0.53, p=0.75; n=21, 7, 6, 8, 9 and 8 mice, respectively). Data are expressed as mean ± SEM. Source data
Extended Data Fig. 5
Extended Data Fig. 5. Assessment of cardiovascular function during laser Doppler experiments.
There were no significant differences in oxygen saturation (a) or heart rate (b, beats per minute) between non-diabetic and diabetic mice treated with isotype or IL-10R neutralizing antibody (n = 7, 7 and 6 mice per group). Data in a and b were analysed with 1-way ANOVA. Data are expressed as mean ± SEM. Source data
Extended Data Fig. 6
Extended Data Fig. 6. Effect of diabetes on swim speed and visibility of mice.
a, Swim Speed in Morris water maze at 4 and 8 week testing periods (n=11, 15, 12, 7 and 8 mice, respectively). b, Escape latencies in the visible platform test at 8 week testing period (n=11, 7 and 7 mice, respectively). Data analysed with two-way ANOVA (a) and unpaired two-tailed t-tests (b). ns: not significant. Data are expressed as mean ± SEM. Source data
Extended Data Fig. 7
Extended Data Fig. 7. Differentially expressed genes in the brain endothelium of diabetic mice relative to non-diabetic controls.
a, GO analysis shows the 10 most significant (two sided, p-values adjusted for multiple comparisons) downregulated (left) or upregulated (right) genes related to biological processes (BP), cellular component (CC) or molecular function (MF). b, KEGG analysis shows the top 20 down-regulated (left) or up-regulated (right) pathways in diabetic mice relative to non-diabetic controls. c, Volcano plots show gene expression in diabetic isotype treated mice relative to non-diabetic controls (n=6 mice per group), based on log2 fold change and statistical significance (adjusted p value). d, Heat map shows scaled gene expression for top 30 most significantly up or down regulated genes in each mouse. Numbers on bottom represent individual mouse IDs. Source data

References

    1. Attwell, D. & Laughlin, S. B. An energy budget for signaling in the grey matter of the brain. J. Cereb. Blood Flow Metab.21, 1133–1145 (2001). - PubMed
    1. Davis, H. & Attwell, D. A tight squeeze: how do we make sense of small changes in microvascular diameter? J. Physiol.601, 2263–2272 (2023). - PMC - PubMed
    1. Harraz, O. F., Longden, T. A., Dabertrand, F., Hill-Eubanks, D. & Nelson, M. T. Endothelial GqPCR activity controls capillary electrical signaling and brain blood flow through PIP2 depletion. Proc. Natl Acad. Sci. USA115, E3569–E3577 (2018). - PMC - PubMed
    1. Zambach, S. A. et al. Precapillary sphincters and pericytes at first-order capillaries as key regulators for brain capillary perfusion. Proc. Natl Acad. Sci. USA118, e2023749118 (2021). - PMC - PubMed
    1. Schager, B. & Brown, C. E. Susceptibility to capillary plugging can predict brain region specific vessel loss with aging. J. Cereb. Blood Flow Metab.40, 2475–2490 (2020). - PMC - PubMed

LinkOut - more resources