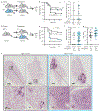
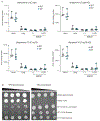
. 2024 Dec;25(12):2247-2258.
doi: 10.1038/s41590-024-01998-4. Epub 2024 Nov 4.

Novel coenzyme Q6 genetic variant increases susceptibility to pneumococcal disease

Affiliations

Novel coenzyme Q6 genetic variant increases susceptibility to pneumococcal disease

Emma C Walker et al. Nat Immunol. 2024 Dec.

Abstract

Acute lower respiratory tract infection (ALRI) remains a major worldwide cause of childhood mortality, compelling innovation in prevention and treatment. Children in Papua New Guinea (PNG) experience profound morbidity from ALRI caused by Streptococcus pneumoniae. As a result of evolutionary divergence, the human PNG population exhibits profound genetic variation and diversity. To address unmet health needs of children in PNG, we tested whether genetic variants increased ALRI morbidity. Whole-exome sequencing of a pilot child cohort identified homozygosity for a novel single-nucleotide variant (SNV) in coenzyme Q6 (COQ6) in cases with ALRI. COQ6 encodes a mitochondrial enzyme essential for biosynthesis of ubiquinone, an electron acceptor in the electron transport chain. A significant association of SNV homozygosity with ALRI was replicated in an independent ALRI cohort (P = 0.036). Mice homozygous for homologous mouse variant Coq6 exhibited increased mortality after pneumococcal lung infection, confirming causality. Bone marrow chimeric mice further revealed that expression of variant Coq6 in recipient (that is, nonhematopoietic) tissues conferred increased mortality. Variant Coq6 maintained ubiquinone biosynthesis, while accelerating metabolic remodeling after pneumococcal challenge. Identification of this COQ6 variant provides a genetic basis for increased pneumonia susceptibility in PNG and establishes a previously unrecognized role for the enzyme COQ6 in regulating inflammatory-mediated metabolic remodeling.


Conflict of interest statement

Competing interests: T.E.D. had no financial conflicts of interest during the years in which he contributed to the project (2018 and earlier). He is currently employed by Mission Bio, Inc. and serves as a scientific advisor for RhoDx, Inc. The other authors declare no competing interests.

Figures
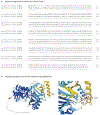
Ext. Data Fig. 1.
Ext. Data Fig. 1.. Murine and human COQ6 are highly conserved.
a. Complete protein sequences of human and murine COQ6 aligned using Clustal O. “*” indicates identical amino acid residues, “:” indicates conservation between amino acids with strongly similar properties. b. The predicted 3D structure of murine COQ6 indicates that D316 resides in a similar location in an α-helix as human D308 and forms a hydrogen bond with nearby H311. Graphic is a screenshot obtained from AlphaFold, provided as freely available for both academic and commercial use under Creative Commons Attribution 4.0 (CC-BY 4.0) license terms.
Ext. Data Fig. 2.
Ext. Data Fig. 2.. Equivalent immune cell populations in naive WT (gray) and DY (blue) mice.
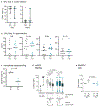
Flow cytometry data from a. BAL fluid, b. lung, c. blood, d. spleen, e. inguinal lymph nodes, and f. thymus, quantifying major leukocyte populations. We also quantify total number of cells per tissue. Data from 2-4 independent experiments, each symbol represents value from one animal, line at median, (n) given underneath x-axis labels. P-value determined by Mann-Whitney (two-tailed).
Ext. Data Fig. 3.
Ext. Data Fig. 3.. Equivalent recruitment of inflammatory cells in WT and DY mice after Sp challenge, with mild intracellular Sp killing defect.
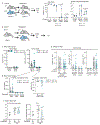
a. Percentage of AMs and PMNs identified by flow cytometry in BAL fluid of matched WT and DY mice 4 dpi. b. Equivalent concentrations of TNFα, IL-1α, IFNγ and IL-10 in BAL fluid of Sp-challenged WT and DY mice 4 dpi. (a,b) Each symbol represents value from one animal, line at median, 95% CI shown, p-values determined by Mann-Whitney(two-tailed), data combined from two independent experiments, (n) given below x-axis labels. c. Percentage of intracellular bacteria killed in one hour by BMDMs derived from WT (solid) or DY (blue) mice. Each symbol represents the average of triplicate technical samples derived from one experiment. Data are derived from 4 independent experiments (biological replicates), line at median, P-value determined by Mann-Whitney (two-tailed). d. CellRox fluorescence in BMDMs from WT (grey) or DY (blue) mice 3 h after Sp infection in vitro. Total cellular ROS production was measured by CellRox fluorescence, with contribution of mtROS to total ROS defined by mitoTEMPO inhibition. BMDMs incubated with CellRox with MitoTEMPO (squares; 10 μM), NAC (triangles;10 mM) or without either inhibitor (circles). Maximum ROS signal was determined by incubating BMDMs with tBHP (dark grey); background fluorescence measured on BMDMs with no CellRox added (light grey). MFI acquired by microscopy. Whiskers show 1-99% confidence interval, with boxes showing 25-75% confidence intervals and lines at median. Outliers shown as individual symbols, each representing value from one cell, n given below x-axis. P-values determined by Kruskal-Wallis (p < 0.0001) followed by selected pairwise comparisons with Dunn’s adjustment for multiple comparisons. e. WT or DY mice received MitoSox via i.t. instillation 30 m prior to i.t. instillation of DDAO-labeled Sp. BAL lavage was performed on animals 30 min after Sp challenge and MitoSox MFI of AMs measured by flow cytometry. Data shown as ratio of MFI (infected AMs):MFI (uninfected AMs). Each symbol represents value from one mouse, data from 3 independent experiments, p-value determined by Mann-Whitney (two-tailed). In two experiments, one control mouse and two infected animals were used.
Ext. Data Fig. 4.
Ext. Data Fig. 4.. Complete reconstitution of chimeric recipients with innate immune cells derived from bone marrow donor.
a. Flow cytometric analysis of BAL fluid and whole lung homogenates obtained from WT→WT.1 and DY→WT.1 chimeric mice 72 hpi revealed >98% of all hematopoeitic (CD45+) cells were marked as CD45.2 (donor), with equivalent or increased AM, PMN, or monocyte populations derived from DY donors. b. Schematic of reconstitution of CD45.2+ WT or DY mice with bone marrow cells derived from CD45.1+ WT (WT.1) mice. Mice were challenged with Sp eight weeks after reconstitution. c. Flow cytometric analysis revealed >98% of CD45+ cells in BAL fluid of infected chimeric mice were donor-derived (CD45.1+), with proportionally fewer recipient hematopoeitic cells (CD45.2+) remaining in WT.1→DY chimeric mice. Similar numbers of CD45.1+ cells were observed in BAL fluid from WT.1→WT and WT.1→DY mice. d. Of the recipient CD45.2+ cells remaining in BAL fluid from infected chimeras, virtually none were AMs or PMNs; most were CD3+. e. Total cell numbers of circulating CD45.2+ cells in blood from WT.1→WT and WT.1→DY chimeric mice, revealing that the majority of remaining recipient CD45.2+ cells were CD3+. f. Wet:dry weight ratio of and Evans Blue infiltration into BAL fluid of female chimeric WT.1→WT or WT.1→DY mice 72 hpi. (a,c,d,e,f) Each symbol represents value from one animal, line at median, 95% CI shown, p-values determined by Mann-Whitney (two-tailed), data combined from two (b,c,d,f) or seven (e) independent experiments, (n) given below x-axis labels.
Ext. Data Fig. 5.
Ext. Data Fig. 5.. Equivalent expression of COQ6 in mitochondria isolated from hearts of WT, heterozygous WT/DY, or DY mice.
Immunoblot of mitochondria (normalized to total protein; 40 μg each sample) from hearts of indicated mice, illuminated using the LiCOR Odyssey system. Representative of three independent immunoblots. The entire immunoblot is shown.
Ext. Data Fig. 6.
Ext. Data Fig. 6.. Equivalent number and morphology of mitochondria in AMs obtained from WT or DY mice.
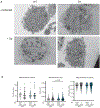
a. Representative images of transmission electron micrographs of fixed AMs harvested from WT or DY mice. AMs were either uninfected or infected in vitro with Sp prior to fixation. Mitochondria are indicated in boxes. Scale bars = 500 nm. b. Quantification of mitochondrial numbers per cell, area of each mitochondria, and circularity of each mitochondria (perfect circle = 1, line = 0). Each symbol represents values for a cell (number) or for a mitochondrion (area and circularity). Median with 95% CI shown, (n) given below x-axis labels, p-value determined by Kruskal-Wallis followed by adjustment for multiple comparisons for pairwise analyses.
Ext. Data Fig. 7.
Ext. Data Fig. 7.. COQ6DY does not impair calcium flux in AMs or BMDMs.
Cytosolic calcium was measured by confocal microscopy in Fluo-4 loaded BMDMs (a,b) and AMs (c,d) treated with pneumolysin. a) Peak amplitude of calcium signals from WT (grey) and DY (blue) cells from a representative experiment of three independent experiments. b,d) Average peak calcium signal from n = 3 experiments. c) Peak amplitude of calcium signals from WT (grey) and DY (blue) cells from three independent experiments (each experiment shown). e) Representative kinetic calcium tracing from BMDMs stimulated with ionomycin (400nM). f) Peak amplitude of calcium signals from > 100 WT and DY BMDMs stimulated with ionomycin. g,h,i) Calcium flux measured by flow cytometry in Indo-1 loaded AMs. Representative kinetic calcium tracing from BMDMs stimulated with ionomycin (100nM) first in calcium-free media (arrow) to induce ER store release. 1mM CaCl2 was added at 120s as indicated by the darker blue bar to allow extracellular store-operated calcium entry (SOCE). h) Area under the curve (AUC) of ER store release (30-120s) and (i) SOCE (150-450s) segments from n = 7 experiments. (a,c,f) Each symbol represents value from one cell, line at median, 95% CI shown. N=number of cells, given below each x-axis. (b,d,h,i) Each symbol represents average value for all cells analyzed in each experiment; bars show mean ± SD. N=number of experiments, given below x-axis. e) Each symbol shows mean ± SEM of all WT (gray) or DY (blue) cells analyzed in one representative experiment. Data were analyzed using unpaired Mann-Whitney (two-tailed) (a, c, h-i) or paired Wilcoxon rank test (two-tailed) (b, d). ns = not significant.
Ext. Data Fig. 8.
Ext. Data Fig. 8.
No difference in calcium flux in cardiomyocytes isolated from WT or DY mice.
Ext. Data Fig. 9.
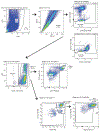
Ext. Data Fig. 9.. Gating strategy for BAL fluid obtained from infected chimeric mice.
SSC x FSC used to exclude debris. SSC-A x SSC-H used to gate on singlets/exclude doublets. CD45.1 x CD45.2 used to identify all CD45+ cells (two examples shown; one from CD45.1+ recipient and one from CD45.2+ recipient) and exclude non-hematopoietic cells. SSC x CD45.1+ (or CD45.2+, not shown) used to separate donor and recipient cells. Gating on live/singlets/all CD45/CD45.1+, CD11b x Ly6G is then used to identify PMNs. Gating on live/singlets/all CD45/CD45.1+, CD11c x CD64 is used to identify macrophages, followed by CD11c x SiglecF to identify AMs.
Fig. 1.
Fig. 1.. Discovery and replication of a novel SNV associated with ALRI in PNG.
a. Locations of Goroka (G) in Eastern Highland Province (orange) and of East Sepik Province (ES), in the lowlands. b. The six cases in our pilot study were from separate villages; cases represented by star and unique identifier. c. Analysis pipeline used to prioritize 35,618 total unique variants derived from whole exome sequencing. First, 5,942 of the total 35,618 variants were classified as “rare,” defined as < 1% occurrence in ExAC database (now gnomAD). Of rare variants, 3,380 were classified as nonsynonymous, defined as “changed the primary amino acid structure of the gene product, but did not result in a stop codon”. Of these 3,380 variants, 1,754 were putatively deleterious by CADD score > 20, and 102 were found as homozygous in at least one case, but in no controls. Of the 102 rare, non-synonymous, deleterious variants found as homozygous in cases but not controls, three variants were present in three of six families. d. Pedigrees of six index cases (shaded grey, blue outline). Each case is marked by a numerical identifier as in panel (B). Subjects’ ages at presentation are denoted underneath each symbol. Alleles are given as “A” for COQ6WT and “a” for COQ6DY. e. Representative results from conventional Sanger sequencing of cases and controls, confirming G→T in COQ6DY. f. Sites of resident villages of the 115 ALRI cases in replication cohort. Blue circle size depicts number of cases. Elevation provided to demonstrate geographic separation of villages from which subjects were recruited. g. Results of ddPCR performed on 115 cases and 130 family controls, confirming association of COQ6DY with ALRI (two-sided Fisher’s exact test, p=0.036). h. Population of frequency of COQ6DY in 100 randomly-selected subjects in East Sepik Province. i. Graphical depiction of the ubiquinone (“Q”) biosynthetic complex, located in the matrix of the mitochondrial inner membrane. The precursor 4-hydroxybenzoate (4-HB) is transported into the mitochondrial matrix, then converted to ubiquinone by a complex of at least ten enzymes. Ubiquinone shuttles electrons from complexes I and II to complex III in the electron transport chain.
Fig. 2.
Fig. 2.. Mice homozygous for Coq6DY exhibit increased mortality after pneumococcal challenge.
a. Murine COQ6 residue D316 is homologous to human D308, which is converted to D308Y by COQ6DY. We therefore generated a mouse model in which murine D316 is converted to tyrosine. b. The predicted 3D structure of human COQ6 places D308 in an α-helix and creating a hydrogen bond with H303. Graphic is a screenshot obtained from AlphaFold, provided as freely available for both academic and commercial use under Creative Commons Attribution 4.0 (CC-BY 4.0) license terms. c. Survival of matched (sex and age) WT (black) and DY (blue) mice was monitored for 14 days after intra-tracheal (i.t.) instillation of Sp. P-value determined by Mantel-Cox, n=29 WT, 29 DY (n=15 male, 14 female for each genotype). Data combined from four independent experiments d. Bacterial burden of BAL fluid and blood obtained from matched WT (gray) and DY (blue) mice 4 dpi after Sp challenge, quantified as colony-forming units (cfu). e. Numbers of AMs and PMNs from BAL fluid, percentages of AMs, PMNs and monocytes (monos) in whole lung homogenates, and percentages of monocytes, PMNs, B and T cells in blood obtained from matched WT (gray) and DY (blue) mice 4 dpi after Sp challenge. f. H&E staining of formalin-fixed, paraffin-embedded lungs obtained from Sp-challenged WT and DY mice 4 dpi, “I” indicates area of inflammatory infiltrates, scale bars 500 μm or 200 μm, as indicated. Data from two independent experiments, 10 mice of each genotype. g,h. Concentrations of CXCL2, CCL3, CCL4, IL-6 and IL-1β in (g) BAL fluid and (h) serum obtained from Sp-challenged WT and DY mice 4 dpi. Inflammatory cytokines also tested that did not show significant differences included TNFα, IL-1α, IFNγ and IL-10 (Ext. Data Fig. 3B). (d,e,g,h) Each symbol represents value from one animal, line at median, 95% CI shown, p-values determined by two-tailed Mann-Whitney, data combined from two independent experiments, (n) given below x-axis labels.
Fig. 3.
Fig. 3.. Chimeric mice reveal recipient (e.g. non-hematopoeitic) genotype confers increased susceptibility to Sp infection.
a. Schematic of bone marrow chimera generation and challenge, in which bone marrow cells obtained from WT or DY (CD45.2+) mice reconstituted the hematopoietic compartment of irradiated CD45.1+ WT mice. b. Survival of chimeric WT→WT.1 (gray-filled) and DY→WT.1 (blue-filled) mice was monitored for 14 days after intra-tracheal (i.t.) instillation of Sp. P-value determined by Mantel-Cox, n=15 WT→WT.1, 20 DY→WT.1 chimeric mice. Data combined from two independent experiments. c. Bacterial burden of blood obtained from chimeric mice 72 hours post-infection (hpi). d. Schematic of bone marrow chimera generation and challenge, in which bone marrow cells obtained from CD45.1+ WT (WT.1) mice reconstituted the hematopoietic compartment of irradiated CD45.2+ WT or DY mice. e. Survival of chimeric WT.1→WT (gray outline) and WT.1→DY (blue outline) mice was monitored for 14 days after intra-tracheal (i.t.) Sp instillation. P-value determined by Mantel-Cox, n=28 WT.1→WT, 32 WT.1→DY chimeric mice. Data combined from three independent experiments. f,g. Bacterial burden of (f) blood or (g) BAL fluid obtained from chimeric mice 72 hours post-infection (hpi). h. Representative histology of formalin-fixed, paraffin-embedded lung tissue obtained from WT.1→WT (n=4) or WT.1→DY (n=8) chimeric mice 72 hpi. Entire lung section shown in top panels, with insets focused on areas of inflammatory infiltrates (“I”). Small areas of hemorrhage indicated by “H.” Scale bars (1 mm, 100 μm) as indicated. Images from tissues collected during one experiment. (c,f,g) Each symbol represents value from one animal, line at median, 95% CI shown, p-values determined by Mann-Whitney (two-tailed), data combined from two (C), seven (F) or three (G) independent experiments, (n) given below x-axis labels.
Fig. 4.
Fig. 4.. No impairment of acute inflammatory response in WT.1 → DY chimeric mice.
a. Schematic of experimental design. b. Percentages and cell numbers of AMs and PMNs found in BAL fluid of WT.1→WT (grey outline) or WT.1→DY (blue outline) chimeric mice 72 hpi. c. Percentage and cell numbers of indicated populations found in blood obtained from WT.1→WT (grey outline) or WT.1→DY (blue outline) chimeric mice 72 hpi. d,e. Concentrations of inflammatory chemokines and cytokines in (D) BAL fluid and (E) blood obtained from WT.1→WT (grey outline) or WT.1→DY (blue outline) chimeric mice 72 hpi, as quantified by a flow-based multiplex assay. (b-e) Each symbol represents value from one animal, line at median, 95% CI shown, p-values determined by Mann-Whitney (two-tailed), (n) given below x-axis labels, data combined from three (b), seven (c) or two (d,e) independent experiments.
Fig. 5.
Fig. 5.. COQ6DY does not impair ubiquinone production.
a. Multiple ubiquinone species were quantified by mass spectrometry of mitochondria isolated from WT (grey) and DY (blue) tissues (heart, lung, naive and Sp-infected BMDMs). Peak areas were normalized to total protein. Each symbol represents one sample (technical replicate), line at median, 95% CI shown, n=5 samples, data from one of two independent experiments (biological replicates). b. Growth of S. cerevisiae (parent strain W303) transformants (P416 GPD empty vector, S. cerevisiae COQ6WT, human COQ6WT, human COQ6DY) serially diluted and grown on permissive (YPD, left image) and restrictive (YPG, right image) media. Representative of one of two independent transformations.
Fig. 6.
Fig. 6.. Expression of Coq6DY accelerated OxPhos downregulation after in vivo Sp infection or in vitro exposure to PLY.
a. Oroboros respirometry of cardiac tissue obtained from naive (gray or no outline) or Sp-infected (black outline) WT (gray-filled) or DY (blue-filled) mice. Oxygen flux of complex I, complex I provided ADP as substrate (I+ADP); complexes I and II (I+II); complex III (III); uncoupled respiration (unc); and after rotenone (rot). Each symbol represents value from one experiment (biological replicate); line at median; 95% CI shown; p-value (* = p = 0.0286) determined by Mann-Whitney (two-tailed); data from 4 independent experiments in which cardiac tissue from naïve or infected DY and WT mice were assessed simultaneously. b. Agilent Seahorse respirometry (OCR and ECAR) of AMs obtained from naïve WT (gray center) or DY (blue center) mice, with (navy outline) or without (black outline) exposure to PLY x 1 h. Each symbol represents mean ± SD of n=5 technical replicates, p-value (*** = p < 0.0001) determined by two-way ANOVA of three time points during FCCP treatment, grouped by control vs PLY-treated samples, data representative of four independent experiments (biological replicates).
Fig. 7.
Fig. 7.. Increased susceptibility to Pa infection in WT.1→DY chimeric mice.
a. Survival of WT (n = 18, 13F/5M) and DY (n = 20, 15F/5M) mice, matched for age and sex, following i.t. instillation of Pa. Data combined from three independent experiments. b. Survival of WT.1→WT (n = 14) and WT.1→DY (n = 14) chimeric male mice after i.t. instillation of Pa. Data combined from two independent experiments. (a,b) Survival curves compared using Mantel-Cox. c. Bacteremia in WT.1→WT (solid outline, n = 9) and WT.1→DY (blue outline, n = 8) chimeric (male) mice was quantified by serial dilution 48 hpi. d. Inflammatory cytokines/chemokines were quantified in serum obtained from WT.1→WT (solid outline, n = 9) and WT.1→DY (blue outline, n = 8) (male) chimeric mice 48 hpi. (c,d) Data from one experiment, symbols represent values obtained for each mouse, line at median and 95% CI shown; p-values determined using Mann-Whitney (two-tailed).

References

References (main text)

    1. Caballero MT et al. Uncovering Causes of Childhood Death Using the Minimally Invasive Autopsy at the Community Level in an Urban Vulnerable Setting of Argentina: A Population-Based Study. Clin. Infect. Dis 73, S435–S441 (2021). - PMC - PubMed
    1. Chidlow GR et al. Respiratory viral pathogens associated with lower respiratory tract disease among young children in the highlands of Papua New Guinea. J. Clin. Virol 54, 235–239 (2012). - PMC - PubMed
    1. Pomat WS et al. Safety and immunogenicity of neonatal pneumococcal conjugate vaccination in Papua New Guinean children: a randomised controlled trial. PLoS One 8, e56698 (2013). - PMC - PubMed
    1. Bergstrom A et al. A Neolithic expansion, but strong genetic structure, in the independent history of New Guinea. Science 357, 1160–1163 (2017). - PMC - PubMed
    1. Brucato N et al. Papua New Guinean Genomes Reveal the Complex Settlement of North Sahul. Mol. Biol. Evol 38, 5107–5121 (2021). - PMC - PubMed

References (Methods only)

    1. Blyth CC et al. Childhood pneumonia and meningitis in the Eastern Highlands Province, Papua New Guinea in the era of conjugate vaccines: study methods and challenges. Pneumonia (Nathan) 9, 5 (2017). - PMC - PubMed
    1. Hindson BJ et al. High-throughput droplet digital PCR system for absolute quantitation of DNA copy number. Anal. Chem 83, 8604–8610 (2011). - PMC - PubMed
    1. Consortium TU UniProt: the Universal Protein Knowledgebase in 2023. Nucleic Acids Res 51, D523–D531 (2022). - PMC - PubMed
    1. Simossis VA & Heringa J PRALINE: a multiple sequence alignment toolbox that integrates homology-extended and secondary structure information. Nucleic Acids Res 33, W289–294 (2005). - PMC - PubMed
    1. Madeira F et al. The EMBL-EBI Job Dispatcher sequence analysis tools framework in 2024. Nucleic Acids Res 52, W521–W525 (2024). - PMC - PubMed