. 2024 Nov 4;15(1):395.
doi: 10.1186/s13287-024-03993-w.

Controlled release of hydrogel-encapsulated mesenchymal stem cells-conditioned medium promotes functional liver regeneration after hepatectomy in metabolic dysfunction-associated steatotic liver disease

Affiliations

Controlled release of hydrogel-encapsulated mesenchymal stem cells-conditioned medium promotes functional liver regeneration after hepatectomy in metabolic dysfunction-associated steatotic liver disease

Naoya Kasahara et al. Stem Cell Res Ther. .

Abstract

Background: Globally, prevalence of metabolic dysfunction-associated steatotic liver disease (MASLD) is increasing, and there is an urgent need to develop innovative therapies that promote liver regeneration following hepatectomy for this disease. Surgical excision is a key therapeutic approach with curative potential for liver tumors. However, hepatic steatosis can lead to delayed liver regeneration and higher post-operative complication risk. Mesenchymal stem cells-conditioned medium (MSC-CM) is considered a rich source of paracrine factors that can repair tissues and restore function of damaged organs. Meanwhile, hydrogels have been widely recognized to load MSC secretome and achieve sustained release. This study aimed to evaluate the therapeutic effect of hydrogel-encapsulated MSC-CM on liver regeneration following partial hepatectomy (PHx) in a rodent model of diet-induced hepatic steatosis.

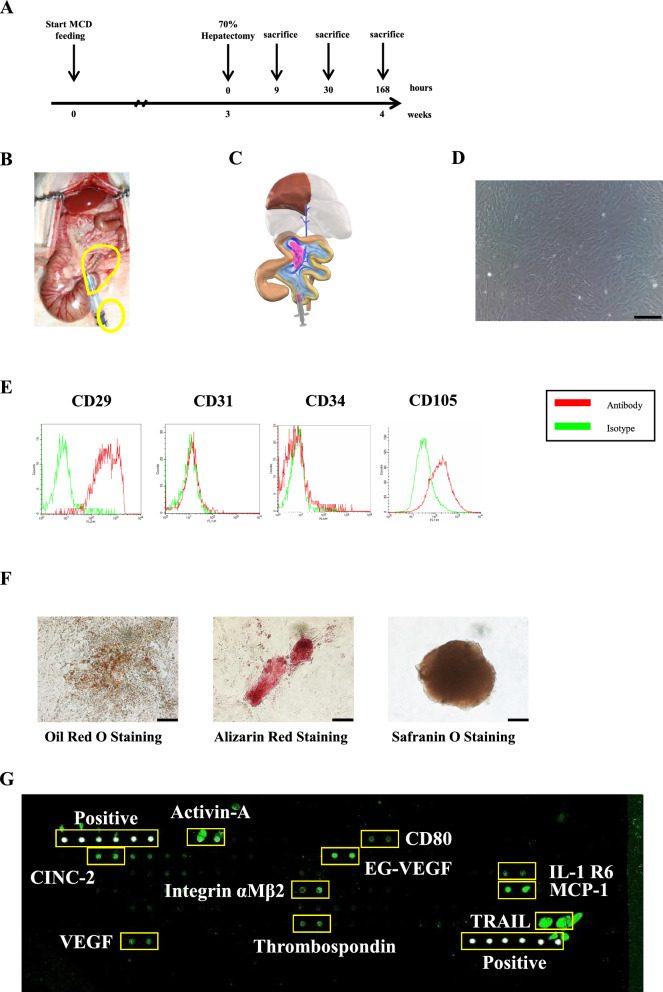
Methods: Male Lewis rats were fed with a methionine and choline-deficient diet. After 3 weeks of feeding, PHx was performed and rats were randomly allocated into two groups that received hydrogel-encapsulated MSC-CM or vehicle via the intra-mesenteric space of the superior mesenteric vein (SMV).

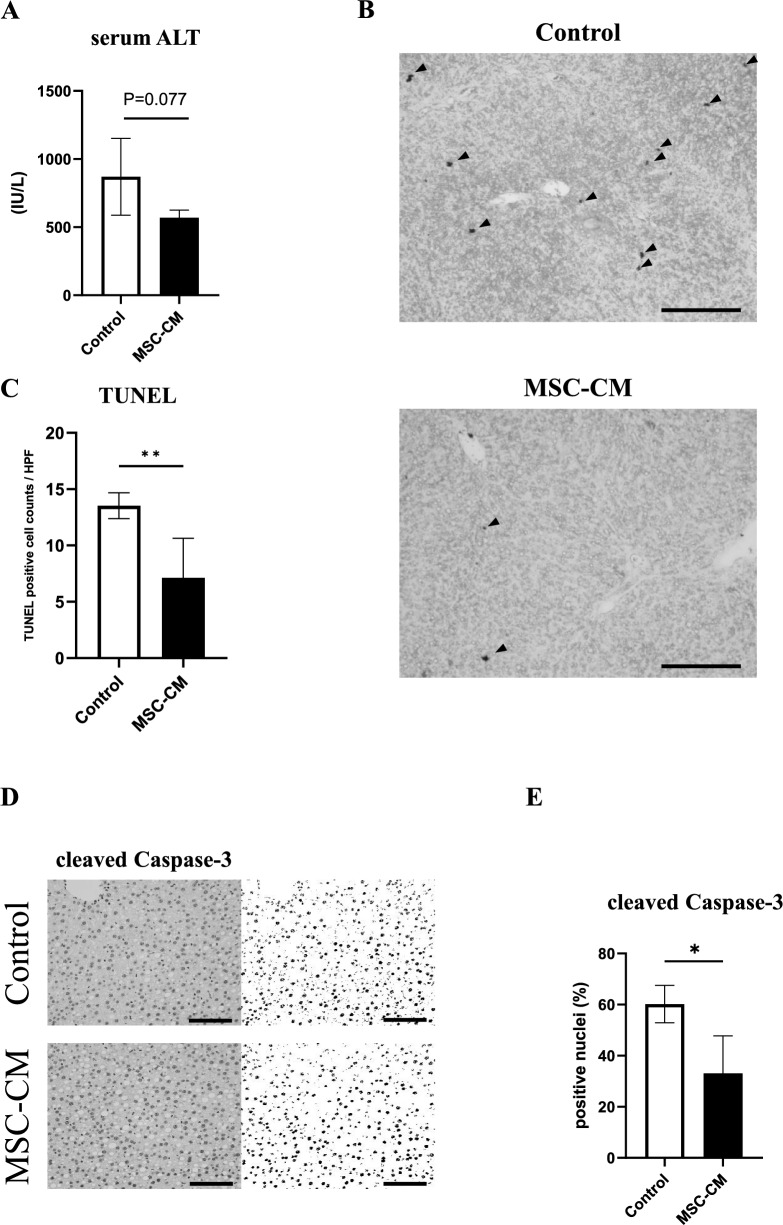
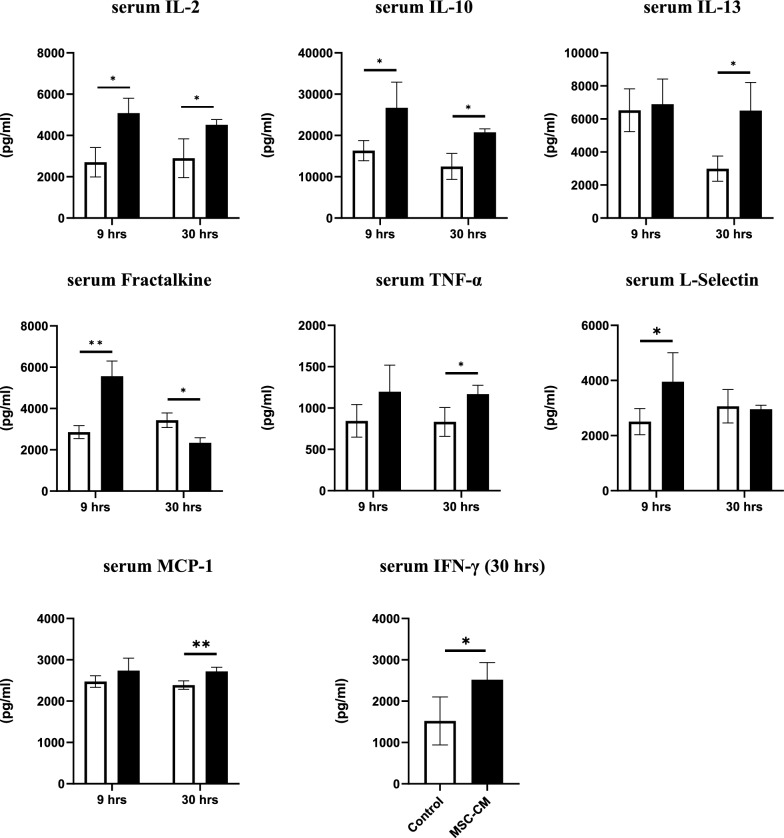
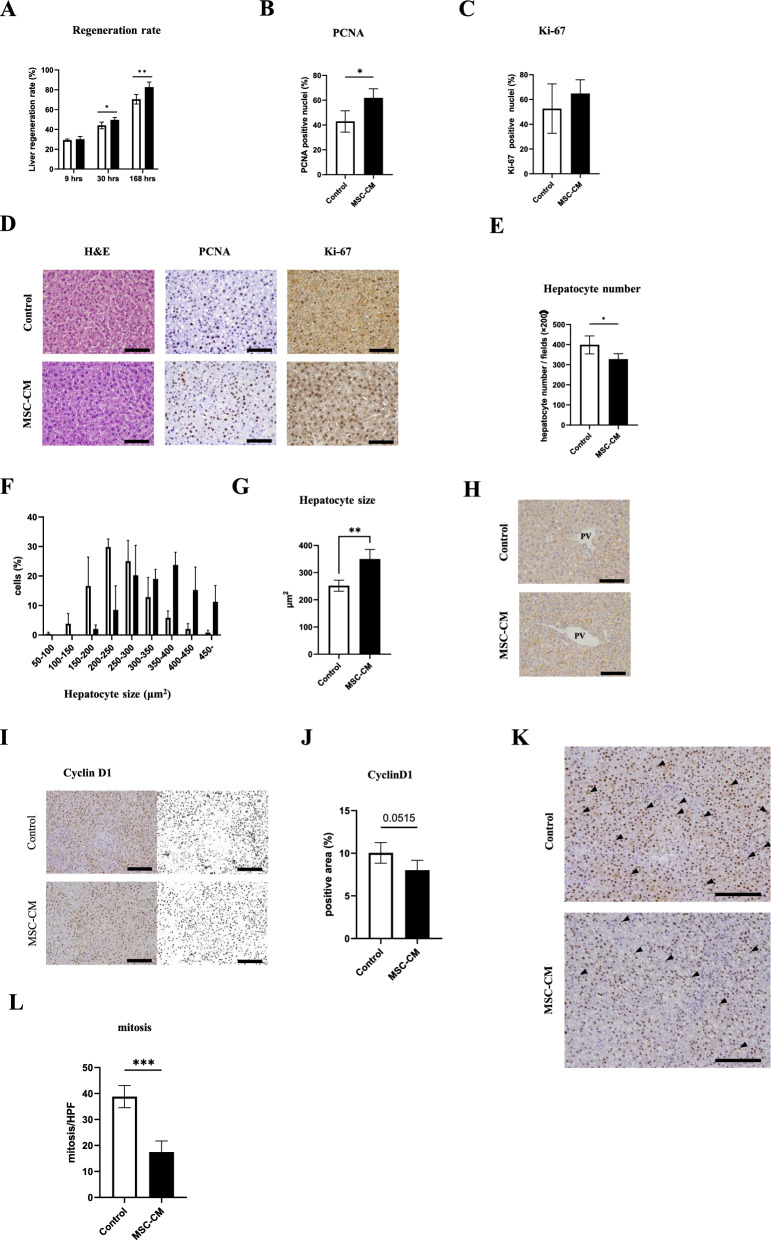
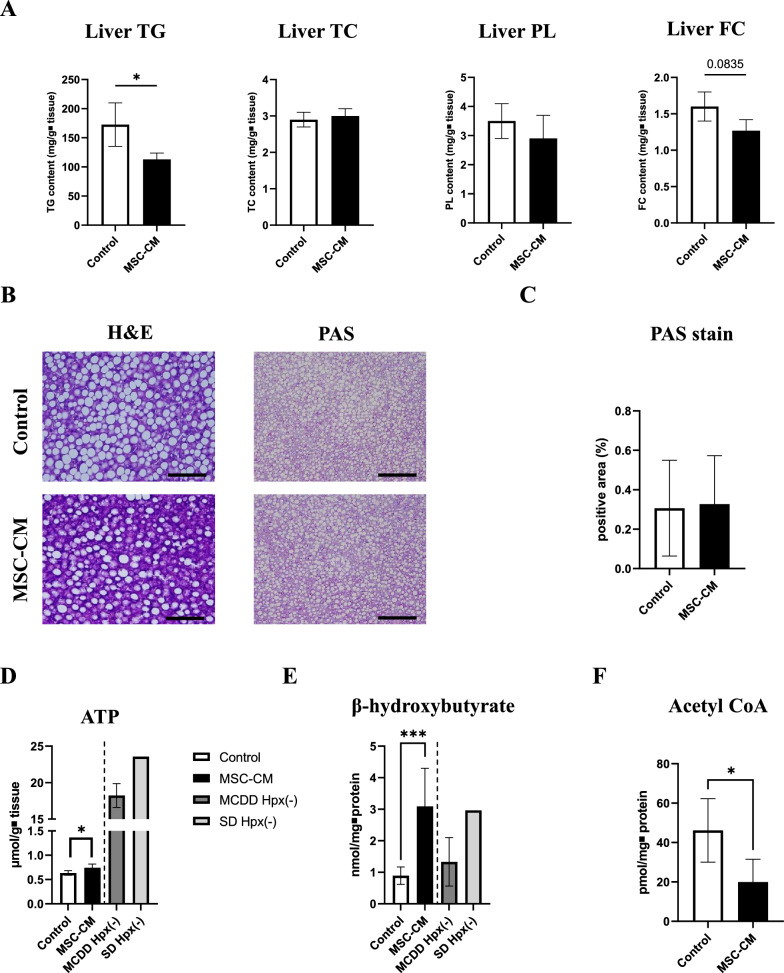
Results: The regeneration of the remnant liver at 30 and 168 h after PHx was significantly accelerated, and the expressions of proliferating cell nuclear antigen were significantly enhanced in the MSC-CM group. MSC-CM treatment significantly increased hepatic ATP and β-hydroxybutyrate content at 168 h after PHx, indicating that MSC-CM fosters regeneration not only in volume but also in functionality. The number of each TUNEL- and cleaved caspase-3 positive nuclei in hepatocytes at 9 h after PHx were significantly decreased in the MSC-CM group, suggesting that MSC-CM suppressed apoptosis. MSC-CM increased serum immunoregulatory cytokine interleukin-10 and interleukin-13 at 30 h after PHx. Additionally, mitotic figures and cyclin D1 expression decreased and hepatocyte size increased in the MSC-CM group, implying that this mode of regeneration was mainly through cell hypertrophy rather than cell division.

Conclusions: MSC-CM represents a novel therapeutic approach for patients with MASLD requiring PHx.

Keywords: Adipose tissue-derived mesenchymal stem cells; Conditioned medium; Controlled release; Hepatectomy; Hydrogel; Liver regeneration; Non-alcoholic fatty liver disease; Regenerative medicine.


Conflict of interest statement

The author(s) declare no competing interests.

Figures

Fig. 1
Fig. 1
Experimental protocol, characterization and tri-lineage differentiation of AT-MSCs and cytokine array analysis of MSC-CM. A After 3 weeks of MCD diet feeding, hepatectomy was performed. Rats were sacrificed at 9 h, 30 h and 168 h after hepatectomy. B Our model of 70% hepatectomy. C In the MSC-CM group, MSC-CM with peptide hydrogel as delivery vehicle was administered into the intra-mesenteric space of ileo-colic vein perfused area. In the control group, peptide hydrogel alone was administered. D Phase contrast images of rat AT-MSCs (original magnification, × 100, scale bars represent 200 μm). E Detection of rat AT-MSCs surface antigens by flow cytometry. AT-MSCs at passage 3–5 were stained with mAbs to CD29, CD31, CD34, CD105 and their expressions were examined. F AT-MSCs at passage 3 were induced to differentiate into adipocytes, osteoblasts, and chondrocytes-like cells (original magnification, × 200, scale bars represent 100 μm). G Images of cytokine array blots probed with MSC-CM used in this study
Fig. 2
Fig. 2
Assessments of apoptosis. A Serum ALT concentration at 9 h after hepatectomy. B Representative liver sections stained by TUNEL at 9 h after hepatectomy. Arrowheads indicate TUNEL positive nuclei of hepatocytes (original magnification, × 200, scale bars represent 200 μm). C Quantification of TUNEL-positive hepatocytes. D Quantification of cleaved Caspase-3 positive hepatocytes. E Representative liver sections stained by cleaved Caspase-3 at 9 h after hepatectomy (original magnification, × 200, scale bars represent 200 μm). Open bars, control group; closed bars, MSC-CM group. Data are presented as mean ± SD (*P < 0.05, n = 4–5/group)
Fig. 3
Fig. 3
Serum concentrations of cytokines and chemokines (IL-2, IL-10, IL-13, Fractalkine, TNF-α, L-Selectin, MCP-1) at 9 h and 30 h after hepatectomy. The data of IFN-γ is shown only those of at 30 h after hepatectomy. Open bars, control group; closed bars, MSC-CM group. Data are presented as mean ± SD (*P < 0.05, **P < 0.01, n = 4/group)
Fig. 4
Fig. 4
Assessments of liver regeneration. A Liver regeneration rates (%) at 9 h, 30 h, and 168 h after hepatectomy (9 h and 30 h: n = 4–5/group, 168 h: n = 5–8/group). B Quantification of PCNA-positive nuclei (%) at 30 h after hepatectomy (n = 4–5/group). C Quantification of Ki-67-positive nuclei in both groups at 30 h after hepatectomy (n = 4–5/group). D Representative immunohistochemical images from H&E, PCNA and Ki-67 at 30 h after hepatectomy (original magnification, × 400; scale bars represent 100 μm). E The number of hepatocytes per HPF in the liver sections at 30 h after hepatectomy (n = 4–5/group). F Hepatocyte size distribution. G Hepatocyte size in both groups. H Liver sections stained for E-cadherin are shown (original magnification, × 400, scale bars represent 100 μm). I Representative liver sections stained by Cyclin D1 at 30 h after hepatectomy (original magnification, × 400, scale bars represent 100 μm). J Relative Cyclin D1 positive area was morphologically quantified. K Representative liver sections stained by cyclin D1 at 30 h after hepatectomy. Arrows indicate mitotic figure in hepatocytes (original magnification, × 200, scale bars represent 200 μm). L Quantification of mitotic figures in both groups. Open bars, control group; closed bars, MSC-CM group. Data are presented as mean ± SD (*P < 0.05; **P < 0.01; ***P < 0.001; n = 4–5/group)
Fig. 5
Fig. 5
Differential expression analysis of liver tissue mRNA expression at 9 h for control group versus MSC-CM group. A Hierarchical clustering of four groups regarding the top 20 genes with the most significant fluctuations (standard diet-fed without PHx, MCD diet-fed without PHx, control group, MSC-CM group). B Scatter plots showing all the DEGs. C Bar chart of the most significant GO biological processes that are associated with up- and down-regulated genes. Red bars represent positive z-scores and blue bars indicate negative z-scores, with the color intensity reflecting the absolute magnitude of the z- score. X-axis represents the statistical significance of the enrichment (− log10(p-value))
Fig. 6
Fig. 6
Effect of MSC-CM on lipid metabolism and functional recovery after hepatectomy. A Liver tissue triglyceride (TG), total cholesterol (TC), phospholipids (PL), and free cholesterol content in livers at 168 h after hepatectomy (n = 5–8/group). B Representative images of H&E (original magnification, × 400, scale bars = 100 μm) and PAS (× 200, scale bars = 200 μm) staining in liver slides at 168 h after hepatectomy. C Relative PAS staining positive area was morphologically quantified. D ATP concentrations in livers at 168 h after hepatectomy (n = 5–8/group). For reference, values for both the standard diet-fed group (SD Hpx(-)) and the MCD diet-fed group without PHx (MCDD Hpx(-)) were also shown.E β-hydroxybutyrate concentrations in livers at 168 h after hepatectomy (n = 5–8/group). Values for both the standard diet-fed group (SD Hpx(-)) and the MCD diet-fed group without PHx (MCDD Hpx(-)) were also shown. F Acetyl CoA concentrations in livers at 168 h after hepatectomy (n = 5–8/group). Open bars, control group; closed bars, MSC-CM group; dark gray bars, MCDD Hpx(-) group; light gray bars, SD Hpx(-) group. Data are presented as mean ± SD (*P < 0.05, ***P < 0.001, n = 5–8/group)

References

    1. Rinella ME. Nonalcoholic fatty liver disease: a systematic review. JAMA. 2015;313:2263–73. - PubMed
    1. Henry L, Paik J, Younossi ZM. Review article: the epidemiologic burden of non-alcoholic fatty liver disease across the world. Aliment Pharmacol Ther. 2022;56:942–56. - PubMed
    1. Cotter TG, Rinella M. Nonalcoholic fatty liver disease 2020: the state of the disease. Gastroenterology. 2020;158:1851–64. - PubMed
    1. Colle I, Verhelst X, Vanlander A, Geerts A, Van Vlierberghe H, Berrevoet F, Rogiers X, Troisi RI. Pathophysiology and management of post resection liver failure. Acta Chir Belg. 2013;113:155–61. - PubMed
    1. Kele PG, van der Jagt EJ, Gouw AS, Lisman T, Porte RJ, de Boer MT. The impact of hepatic steatosis on liver regeneration after partial hepatectomy. Liver Int. 2013;33:469–75. - PubMed

LinkOut - more resources