. 2024 Nov 5;43(1):296.
doi: 10.1186/s13046-024-03213-6.

A nanoencapsulated oral formulation of fenretinide promotes local and metastatic breast cancer dormancy in HER2/neu transgenic mice

Affiliations

A nanoencapsulated oral formulation of fenretinide promotes local and metastatic breast cancer dormancy in HER2/neu transgenic mice

Maria Laura De Angelis et al. J Exp Clin Cancer Res. .

Abstract

Background: Prevention and treatment of metastatic breast cancer (BC) is an unmet clinical need. The retinoic acid derivative fenretinide (FeR) was previously evaluated in Phase I-III clinical trials but, despite its excellent tolerability and antitumor activity in preclinical models, showed limited therapeutic efficacy due to poor bioavailability. We recently generated a new micellar formulation of FeR, Bionanofenretinide (Bio-nFeR) showing enhanced bioavailability, low toxicity, and strong antitumor efficacy on human lung cancer, colorectal cancer, and melanoma xenografts. In the present study, we tested the effect of Bio-nFeR on a preclinical model of metastatic BC.

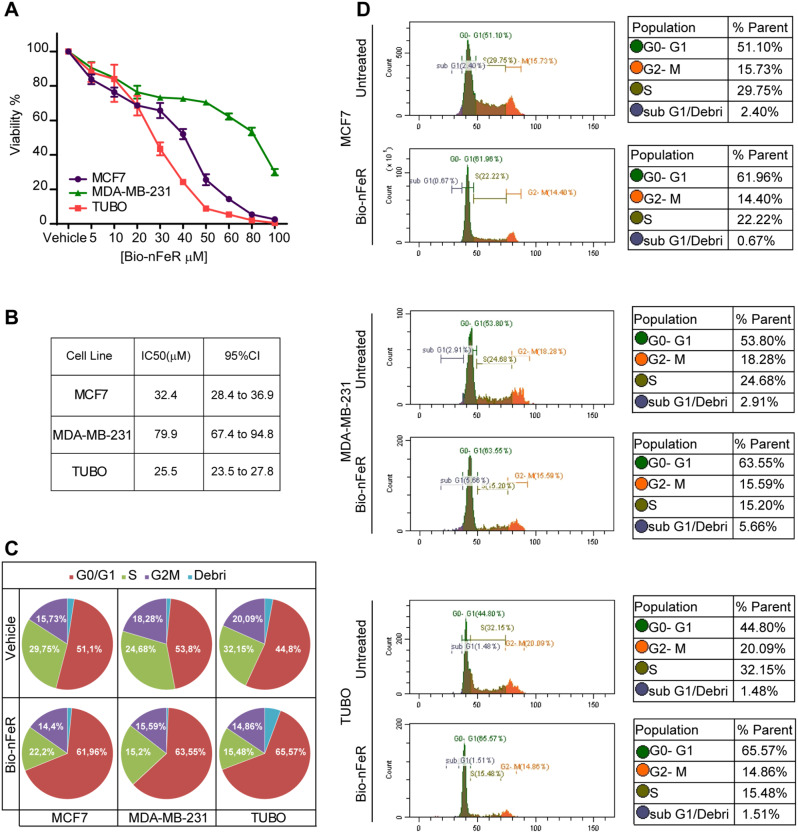
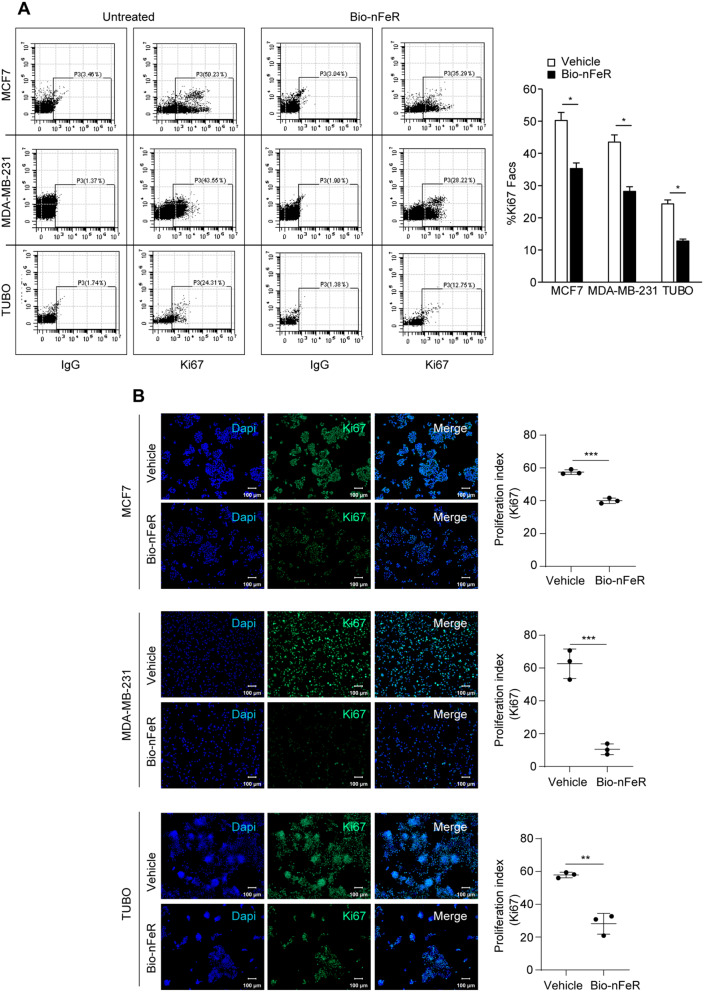
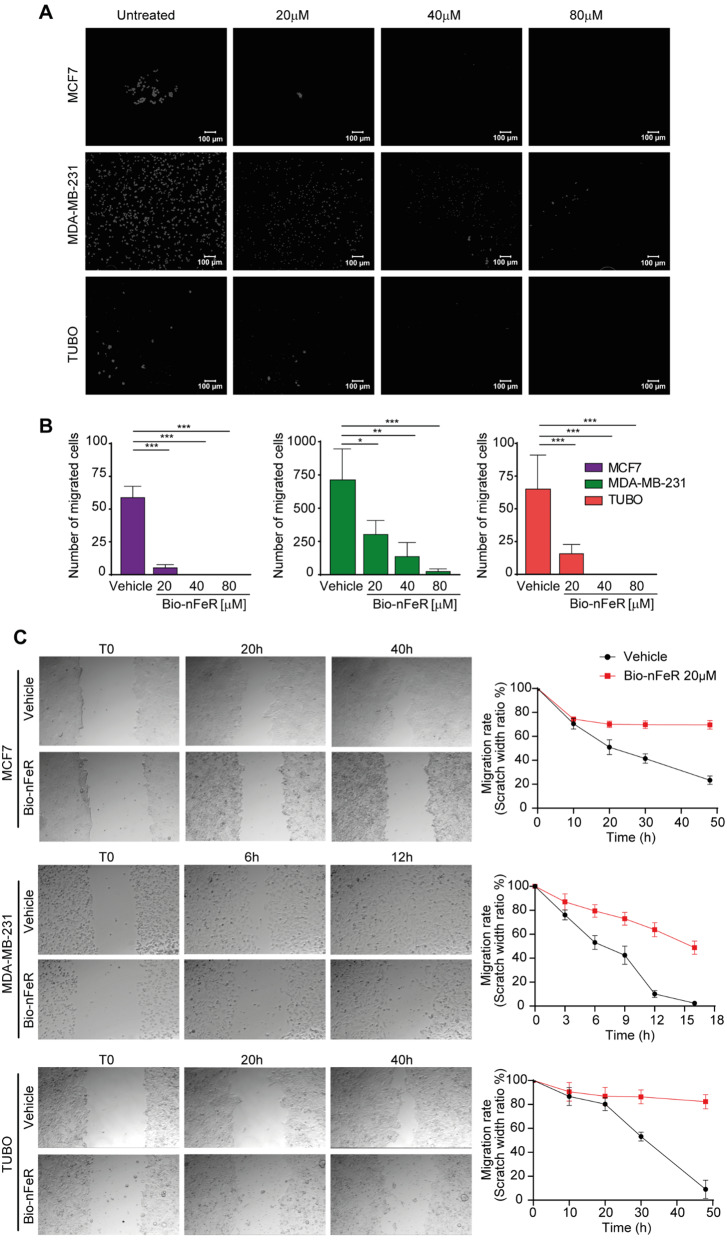
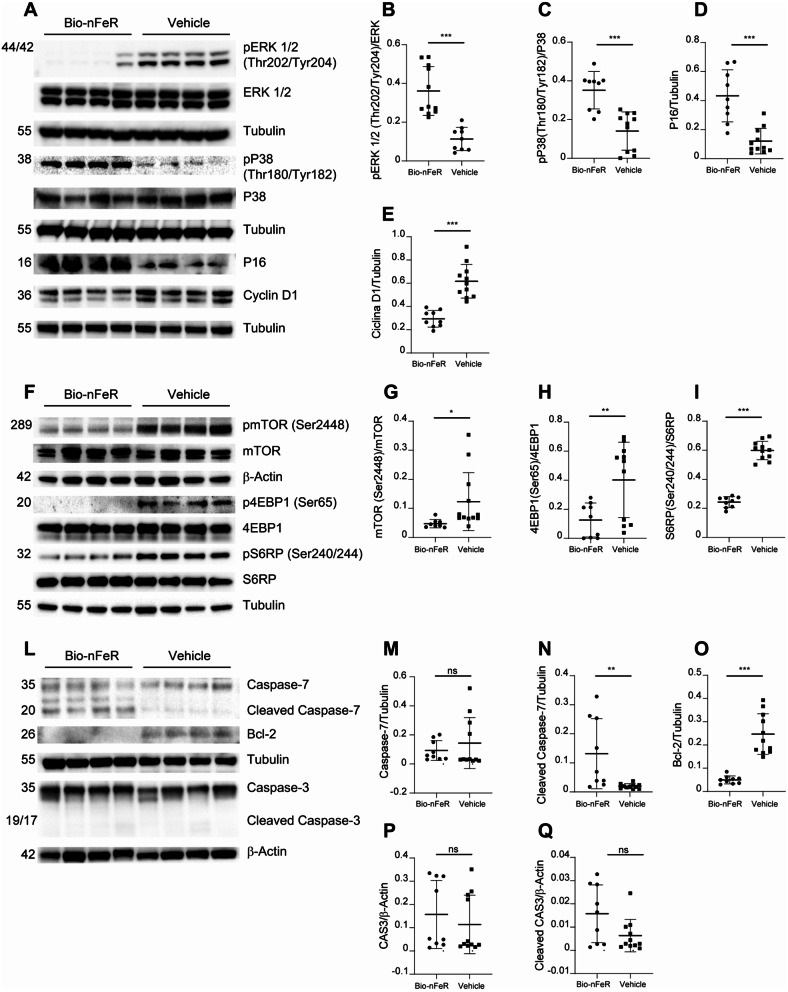
Methods: We used BC cell lines for in vitro analyses of cell viability, cell cycle and migratory capacity. For in vivo studies, we used HER2/neu transgenic mice (neuT) as a model of spontaneously metastatic BC. Mice were treated orally with Bio-nFeR and at sacrifice primary and metastatic breast tumors were analyzed by histology and immunohistochemistry. Molecular pathways activated in primary tumors were analyzed by immunoblotting. Stem cell content was assessed by flow cytometry, immunoblotting and functional assays such as colony formation ex vivo and second transplantation assay in immunocompromised mice.

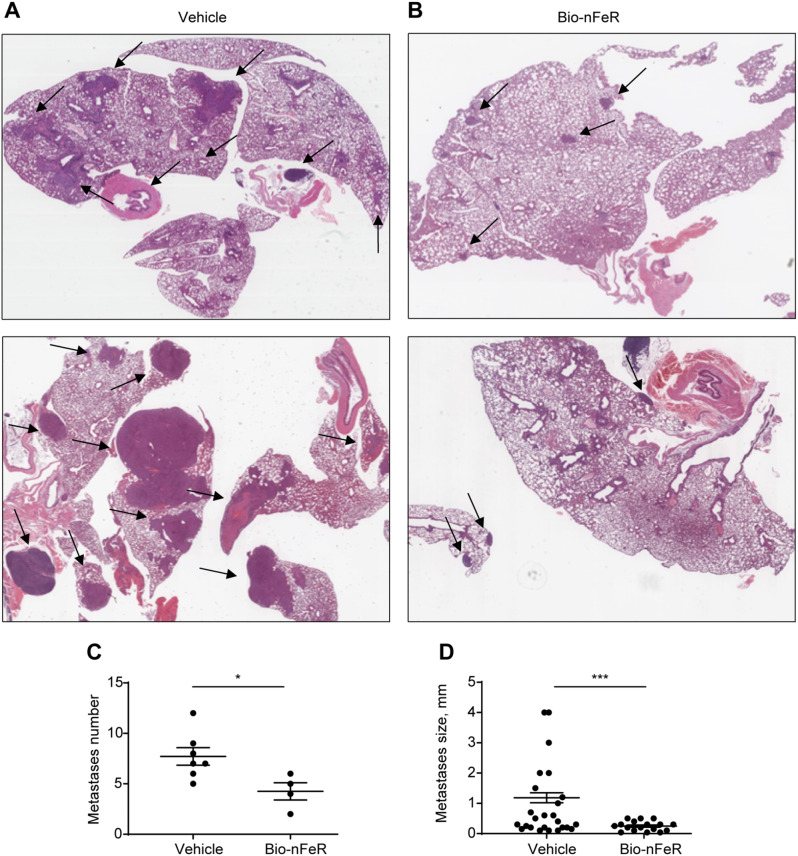
Results: Bio-nFeR inhibited the proliferation and migration of neuT BC cells in vitro and showed significant efficacy against BC onset in neuT mice. Importantly, Bio-nFeR showed the highest effectiveness against metastatic progression, counteracting both metastasis initiation and expansion. The main mechanism of Bio-nFeR action consists of promoting tumor dormancy through a combined induction of antiproliferative signals and inhibition of the mTOR pathway.

Conclusion: The high effectiveness of Bio-nFeR in the neuT model of mammary carcinogenesis, coupled with its low toxicity, indicates this formulation as a potential candidate for the treatment of metastatic BC and for the adjuvant therapy of BC patients at high risk of developing metastasis.

Keywords: Breast cancer; Cancer stem cells; Fenretinide; Metastasis; Metastatic dormancy; Retinoids; Tumor dormancy.


Conflict of interest statement

The authors declare that the research was conducted in the absence of any commercial or financial relationships that could be construed as a potential conflict of interest.

Figures

Fig. 1
Fig. 1
In vitro test of Bio-nFeR on human and murine BC cells. (A) Cell viability of BC commercial cell lines, human MCF-7 (purple) human MDA-MB-231 (green), and murine TUBO (red) treated with Bio-nFeR at the indicated concentrations for 72 h. Values represent the mean ± SD of three independent experiments. (B) IC50 of Bio-nFeR determined in BC cell lines indicated in A. (C) Cell cycle determination of Bio-nFeR-treated cell lines, as described in the Methods section. (D) Representative cell cycle analysis plots
Fig. 2
Fig. 2
Proliferative activity of Bio-nFeR-treated human and murine BC cells. (A) Flow cytometry analysis for the frequency of Ki67-positive cells in MCF7, MDA-MB-231 and Tubo lines. Cells were treated with 30µM, 80µM, 25µM Bio-nFeR, respectively, for 24 h. (B) Left: Representative confocal images of Ki67-positive nuclei of BC cell lines treated as in A; Right: Proliferation index was calculated as the ratio Ki67-positive/ total nuclei by automated pixel counting, see Methods. Scale bar 100 μm
Fig. 3
Fig. 3
Migration and invasion activity of Bio-nFeR-treated human and murine BC cells. (A) Representative images of Matrigel invasion assay on cells treated with Bio-nFeR 20–80 µM for 48 h. (B) Graphs indicating the number of migrated cells. Values represent the mean ± SD of three independent experiments. *P < 0.05, **P < 0.01, ***P < 0.001 by unpaired Student’s t test. (C) Left: Scratch test of cells in the presence of Bio-nFeR 20 µM up to 48 h, as detailed in Methods; Right: Graphs indicating the relative scratch width reduction over time. Values represent the mean ± SD of three technical replicates
Fig. 4
Fig. 4
Workflow of in vivo experiments. NeuT mice were administered with Bio-nFeR from week 14 to week 32 post-birth (PB) as described in the Methods section. At sacrifice, tumors and lungs were harvested. From each mouse, two tumors were utilized for immunohistochemistry. The remaining tumors were divided into fragments. Tissue fragments were snap frozen to be later used for molecular analyses, or dissociated into single cells to perform flow cytometry analyses, agarose clonogenic assay, or second transplantation into NSG mice. Lungs were processed for histological analysis to detect metastases’ presence, frequency, and size
Fig. 5
Fig. 5
In vivo test of Bio-nFer on neuT mice. Bio-nFeR was administered at 100 mg/kg daily, 5 days/week, from week 14 to week 32 PB by oral gavage. (A) Time-course of tumor development in the mammary glands over time, post first tumor occurrence in vehicle (black) versus Bio-nFeR (red) mice. (B) Time to reach 10/10 mammary gland invasion in vehicle (black) versus Bio-nFeR (red) mice, post birth. (C) Average tumor volume at sacrifice in vehicle (black) versus Bio-nFeR (red) mice. (D) Scatter plot of average tumor burden (volume) at sacrifice in Bio-nFeR versus control mice. (E) Average tumor weight at sacrifice in vehicle (black) versus Bio-nFeR (red) mice. (F) Scatter plot of average tumor burden (weight) at sacrifice in vehicle versus Bio-nFeR mice. (G) Left: representative images of immunofluorescence staining of mammary tumors harvested ex vivo from vehicle-treated and Bio-nFeR-treated mice (20x, 0,7x zoom magnification, scale bar 50 μm). Ki67 (pseudocolored in green) and DAPI nuclear staining (blue); Right: proliferation index by Ki67 nuclear staining on sections. Data in A represent Mean ± SEM, ***P < 0.001 by paired Student’s t test with Wilcoxon test. Data in B were analyzed by Long-rank (Mantel-Cox) test, *P < 0.05 and. Data in C, D, E, F represent Mean ± SEM, *P < 0.05 and **P < 0.01 by unpaired Student’s t test with Welch correction. Data in G represent Mean ± SD, *P < 0.05 by unpaired Student’s t test with Welch’s correction
Fig. 6
Fig. 6
Bio-nFeR targets BC stem cells within neuT mice tumors. (A) Flow cytometry analysis showing the frequency of Linneg/CD44+/CD24 cells in Bio-nFeR-treated and vehicle-treated mice. Left: representative plots; Right CD44+/CD24 quantification. (B) Upper panel: immunoblot analysis of ALDH1 on whole lysates of tumors harvested from Bio-nFeR treated and vehicle mice (see also Additional file: Fig S4A). β-actin was used as a loading control. Lower panel: ALDH1 quantification. (C) Self-renewal capacity of cells isolated from tumors as in A, evaluated as colony formation in semisolid culture and expressed as normalized colony size/percentage over plated cells. Values represent the mean ± SD of three technical replicates. *P < 0.05, **P < 0.01 and ***P < 0.001 by unpaired Student’s t test. (D) Limiting dilution assay by second transplantation into NSG mice, demonstrating a lower content of stem cells into treated tumors. Tumor-initiating cell assay performed on cells dissociated from Bio-nFeR-treated and vehicle-treated mice tumors was evaluated through second transplantation into NSG mice and quantified with the Extreme Limiting Dilution Analysis (ELDA) [29], software. Six mice were used for each dilution point. *P < 0.05
Fig. 7
Fig. 7
Protein expression analysis of Bio-nFeR versus vehicle mice tumors ex vivo. A-E) Left: Immunoblot analysis of cell cycle regulators ERK1/2, phospho-pERK1/2, p38, phospho-p38, p16 and cyclin D1 on Bio-nFeR versus vehicle mice tumors ex vivo (see also Additional file: Fig. S4B). Tubulin was used as a loading control. Right: quantification of the immunoblot shown on the left. F-I) Left: Immunoblot analysis of metabolic mTOR pathway components mTOR, phospho-mTOR, 4EBP1, phospho-4EBP1, S6RP and phospho-S6RP on Bio-nFeR versus vehicle mice tumors ex vivo (see also Additional file: Fig. S4C). Tubulin and β-actin were used as a loading control. Right: quantification of immunoblot shown on the left. L-Q); Left: Immunoblot analysis of cell death-related proteins Caspase 7, Caspase 3 and Bcl-2 on Bio-nFeR versus vehicle mice tumors ex vivo (see also Additional file: Fig. S4D). Tubulin and β-actin were used as a loading control. Right: quantification of the immunoblot shown on the left
Fig. 8
Fig. 8
Bio-nFeR treatment reduces the initiation and growth of lung metastases in neuT mice. A-B) Whole sections of mice lungs showing BC lung metastases (arrows) of different sizes and numbers occurring in the pulmonary parenchyma of .Bio-nFeR-treated versus control mice (H&E sections, 1x, digital picture Aperio ImageScope). C) Average metastases number within metastasis-positive lungs in Bio-nFeR treated versus vehicle mice (scatter plot). D) Average metastases size in Bio-nFeR treated versus vehicle mice (scatter plot). Data represent Mean ± SEM, *P < 0.05 and ***P < 0.001 by unpaired Student’s t test with Welch’s correction
Fig. 9
Fig. 9
Immunohistochemistry analysis of Ki67 and PCNA on lung metastasis from Bio-nFeR versus control mice. (A) Left: Representative IHC images of Ki67-positive nuclei on lung metastasis from Bio-nFeR versus vehicle mice; Right: Proliferation index by Ki67 staining in treated and control metastases; (B) Left: Representative IHC images of PCNA-positive nuclei in lung metastases from Bio-nFeR versus vehicle mice; Right: Proliferation index by PCNA nuclear staining in treated and control metastases. Quantifications were obtained by analyzing images at 20x magnification. Proliferation index was calculated by automated pixel counting, as the ratio between Ki67-or PCNA-positive/total nuclei (see Methods and Additional file: Fig. S5). Magnifications 5x and 20x, scale bares 200 and 50 μm, respectively

References

    1. Sung H, Ferlay J, Siegel RL, Laversanne M, Soerjomataram I, Jemal A, et al. Global Cancer statistics 2020: GLOBOCAN estimates of incidence and Mortality Worldwide for 36 cancers in 185 countries. Cancer J Clin. 2021;71(3):209–49. - PubMed
    1. Harbeck N, Gnant M. Breast cancer. Lancet (London England). 2017;389(10074):1134–50. - PubMed
    1. Hong R, Xu B. Breast cancer: an up-to-date review and future perspectives. Cancer Commun (Lond). 2022;42(10):913–36. - PMC - PubMed
    1. De Angelis ML, Francescangeli F, La Torre F, Zeuner A. Stem cell plasticity and dormancy in the development of cancer therapy resistance. Front Oncol. 2019;9:626. - PMC - PubMed
    1. Francescangeli F, De Angelis ML, Rossi R, Cuccu A, Giuliani A, De Maria R, et al. Dormancy, stemness, and therapy resistance: interconnected players in cancer evolution. Cancer Metastasis Rev. 2023;42(1):197–215. - PMC - PubMed