. 2024 Nov 4;13(1):54.
doi: 10.1186/s40035-024-00442-9.

Critical role of ROCK1 in AD pathogenesis via controlling lysosomal biogenesis and acidification

Affiliations

Critical role of ROCK1 in AD pathogenesis via controlling lysosomal biogenesis and acidification

Chenghuan Song et al. Transl Neurodegener. .

Abstract

Background: Lysosomal homeostasis and functions are essential for the survival of neural cells. Impaired lysosomal biogenesis and acidification in Alzheimer's disease (AD) pathogenesis leads to proteolytic dysfunction and neurodegeneration. However, the key regulatory factors and mechanisms of lysosomal homeostasis in AD remain poorly understood.

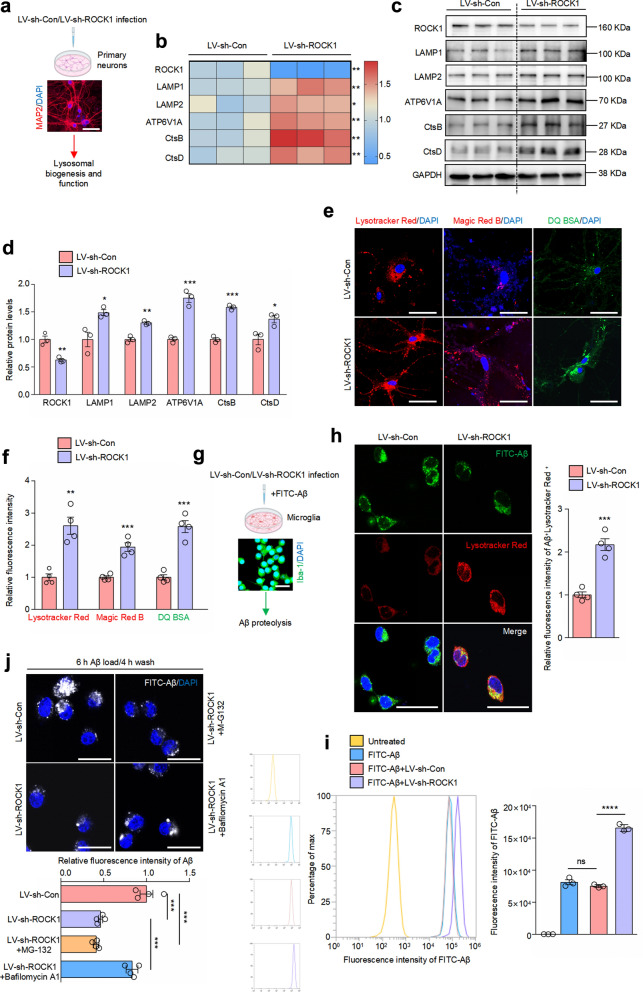
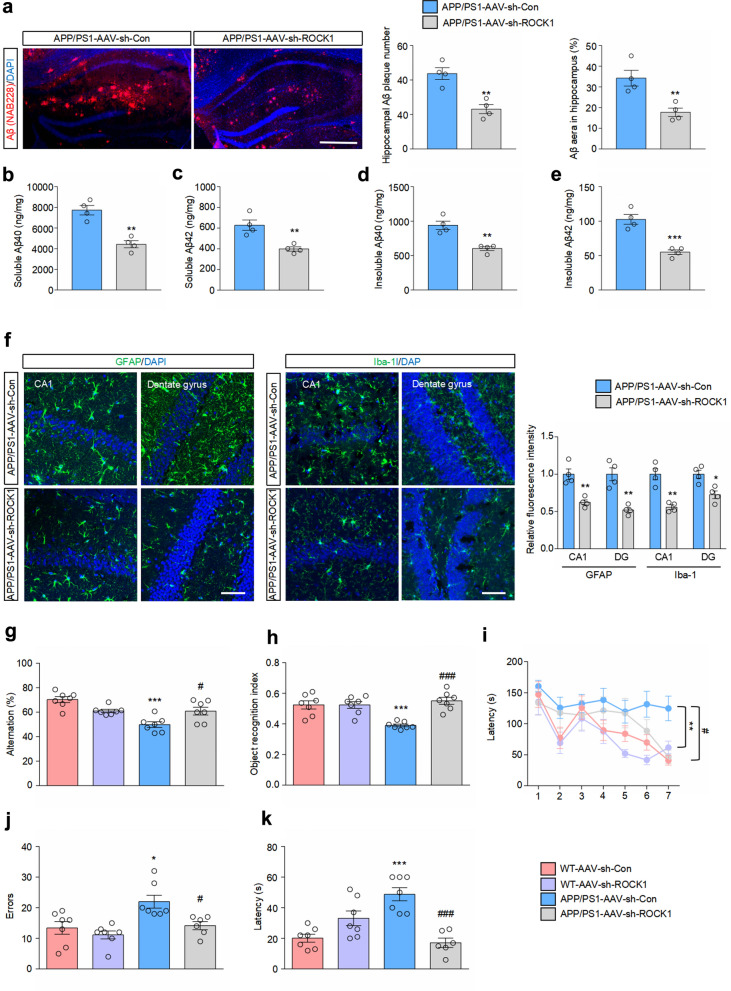
Methods: ROCK1 expression and its co-localization with LAMP1 and SQSTM1/p62 were detected in post-mortem brains of healthy controls and AD patients. Lysosome-related fluorescence probe staining, transmission electron microscopy and immunoblotting were performed to evaluate the role of ROCK1 in lysosomal biogenesis and acidification in various neural cell types. The interaction between ROCK1 and TFEB was confirmed by surface plasmon resonance and in situ proximity ligation assay (PLA). Moreover, we performed AAV-mediated ROCK1 downregulation followed by immunofluorescence, enzyme-linked immunosorbent assay (ELISA) and behavioral tests to unveil the effects of the ROCK1-TFEB axis on lysosomes in APP/PS1 transgenic mice.

Results: ROCK1 level was significantly increased in the brains of AD individuals, and was positively correlated with lysosomal markers and Aβ. Lysosomal proteolysis was largely impaired by the high abundance of ROCK1, while ROCK1 knockdown mitigated the lysosomal dysfunction in neurons and microglia. Moreover, we verified ROCK1 as a previously unknown upstream kinase of TFEB independent of m-TOR or GSK-3β. ROCK1 elevation resulted in abundant extracellular Aβ deposition which in turn bound to Aβ receptors and activated RhoA/ROCK1, thus forming a vicious circle of AD pathogenesis. Genetically downregulating ROCK1 lowered its interference with TFEB, promoted TFEB nuclear distribution, lysosomal biogenesis and lysosome-mediated Aβ clearance, and eventually prevented pathological traits and cognitive deficits in APP/PS1 mice.

Conclusion: In summary, our results provide a mechanistic insight into the critical role of ROCK1 in lysosomal regulation and Aβ clearance in AD by acting as a novel upstream serine kinase of TFEB.

Keywords: Alzheimer’s disease; Lysosomal acidification; Lysosomal biogenesis; ROCK1; TFEB.


Conflict of interest statement

The authors declare that they have no competing interests.

Figures

Fig. 1
Fig. 1
ROCK1 is upregulated in AD brains. a Schematic illustration of the experimental procedure created with BioRender.com. b qRT-PCR analysis of ROCK1 mRNA expression in the hippocampus of WT and APP/PS1 mice at different ages. n = 3. c ELISA analysis of the protein levels of ROCK1 in the hippocampus of WT and APP/PS1 mice at different ages. n = 3. d ROCK1 activity in the hippocampus of WT and APP/PS1 mice at different ages. e qRT-PCR analysis of mRNA expression of ROCK1 in the hippocampus and cortex of 9-month WT and 5 × FAD mice. n = 4. f ROCK1 protein levels in different brain regions of 9-month WT and APP/PS1 mice were detected by immunoblotting. n = 3. FC: frontal cortex, HC: hippocampus, OLF: olfactory bulb, CERE: cerebellum. Red color indicates higher expression; blue color indicates lower expression. g Co-localization of ROCK1 (green) with neurons (NeuN), astrocytes (GFAP), and microglia (Iba-1) in the cortex of 6-month-old WT mice. Nuclei were stained with DAPI (blue). White arrows indicate co-localization. n = 4. Scale bar, 50 μm. h Immunofluorescence staining of ROCK1 and LAMP1, and analysis of their co-localization in the frontal cortex of healthy controls and AD patients. n = 3. ns, no significance. Scale bars, 50 μm. i Immunofluorescence staining of SQSTM1 and ROCK1, and analysis of their co-localization in the frontal cortex of healthy controls and AD patients. n = 3. Scale bars, 50 μm. j The protein expression of ROCK1 and SQSTM1 in the temporal cortex of healthy controls and AD patients was analyzed by Immunoblotting. n = 7. k Scatter plot of soluble Aβ42 and relative SQSTM1 levels versus relative expression of ROCK1 in the human temporal cortex. Soluble Aβ42 levels were determined by ELISA in the same samples used in j. ROCK1 level was positively correlated with the levels of Aβ42 (orange line) and SQSTM1 (black line) determined by Spearman’s rank correlation test. n = 7. bd, *P < 0.05, **P < 0.01, ***P < 0.001 versus WT group, two-way ANOVA followed by Bonferroni test. e, f, *P < 0.05, **P < 0.01 versus WT group, Unpaired two-tailed Student’s t-test. hj, *P < 0.05, **P < 0.01, ***P < 0.001 versus Con group, Unpaired two-tailed Student’s t-test
Fig. 2
Fig. 2
ROCK1 decreases lysosomal biogenesis and impairs lysosomal acid environment. a Schematic illustration of the experimental procedure. Image created with BioRender.com. b Heatmap of mRNA expression of ROCK1 and lysosome-related markers detected with qRT-PCR in HEK-293T cells transfected with control or ROCK1-overexpression plasmid for 48 h. n = 3. Red color, higher expression; blue color, lower expression. c Immunoblotting of lysosome-related markers in HEK-293T cells and quantitation of their protein levels. n = 3. d Transmission electron microscopy of lysosomes in HEK-293T cells. The number of lysosomes was analyzed. n = 10 cells per group. Scale bar, 2 μm. White arrows indicate lysosomes. e Lysotracker Red, Magic Red B and DQ BSA staining in HEK-293T cells. Fluorescence intensities were analyzed. n = 5. Scale bars, 25 μm. f Standard curve of LysoSensor to determine the lysosomal pH values of HEK-293T cells. g Lysosomal pH of HEK-293T cells was determined by LysoSensor. n = 5. h Schematic illustration of the experimental procedure. Image created with BioRender.com. i AAV-Vector and AAV-ROCK1 were successfully microinjected into the hippocampus of WT mice, respectively. GFP (green) was used to visualize viral diffusion. Scale bar, 200 μm. j qRT-PCR analysis of expression levels of indicated mRNAs. n = 3. k Transmission electron microscopy of lysosomes in the hippocampus. The number of lysosomes was analyzed. n = 9 slices from 3 mice. Scale bars, 1 μm. *P < 0.05, **P < 0.01, ***P < 0.001 versus vector (b-e, g) or AAV-Vector group (j, k), Student’s t-test
Fig. 3
Fig. 3
ROCK1 downregulation increases lysosomal numbers and maintains lysosomal acid environment. a Schematic illustration of the experimental procedure. Image created with BioRender.com. Primary mouse neurons were cultured and immunostained with anti-MAP2 antibody. Scale bar, 50 μm. b Primary mouse neurons were infected with lentiviral preparations expressing either sh-Con or sh-ROCK1 for 48 h. Heatmap of mRNA expression of indicated genes analyzed by qRT-PCR. n = 3. Red color, higher expression; blue color, lower expression. c, d Immunoblotting of indicated proteins in neurons infected with LV-sh-Con/LV-sh-ROCK1. n = 3. e, f Lysotracker Red, Magic Red B and DQ BSA staining in primary mouse neurons infected with LV-sh-Con/LV-sh-ROCK1. Relative fluorescence intensity was analyzed. n = 4. Scale bar, 50 μm. g Schematic illustration of the experimental procedure. Image created with BioRender.com. Primary mouse microglia were cultured and immunostained with anti-Iba-1 antibody. Scale bar: 50 μm. h Mouse primary microglia were infected with LV-sh-Con/LV-sh-ROCK1 for 48 h followed by incubation with FITC-labeled Aβ for 6 h, and further incubated with Lysotracker Red. n = 4. Scale bars, 50 μm. i Mouse primary microglia were infected with LV-sh-Con/LV-sh-ROCK1 for 48 h followed by incubation with FITC-labeled Aβ for 6 h. The population of FITC-Aβ-positive cells was measured by flow cytometery. n = 3. ns, no significance. j Mouse primary microglia infected with LV-sh-Con/LV-sh-ROCK1 were treated with MG-132 or Bafilomycin A1 for 1 h, followed by incubation with FITC-labeled Aβ for 6 h, washed for 4 h, and observed under a microscope. n = 4. Scale bars, 50 μm. bf, *P < 0.05, **P < 0.01, ***P < 0.001 versus LV-sh-Con group. i, j, ***P < 0.001, ****P < 0.0001 versus indicated group. Student’s t-test
Fig. 4
Fig. 4
ROCK1 directly binds to TFEB and phosphorylates it at Ser211 and Ser142. a Subcellular localization of TFEB-GFP, TFE3-GFP and ZKSCAN3-GFP in HEK-293T cells transfected with 100 nM control siRNA or ROCK1 siRNA. n = 3. ***P < 0.001 versus si-Con group, Unpaired two-tailed Student’s t-test. Scale bars, 25 μm. b, c Proximity ligation assay (PLA) and quantification of indicated proteins in HEK-293T cells. n = 4. **P < 0.01, Student’s t-test. Scale bars, 50 μm. d Direct binding between ROCK1 and TFEB in surface plasmon resonance (SPR). Purified TFEB was coupled to the SPR sensor chip, and different concentrations of ROCK1 were injected over the surface. n = 3. e Confocal image showing co-localization of endogenous ROCK1 (green) and TFEB (red) in HEK-293T cells. Fluorescence intensity profiles are shown. n = 3. Scale bars, 25 μm. f PLA and quantification of ROCK1 and TFEB in the frontal cortex of healthy controls and AD patients. n = 3. **P < 0.01, Student’s t-test. Scale bar, 50 μm. g HEK-293T cells were transfected with WT ROCK1 and its truncated plasmids, followed by Lysotracker Red staining. n = 3. **P < 0.01 versus Vector group, ###P < 0.001 versus ROCK1-WT group. One-way ANOVA test followed by Tukey’s multiple comparisons. Scale bars, 25 μm. h Immunoblotting analysis and quantification of different phosphorylated-TFEBs in HEK-293T cells transfected with si-Con/si-ROCK1. n = 3. *P < 0.05 versus si-Con group, Student’s t-test. i Immunoblotting analysis and quantification of phosphorylated-TFEBs in the temporal cortex of healthy controls and AD patients. n = 7. **P < 0.01 versus Con group, Student’s t-test. j, k Scatter plots of the protein levels of ROCK1 and p-TFEB (Ser211) (j) or p-TFEB (Ser142) (k) in the temporal cortex of healthy controls and AD patients. Data were analyzed by a linear regression method. n = 7
Fig. 5
Fig. 5
ROCK1 regulates lysosomal biogenesis, acidification, and degradation ability by phosphorylating TFEB at Ser211 and Ser142. a HEK-293T cells were transfected with indicated plasmids, and immunoblotting was carried out for p-TFEB (Ser211) and p-TFEB (Ser142). n = 3. *P < 0.05, **P < 0.01, ***P < 0.001. Statistical comparison was done using One-way ANOVA test followed by Tukey’s multiple comparisons. b Confocal images showing the localization of TFEB (green) in HEK-293T cells transfected with indicated plasmids. Relative nuclear TFEB fluorescence intensity was analyzed. n = 3. ***P < 0.001 versus ROCK1 + WT-TFEB group. Scale bar, 50 μm. c Immunoblotting analysis and quantification of ROCK1 and LAMP1 in HEK-293T cells transfected with indicated plasmids. n = 3. **P < 0.01, ***P < 0.001. d Lysosomal pH of HEK-293T cells transfected with indicated plasmids was determined by LysoSensor. n = 4. **P < 0.01, ***P < 0.001. e Degradation of lysosome-loaded DQ BSA in HEK-293T cells transfected with indicated plasmids. Relative fluorescence intensity of DQ BSA was analyzed. n = 4. ***P < 0.001. Scale bar, 50 μm. All data were analyzed with one-way ANOVA test followed by Tukey’s multiple comparisons
Fig. 6
Fig. 6
Downregulation of ROCK1 promotes TFEB nuclear translocation and lysosomal biogenesis in the brains of APP/PS1 mice. a Timeline of experimental procedure and confocal images of brain sections microinjected with adeno-associated virus carrying control shRNA (AAV-sh-Con) or ROCK1 shRNA (AAV-sh-ROCK1). GFP (green) was used to visualize viral diffusion. Scale bar, 200 μm. b PLA and quantification of ROCK1 and TFEB in the hippocampal CA3 region of APP/PS1 mice microinjected with AAV-sh-Con/AAV-sh-ROCK1. n = 3. Scale bar, 50 μm. c Immunoblotting analysis and quantification of indicated proteins in the hippocampus of APP/PS1 mice microinjected with AAV-sh-Con/AAV-sh-ROCK1. n = 3. d Immunoblotting of cytoplasmic and nuclear TFEB. n = 3. e Transmission electron microscopy of lysosomes in the hippocampus. Number of lysosomes was analyzed. n = 9 slices from 3 mice. Scale bar, 2 μm. White arrows indicate lysosomes. f, g Immunostaining of Aβ (red) and CD68 (green) in the hippocampus of APP/PS1 mice microinjected with AAV-sh-Con/AAV-sh-ROCK1, and co-localization coefficient for Aβ and CD68. n = 3. Scale bar, 50 μm. h qRT-PCR analysis of expression of indicated mRNAs. n = 3. *P < 0.05, **P < 0.01, ***P < 0.001 versus APP/PS1-AAV-sh-Con group, Student’s t-test
Fig. 7
Fig. 7
Knockdown of ROCK1 improves AD pathology and ameliorates cognitive decline in APP/PS1 mice. a Confocal images showing DAPI (blue) for nuclei and NAB228 (red) for Aβ in the hippocampus of APP/PS1 mice microinjected with AAV-sh-Con/AAV-sh-ROCK1. n = 4. Scale bar, 200 μm. be ELISA analysis of levels of soluble Aβ40 (b), soluble Aβ42 (c), insoluble Aβ40 (d) and insoluble Aβ42 (e) in the hippocampus of APP/PS1 mice microinjected with AAV-sh-Con or AAV-sh-ROCK1. n = 4. f Representative immunofluorescence images and quantification of GFAP (left) and Iba-1 (right) in the hippocampus. n = 4. Scale bars, 50 μm. g Y maze spontaneous alternation after microinjection with AAV-sh-Con/AAV-sh-ROCK1. n = 7. h Object recognition index in the NOR test. n = 7. i Escape latency in the Barnes maze during the training phase. n = 7. j, k Errors (j) and escape latency (k) in the Barnes maze trials. n = 6–7. af, *P < 0.05, **P < 0.01, ***P < 0.001 versus APP/PS1-AAV-sh-Con group, Student’s t-test. gk, *P < 0.05, **P < 0.01, ***P < 0.001 vs WT-AAV-sh-Con group, #P < 0.05, ###P < 0.001 versus APP/PS1-AAV-sh-Con group. Two-way ANOVA test followed by Tukey’s comparisons

Similar articles

Cited by

References

    1. Lawrence RE, Zoncu R. The lysosome as a cellular centre for signalling, metabolism and quality control. Nat Cell Biol. 2019;21(2):133–42. - PubMed
    1. Bonam SR, Wang F, Muller S. Lysosomes as a therapeutic target. Nat Rev Drug Discov. 2019;18(12):923–48. - PMC - PubMed
    1. Lee JH, Yang DS, Goulbourne CN, Im E, Stavrides P, Pensalfini A, et al. Faulty autolysosome acidification in Alzheimer’s disease mouse models induces autophagic build-up of Aβ in neurons, yielding senile plaques. Nat Neurosci. 2022;25(6):688–701. - PMC - PubMed
    1. Lee JH, Nixon RA. Autolysosomal acidification failure as a primary driver of Alzheimer disease pathogenesis. Autophagy. 2022;18(11):2763–4. - PMC - PubMed
    1. Brase L, You SF, D’OliveiraAlbanus R, Del-Aguila JL, Dai Y, Novotny BC, et al. Single-nucleus RNA-sequencing of autosomal dominant Alzheimer disease and risk variant carriers. Nat Commun. 2023;14(1):2314. - PMC - PubMed

Publication types

MeSH terms

Substances

LinkOut - more resources