

Shifts in the spatiotemporal profile of inflammatory phenotypes of innate immune cells in the rat brain following acute intoxication with the organophosphate diisopropylfluorophosphate
- PMID: 39497181
- PMCID: PMC11533402
- DOI: 10.1186/s12974-024-03272-8
Shifts in the spatiotemporal profile of inflammatory phenotypes of innate immune cells in the rat brain following acute intoxication with the organophosphate diisopropylfluorophosphate
Abstract
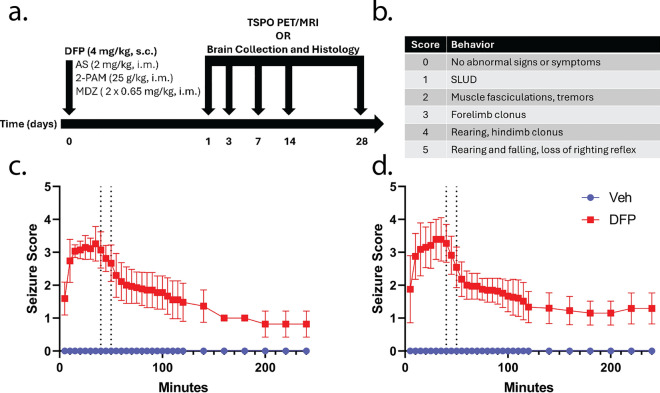
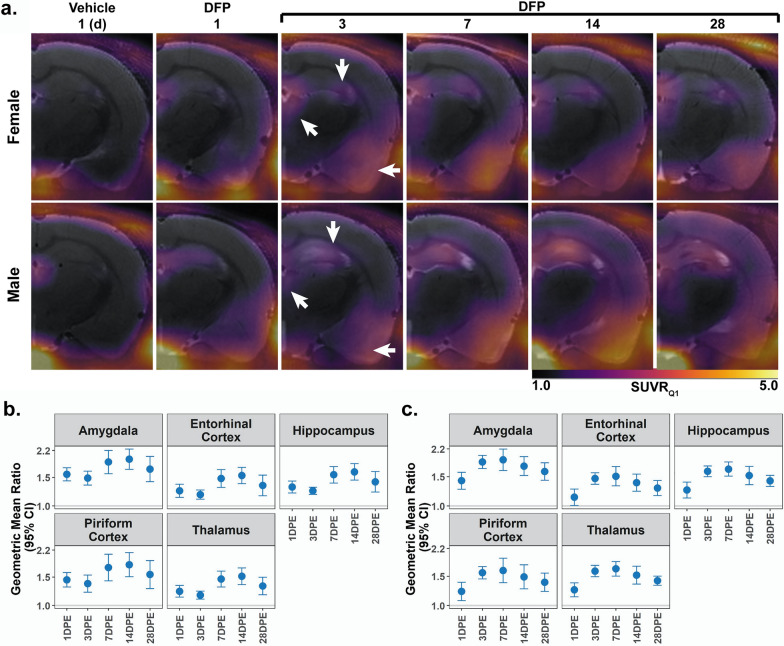
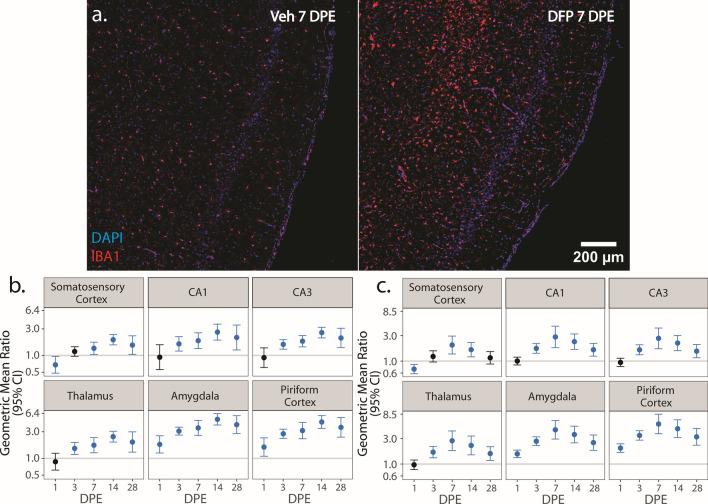
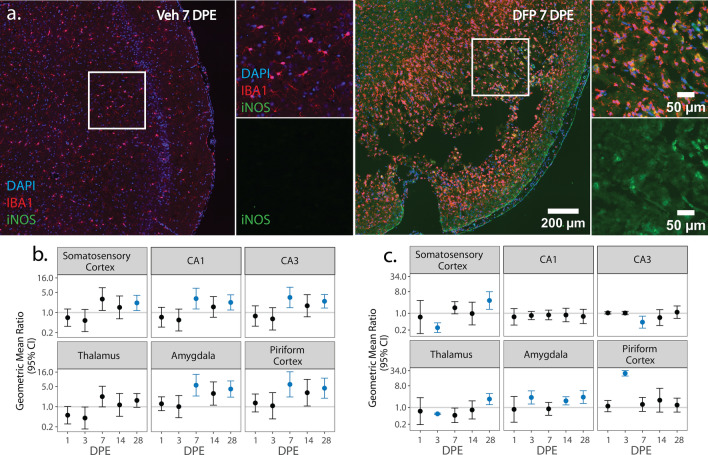
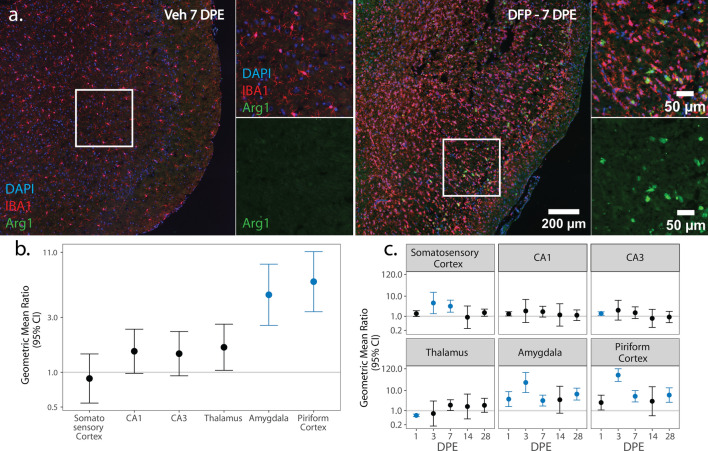
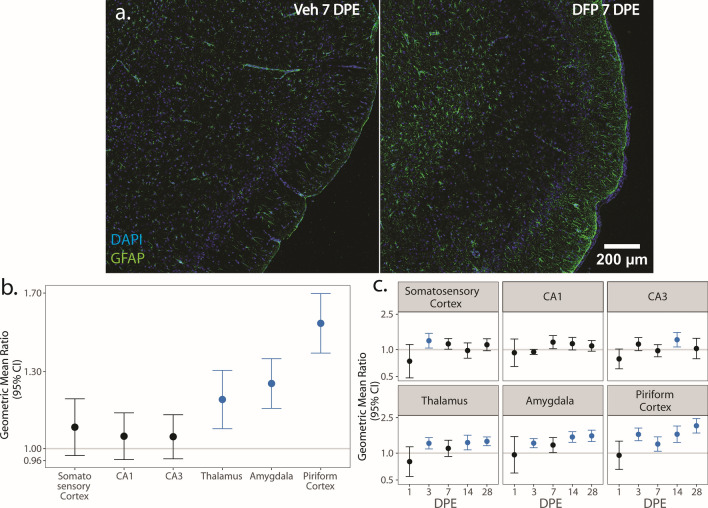
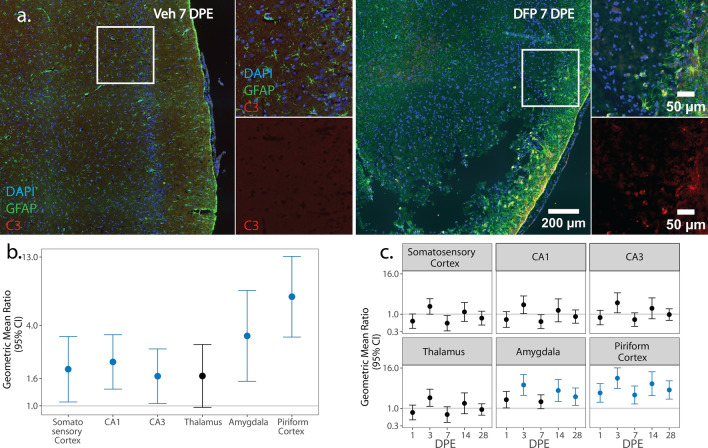
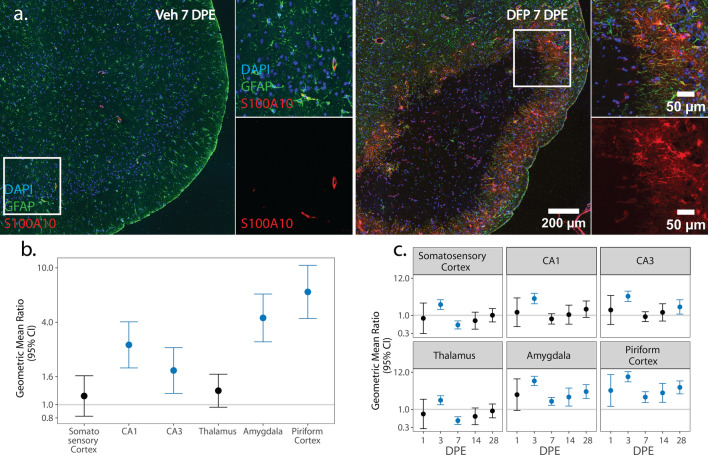
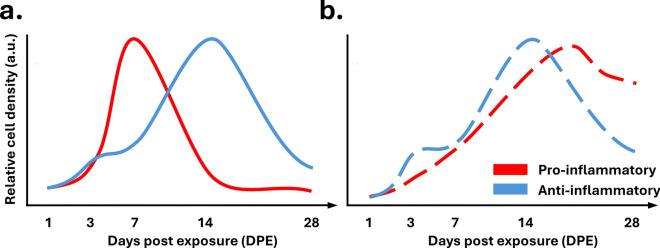
Acute intoxication with cholinesterase inhibiting organophosphates (OP) can produce life-threatening cholinergic crisis and status epilepticus (SE). Survivors often develop long-term neurological consequences, including spontaneous recurrent seizures (SRS) and impaired cognition. Numerous studies implicate OP-induced neuroinflammation as a pathogenic mechanism contributing to these chronic sequelae; however, little is known about the inflammatory phenotype of innate immune cells in the brain following acute OP intoxication. Thus, the aim of this study was to characterize the natural history of microglial and astrocytic inflammatory phenotypes following acute intoxication with the OP, diisopropylfluorophosphate (DFP). Adult male and female Sprague-Dawley rats were administered a single dose of DFP (4 mg/kg, sc) followed by standard medical countermeasures. Within minutes, animals developed benzodiazepine-resistant SE as determined by monitoring seizures using a modified Racine scale. At 1, 3, 7, 14, and 28 d post-exposure (DPE), neuroinflammation was assessed using translocator protein (TSPO) positron emission tomography (PET) and magnetic resonance imaging (MRI). In both sexes, we observed consistently elevated radiotracer uptake across all examined brain regions and time points. A separate group of animals was euthanized at these same time points to collect tissues for immunohistochemical analyses. Colocalization of IBA-1, a marker for microglia, with iNOS or Arg1 was used to identify pro- and anti-inflammatory microglia, respectively; colocalization of GFAP, a marker for astrocytes, with C3 or S100A10, pro- and anti-inflammatory astrocytes, respectively. We observed shifts in the inflammatory profiles of microglia and astrocyte populations during the first month post-intoxication, largely in hyperintense inflammatory lesions in the piriform cortex and amygdala regions. In these areas, iNOS+ proinflammatory microglial cell density peaked at 3 and 7 DPE, while anti-inflammatory Arg1+ microglia cell density peaked at 14 DPE. Pro- and anti-inflammatory astrocytes emerged within 7 DPE, and roughly equal ratios of C3+ pro-inflammatory and S100A10+ anti-inflammatory astrocytes persisted at 28 DPE. In summary, microglia and astrocytes adopted mixed inflammatory phenotypes post-OP intoxication, which evolved over one month post exposure. These activated cell populations were most prominent in the piriform and amygdala areas and were more abundant in males compared to females. The temporal relationship between microglial and astrocytic responses suggests that initial microglial activity may influence delayed, persistent astrocytic responses. Further, our findings identify putative windows for inhibition of OP-induced neuroinflammatory responses in both sexes to evaluate the therapeutic benefit of anti-inflammation in this context.
Keywords: Astrocytes; Microglia; Nerve agent; Pesticide; Seizures; Status epilepticus.
© 2024. The Author(s).
Conflict of interest statement
The authors declare no competing interests.
Figures
Similar articles
-
Persistent neuroinflammation and cognitive impairment in a rat model of acute diisopropylfluorophosphate intoxication.J Neuroinflammation. 2016 Oct 12;13(1):267. doi: 10.1186/s12974-016-0744-y. J Neuroinflammation. 2016. PMID: 27733171 Free PMC article.
-
A longitudinal MRI and TSPO PET-based investigation of brain region-specific neuroprotection by diazepam versus midazolam following organophosphate-induced seizures.Neuropharmacology. 2024 Jun 15;251:109918. doi: 10.1016/j.neuropharm.2024.109918. Epub 2024 Mar 24. Neuropharmacology. 2024. PMID: 38527652 Free PMC article.
-
Microglia Remodelling and Neuroinflammation Parallel Neuronal Hyperactivation Following Acute Organophosphate Poisoning.Int J Mol Sci. 2022 Jul 26;23(15):8240. doi: 10.3390/ijms23158240. Int J Mol Sci. 2022. PMID: 35897817 Free PMC article.
-
Persistent behavior deficits, neuroinflammation, and oxidative stress in a rat model of acute organophosphate intoxication.Neurobiol Dis. 2020 Jan;133:104431. doi: 10.1016/j.nbd.2019.03.019. Epub 2019 Mar 21. Neurobiol Dis. 2020. PMID: 30905768 Free PMC article. Review.
-
Evidence Implicating Blood-Brain Barrier Impairment in the Pathogenesis of Acquired Epilepsy following Acute Organophosphate Intoxication.J Pharmacol Exp Ther. 2024 Jan 17;388(2):301-312. doi: 10.1124/jpet.123.001836. J Pharmacol Exp Ther. 2024. PMID: 37827702 Free PMC article. Review.
Cited by
-
Naringenin's Neuroprotective Effect on Diazino-Induced Cerebellar Damage in Male Albino Rats, with Modulation of Acetylcholinesterase.Brain Sci. 2025 Feb 25;15(3):242. doi: 10.3390/brainsci15030242. Brain Sci. 2025. PMID: 40149763 Free PMC article.
References
-
- Soreq H, Seidman S. Acetylcholinesterase—new roles for an old actor. Nat Rev Neurosci. 2001;2(4):294–302. - PubMed
-
- Morris CM, Savy C, Judge SJ, Blain PG. Acute toxicity of organophosphorus compounds. In: Balali-Mood M, Abdollahi M, editors. Basic and clinical toxicology of organophosphorus compounds. Berlin: Springer; 2014.
-
- McDonough JH, Shih TM. Neuropharmacological mechanisms of nerve agent-induced seizure and neuropathology. Neurosci Biobehav Rev. 1997;21:559–79. - PubMed
-
- Chen Y. Organophosphate-induced brain damage: mechanisms, neuropsychiatric and neurological consequences, and potential therapeutic strategies. Neurotoxicology. 2012;33(3):391–400. - PubMed
MeSH terms
Substances
Grants and funding
- Lodric Maddox Graduate Fellowship/School of Veterinary Medicine, University of California, Davis
- UL1 TR001860/TR/NCATS NIH HHS/United States
- S10 OD030440/OD/NIH HHS/United States
- S10 OD030440/CD/ODCDC CDC HHS/United States
- 2022-2023 Predoctoral Fellowship/Achievement Rewards for College Scientists Foundation
LinkOut - more resources
Full Text Sources
Research Materials
Miscellaneous
