. 2024 Jan-Dec:23:15330338241293485.
doi: 10.1177/15330338241293485.

Single-Cell Transcriptomics Reveals STAT1 Drives LHPP Downregulation in Esophageal Squamous Cell Carcinoma Progression

Affiliations

Single-Cell Transcriptomics Reveals STAT1 Drives LHPP Downregulation in Esophageal Squamous Cell Carcinoma Progression

Xia Chen et al. Technol Cancer Res Treat. 2024 Jan-Dec.

Abstract

Background: Esophageal Squamous Cell Carcinoma (ESCC) poses a significant health challenge in China due to its high incidence and mortality. Single-cell transcriptomics has transformed the approach to cancer research, allowing detailed analysis of cellular and molecular heterogeneity. The interaction between the transcription factor STAT1 and the tumor suppressor LHPP is crucial, potentially influencing cancer progression and therapeutic outcomes.

Objective: This study aims to explore the molecular mechanisms and cellular dynamics underlying ESCC, with a focus on the role of transcription factors, particularly STAT1, and its regulatory relationship with LHPP, in the pathogenesis of ESCC.

Methods: Utilizing single-cell transcriptomics data sourced from the public database GEO (GSE160269), we identified major cell types and their transcriptomic changes in ESCC patients. Differential gene expression profiles were examined to understand the dynamics of the tumor microenvironment (TME). A cohort of 21 ESCC patients was recruited to validate the findings. Furthermore, in ESCC cell lines, we validated the transcriptional regulatory relationship between STAT1 and LHPP.

Results: Our analysis identified six major cell types within the ESCC microenvironment, revealing significant changes in cellular composition and gene expression profiles associated with tumorigenesis. Notably, a novel association between STAT1's regulatory role over LHPP was observed, suggesting a complex regulatory loop in ESCC pathogenesis. Elevated STAT1 and reduced LHPP expression were confirmed in patient samples with STAT1 negatively regulates LHPP expression at the promoter level; when the promoter binding motif regions were mutated, the transcriptional repression ability on LHPP was weakened.

Conclusion: The study highlights STAT1 as a core regulator in ESCC, directly influencing LHPP expression. The findings offer novel insights into the molecular mechanisms driving ESCC, shedding light on the cellular alterations and gene regulation dynamics within the ESCC microenvironment. This research provides a foundation for developing targeted therapeutic strategies, potentially utilizing the STAT1-LHPP axis as a focal point in ESCC treatment and prognosis.

Keywords: esophageal squamous cell carcinoma; signal transducer and activator of transcription 1; single-cell trascriptomics; tumor microenvironment.


Conflict of interest statement

Declaration of Conflicting InterestsThe authors declared no potential conflicts of interest with respect to the research, authorship, and/or publication of this article.

Figures

Figure 1.
Figure 1.
Diversity of cell types identified by scRNA-seq analysis. (A) Umap plot showing different cell types (left) and samples distribution (right) in ESCC tissues. (B) Dot plot showing the gene expression signatures of the classic marker genes of each cell type. (C) Umap plots showing the expression profiles of indicated cell-type-specific marker genes. The color key from gray to red indicates low to high gene expression levels. Epithelial cells (AOC1), endothelial cells (PECAM1), fibroblast cells (PDGFRA), myeloid immune cells (CD14), T cells (CD3D) and B cells (CD39). (D) Heatmap showing the gene expression signatures of the top 50 cell-type-specific marker genes for each cell type, with corresponding functional annotations on the right. The color key from blue to red represents low to high gene expression levels. (E) Bar plot showing the cell proportion distribution of each cell type in healthy and tumor tissues. (F) Bar plot showing the fold change level of cell proportion during lesion.
Figure 2.
Figure 2.
Changes in the transcriptional profiles of different cell types during tumor genesis. (A) Chord plot showing the distribution of upregulated DEGs for each cell type between healthy and tumor groups (tumor/healthy). (B) Heatmap showing the gene function annotations of upregulated DEGs. (C) Ring heatmap showing the top 100 upregulated DEGs during tumor genesis. (D) Chord plot showing the distribution of downregulated DEGs for each cell type between healthy and tumor groups (tumor/healthy). (E) Heatmap showing the gene function annotations of downregulated DEGs. (F) Ring heatmap showing the top 100 downregulated DEGs during tumor genesis. (G) Network diagram depicting interactions among cell types within the ESCC tumor microenvironment. Red lines represent increased interactions, and blue lines represent decreased interactions compared to normal tissue. (H) Bar graph displaying the relative interaction flow between various signaling pathways in tumor (red) and normal (blue) tissues. Pathways are ordered by their interaction flow in the tumor environment.
Figure 3.
Figure 3.
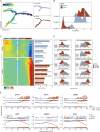
The cellular and molecular dynamics of endothelial cells during tumor genesis. (A) Pseudotime trajectory analysis of ESCC. Left, pseudotime scores of ESCC. Top right, the distribution of ESCCs in healthy group. Bottom right, the distribution of ESCCs in tumor group. (B) Ridge plot showing the cell number distribution of healthy and tumor ESCC along pseudotime trajectory of Figure 3A. (C) Heatmap showing the time-related gene expression profiles during tumor genesis, with gene function annotation on the right. (D) Ridge plots showing the expression score of gene set from different clusters in Figure 3C of healthy and tumor groups, with gray for cell fate1, blue for cell fate2 and red for cell fate3. (E) Scatter plots and trajectory plots showing the expression level of top genes in Figure 3C, with blue for normal tissue and red for tumor tissue.
Figure 4.
Figure 4.
STAT1 was identified as a core regulator for ESCC. (A) Volcano plot showing the DEGs distribution in rescue, with red for upregulated DEGs and blue for downregulated DEGs. (B) Venn plot showing the overlap between DEGs in scRNA-seq data and public ESCC data. (C) The correlation between the expression levels of LHPP with STAT1 in epithelial cells from scRNA-seq data. (D) The correlation between the expression levels of LHPP with PPARA in epithelial cells from scRNA-seq data. (E) The relative mRNA levels of STAT1, MMP9, LHPP and PCK1 were detected in 21 paired ESCC patient tissues.
Figure 5.
Figure 5.
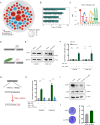
STAT1 negatively regulates LHPP expression in ESCC cell lines. (A) Network diagram of transcription factors showing the interactions between the upregulated transcription factors (red), downregulated transcription factors (blue), and their target differentially expressed genes represented by gray dots. The size of each dot corresponds to the number of target genes associated with each transcription factor, indicating the scale of their regulatory impact. (B) Bar plot showing enrichment analysis of pathways containing STAT1 target genes that include LHPP. (C) Representation predicted binding motif of STAT1. (D) Schematic Representation of the LHPP Promoter Activity Assay. (E) Western blot analysis displaying the overexpression levels of STAT1 proteins in EC9706 and KYSE-150. GAPDH serves as a loading control. (F) Luciferase reporter assay results showing the effect of STAT1 on the LHPP promoter activity in EC9706 and KYSE-150. n = 3 biological replicates. (G) LHPP promoter mutation analysis highlighting a specific sequence mutation from CTCTGGGAAG to CTCTGGCCCG. (H) Luciferase reporter assays illustrating the lack of suppressive activity in promoter Mutation compared to the wild-type promoter in the presence of STAT1. n = 3 biological replicates. (I) Western blot analysis demonstrating the protein expression levels of STAT1 and LHPP following siRNA-mediated knockdown in KYSE-150. GAPDH serves as a loading control. (J) Colony formation assays quantifying the proliferative capacity of KYSE-150 subjected to siRNA-mediated knockdown by si-LHPP compared to non-targeting control (siNC). n = 3 biological replicates.

References

    1. Hanahan D, Weinberg RA. Hallmarks of cancer: The next generation. Cell. 2011;144(5):646-674. - PubMed
    1. Siegel RL, Miller KD, Jemal A. Cancer statistics, 2020. CA Cancer J Clin. 2020;70(1):7-30. - PubMed
    1. Morgan E, Soerjomataram I, Rumgay H, et al. The global landscape of esophageal squamous cell carcinoma and esophageal adenocarcinoma incidence and mortality in 2020 and projections to 2040: New estimates from GLOBOCAN 2020. Gastroenterology. 2022;163(3):649-658. e2. - PubMed
    1. Sheikh M, Roshandel G, McCormack V, Malekzadeh R. Current status and future prospects for esophageal cancer. Cancers (Basel). 2023;15(3):765. - PMC - PubMed
    1. Bray F, Ferlay J, Soerjomataram I, Siegel RL, Torre LA, Jemal A. Global cancer statistics 2018: GLOBOCAN estimates of incidence and mortality worldwide for 36 cancers in 185 countries. CA Cancer J Clin. 2018;68(6):394-424. - PubMed

MeSH terms