. 2024 Dec 1;110(12):7546-7562.
doi: 10.1097/JS9.0000000000002119.

Shock wave-pretreated ADMSCs of cell-sheet scaffold (CSS) patched on the left ventricular wall (LVW) inhibited LVW remodeling in mini-pig MI: role of CSS on counteracting Laplace's Law of LVW stress - experimental study

Affiliations

Shock wave-pretreated ADMSCs of cell-sheet scaffold (CSS) patched on the left ventricular wall (LVW) inhibited LVW remodeling in mini-pig MI: role of CSS on counteracting Laplace's Law of LVW stress - experimental study

Jiunn-Jye Sheu et al. Int J Surg. .

Abstract

Background: We investigated whether shock wave (SW)-pretreated autologous adipocyte-derived mesenchymal stem cells (ADMSCs) seeded in the cell-sheet scaffold (CSS) could inhibit left ventricular (LV) remodeling and improve LV ejection fraction (LVEF) in old myocardial infarction (MI).

Methods: Mini-pigs ( n =20) were divided into group 1 (sham-operated control), group 2 (old MI), group 3 (old MI + autologous ADMSCs/1.0×10 7 in CSS on LV myocardium), and group 4 [old MI + SW (0.12 mJ/mm 2 for total 140 shots)-pretreated ADMSCs in CSS on LV myocardium]. Treatments started on day 28 after MI induction. In-vivo and in-vitro studies were conducted.

Results: Cell viability/relative mitochondria DNA expression/mitochondrial cytochrome C/adenosine triphosphate concentration in ADMCSs and protein expressions of angiogenesis factors [vascular endothelial growth factor (VEGF)/stromal cell-derived factor-1 (SDF-1)/mitochondrial respiratory chain complexes I-IV/oxygen consumption rate] were higher in group 4 than in group 3 ( P <0.001). By day 180, LVEF and small vessel numbers in the peri-infarct or infarct area were highest in group 1, lowest in group 2, and significantly lower in group 3 than in group 4. In contrast, the LV dimension was opposite to the pattern of change in LVEF in all groups ( P <0.0001). The basal/middle/apical infarct and fibrotic areas were inversely related to LVEF in all groups (all P <0.0001). Protein levels of angiogenetic markers (SDF-1α/C-X-C chemokine receptor type 4/VEGF/angiopoietin-1) were significantly and persistently increased from groups 1 to 4. In contrast, protein levels of endothelial cell markers (von Willebrand factor or endothelial nitric oxide synthase) showed an identical pattern to LVEF in all groups (all P <0.0001).

Conclusion: SW pretreatment of ADMSCs seeded in CSS offered significant benefits in preserving LV performance and ameliorating LV remodeling in mini-pigs with old MI.


Conflict of interest statement

The authors declare no conflicts of interest.

Sponsorships or competing interests that may be relevant to content are disclosed at the end of this article.

Figures
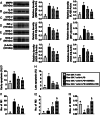
Figure 1
Figure 1
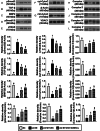
Effect of SW and ADMSCs on alleviating inflammation, oxidative stress and apoptosis. (A) Western blot result of MMP-9, * versus other groups with different symbols (†, ‡, §), P<0.0001. (B) Western blot result of interleukin (IL)-6, * versus other groups with different symbols (†, ‡, δ), P<0.0001. (C) Western blot result of COX-2, * versus other groups with different symbols (†, ‡, §), P<0.0001. (D) Western blot result of interferon (IFN)-γ, * versus other groups with different symbols (†, ‡, §), P<0.0001. (E) Western blot result of NOX-1, * versus other groups with different symbols (†, ‡, §), P<0.0001. (F) Western blot result of NOX-2, * versus other groups with different symbols (†, ‡, §), P<0.0001. (G) Flow cytometric assessment of early (AN-V+/PI) apoptosis, * versus other groups with different symbols (†, ‡, §), P<0.0001. (H) Flow cytometric assessment of late (AN-V+/PI+) apoptosis, * versus other groups with different symbols (†, ‡, §), P<0.0001. (I-1) Number of M1 surface expression in Raw 264.7 Cells, * versus other groups with different symbols (†, ‡, §), P<0.0001. (I-2) Number of M2 surface expression in Raw 264.7 Cells, * versus other groups with different symbols (†, ‡, §), P<0.0001. (I-3) Ratio of M2/M1, * versus other groups with different symbols (†, ‡, §), P<0.0001. All statistical analyses were performed by one-way ANOVA, followed by Bonferroni multiple-comparison post hoc test (n = 6 for each group). Symbols (*, †, ‡, §) express significance for each other (at 0.05 level). ADMSCs, adipose-derived mesenchymal stem cells; LPS, lipopolysaccharide; SW, shock wave.
Figure 2
Figure 2
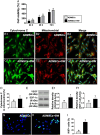
SW treatment augmented cell proliferation ability, number of mitochondrial cytochrome C, and angiogenesis biomarkers in ADMSCs. (A) Cell viability at 24 h, * versus †, P<0.0001. (B) Cell viability at 48 h, ‡ versus §, P<0.0001. (C) Cell viability at 72 h, ¶ versus δ, P<0.00001. Note that the repeated measures ANOVA was adopted to analyze cell variability at different time points. (D1–D3 and E1–E3) Showing the immunofluorescent microscopic finding (400×) for identifying the expression of mitochondrial cytochrome C (red-green color in the merged picture). (D1 and E1) Indicated the cytochrome C stain (green color); (D2 and E2) Indicated mitochondrial stain (red color); (D3 and E3) Indicated the merged picture of A and B (red-green color). (F) The percentage (%) of positively stained cytochrome C in mitochondria, * versus †, P<0.0001. (G) Western blot analysis of VEGF, * versus †, P<0.0001. (H) Western blot analysis of SDF-1α, * versus †, P<0.0001. n=6 in each group. (I and J) Demonstrating the IF microscopic finding (400×) for identifying the cellular expression of Ki68 (green color). (K) Analytical result of the number of Ki67+ cells, * versus †, P<0.0001. n=4 in each group.
Figure 3
Figure 3
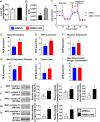
SW treatment augmented the expressions of relative mitochondrial DNA (mtDNA), ATP concentration, mitochondrial bioenergetics, and expressions of respiratory chain complexes in the ADMSCs. (A) Level of relative mtDNA, * versus †, P<0.0001. (B) The ATP concentration, * versus †, P<0.0001. (C to I) Changes in mitochondrial respiration of ADMSCs with and without SW treatment. (C) Indicated mitochondria respiration reflected by the level of oxygen consumption rate (OCR) in B1 and B2, following the injection of oligomycin, FCCP, and antimycin A/rotenone (Back. corr. = Background correction). (D) The rates of basal respiration, (E) ATP production, (F) maximal respiration, (G) spare respiratory capacity (n=4 per group), and (H) protein leakage, respectively; * versus †, all P<0.001. (I) Non-mitochondrial oxygen consumption, P>0.5. (J) Western blot analysis of mitochondria respiratory chain (MRC) complex I, * versus †, all P<0.0001. (K) Protein expression of MRC complex II, * versus †, all P<0.0001. (L) Protein expression of MRC complex III, * versus †, all P<0.0001. (M) Western blot analysis of MRC complex IV, * versus †, all P<0.0001. (N) Western blot analysis of MRC complex V, * versus †, all P<0.0001. n=3 in each group.
Figure 4
Figure 4
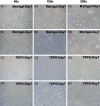
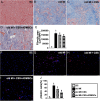
Comparison of the growth morphological feature of ADMSCs among the Matrigel, hyaluronic acid, and TSPG. (A1–A3) Illustrating the morphologic feature of ADMSCs after 24 h of culture in Matrigel culture plate, that is, at 40× (A1), 100× (A2), and 200× (A3), respectively. (B1–B3) Illustrating the morphologic feature (i.e. typical spindle shape) of ADMSCs after 7 days culture in Matrigel culture plate, that is, at 40× (B1), 100× (B2), and 200× (B3), respectively. (C1–C3) Illustrating the morphologic feature of ADMSCs after 24 h of culture in TSPG culture plate, that is, at 40× (C1), 100× (C2), and 200× (C3), respectively. (D1–D3) Illustrating the morphologic feature (i.e. typical spindle shape) of ADMSCs after 7 days of culture in TSPG culture plate, that is, at 40× (D1), 100× (D2), and 200× (D3), respectively. TSPG, temperature-sensitive plasticity gel.
Figure 5
Figure 5
MTT assay for infarcted size, identifications of thickness of the wall, internal LV chamber size in infarcted zone, and histological finding of cross-section infarct areas in infarcted and peri-infarcted zones by 180th day after AMI induction. (A1–A4) Illustrating the MTT assay to identify the infarct area at the apical (yellow dotted line). (A5) Analyzed result of the infarcted area at apical level, * versus other groups with different symbols (†, ‡, §), P<0.0001. (B1–B4) Illustrating the MTT assessment for clarification of the infarcted area at the middle level (yellow dotted line). (B5) Analyzed result of the infarcted area at the middle level, * versus other groups with different symbols (†, ‡, §), P<0.0001. (C1–C4) Illustrating the MTT examination for clarifying infarcted area at basal level (yellow dotted line). (C5) Analyzed result of the infarcted area at the basal level, * versus other groups with different symbols (†, ‡, §), P<0.0001. (D1–D4) Showing the morphological feature of internal chamber size at the middle level of the left ventricle. (D5) Analysis of internal chamber area, * versus other groups with different symbols (†, ‡, §), P<0.0001. (D6) Analysis of the wall thickness at the middle level of the infarcted zone, * versus other groups with different symbols (†, ‡, §), P<0.0001. (E1–E4) Microscopic analysis (20×) of H&E stain for clarification of infarcted area (yellow dotted line). (E5) Analysis of infarct area, * versus other groups with different symbols (†, ‡, §), P<0.0001. (F1– F4) Microscopic finding (200×) of H&E stain for clarification of peri-infarct area (yellow dotted line). (F5) Analysis of peri-infarct area, * versus other groups with different symbols (†, ‡, §), P<0.0001. The scale bars in lower right corner represent 50 μm. n = 5 for each group. Symbols (*, †, ‡, §) express significance (at 0.05 level). ADMSCs, adipose-derived mesenchymal stem cells; CSS, cell-sheet scaffold; MI, myocardial infarct; SC, sham control.
Figure 6
Figure 6
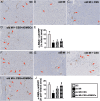
Vessel density in infarcted and peri-infarcted areas and apoptotic nuclei in the infarcted area by 180th day after AMI induction. (A–D) Microscopic finding (200×) of α-SMA stain for identification of small vessels in infarct area (red arrow). (E) Analysis of the number of small vessels (defined as ≤25.0 μM) in infarct area, * versus other groups with different symbols (†, ‡, §), P<0.0001. (F–I) Microscopic finding (200×) of α-SMA stain for clarification of small vessels in peri-infarct area (red arrow). (E) Analysis of a number of small vessels (defined as ≤25.0 μM) in peri-infarct area, * versus other groups with different symbols (†, ‡, §), P<0.0001. The scale bars in lower right corner represent 50 μm. n=5 for each group. Symbols (*, †, ‡, §) express significance (at 0.05 level). CSS, cell-sheet scaffold; MI, myocardial infarct.
Figure 7
Figure 7
Fibrosis area and DNA-damaged marker in the infarcted area by 180th day after AMI induction. (A–D) Illustrating the microscopic finding (200×) of Masson’s trichrome stain for clarification of fibrosis area (blue area). (E) Analytical result of fibrotic area, * versus other groups with different symbols (†, ‡, §), P<0.0001. (F– I) Demonstrating the IF microscopic finding (200×) for identifying the positively stained γ-HA2X cells (pink color). (J) Analysis of γ-HA2X+ cells, * versus other groups with different symbols (†, ‡, §), P<0.0001. The scale bars in lower right corner represent 50 μm. n=5 for each group. Symbols (*, †, ‡, §) express significance (at 0.05 level). CSS, cell-sheet scaffold; MI, myocardial infarct.
Figure 8
Figure 8
Protein levels of angiogenesis factors and integrity of endothelial cell biomarkers in the peri-infarcted area by 180th day after AMI induction. (A) Protein level of SDF-1α, * versus other groups with different symbols (†, ‡, §), P<0.0001. (B) Protein level of CXCR4, * versus other groups with different symbols (†, ‡, §), P<0.0001. (C) Protein level of VEGF, * versus other groups with different symbols (†, ‡, §), P<0.0001. (D) Protein level of angiopoetin-1, * versus other groups with different symbols (†, ‡, §), P<0.0001. (E) Protein level of von Willebrand factor (vWF), * versus other groups with different symbols (†, ‡, §), P<0.0001. (F) Protein level of eNOS, * versus other groups with different symbols (†, ‡, §), P<0.0001. n=5 for each group. Symbols (*, †, ‡, §) express significance (at 0.05 level).
Figure 9
Figure 9
Protein expressions of apoptotic, fibrotic and mitochondrial and DNA-damaged biomarkers, and complexes I–IV in peri-infarcted area by 180th day after AMI induction. (A) Protein level of Smad3, * versus other groups with different symbols (†, ‡, §), P<0.0001. (B) Protein level TGF-β, * versus other groups with different symbols (†, ‡, §), P<0.0001. (C) Protein level of bone morphogenic protein (BMP)2, * versus other groups with different symbols (†, ‡, §), P<0.0001. (D) Protein level of Smad1/5, * versus other groups with different symbols (†, ‡, §), P<0.0001. (E) Protein level of γ-H2AX, * versus other groups with different symbols (†, ‡, §), P<0.0001. (F) Protein level of cytosolic cytochrome C (cyt-CytoC), * versus other groups with different symbols (†, ‡, §), P<0.0001. (G) Protein level of mitochondrial cytochrome C (mit-CytoC), * versus other groups with different symbols (†, ‡, §), P<0.0001. (H) Protein level of complex I, * versus other groups with different symbols (†, ‡, §), P<0.0001. (I) Protein level of complex II, * versus other groups with different symbols (†, ‡, §), P<0.0001. (J) Protein level of complex III, * versus other groups with different symbols (†, ‡, §), P<0.0001. (K) Protein level of complex IV, * versus other groups with different symbols (†, ‡, §), P<0.0001. (L) Protein level of complex V, * versus other groups with different symbols (†, ‡, §), P<0.0001. n=5 for each group. Symbols (*, †, ‡, §) indicate significance (at 0.05 level).
Figure 10
Figure 10
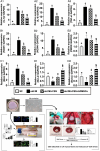
qPCR analyses of inflammation, oxidative stress, apoptosis, and anti-apoptosis in the peri-infarcted area by 180th day and proposed mechanism of SW-pretreated ADMSCs seeded in CSS patched on LV wall for attenuating LVWSF and improving heart function in MI pig. (A1) Relative gene expression of interleukin (IL)-1β, * versus other groups with different symbols (†, ‡, §), P<0.0001. (A2) Relative gene expression of IL-6, * versus other groups with different symbols (†, ‡, §), P<0.0001. (A3) Relative gene expression of tumor necrosis factor (TNF)-α, * versus other groups with different symbols (†, ‡, §), P<0.0001. (B1) Relative gene expressions of NOX-1, * versus other groups with different symbols (†, ‡, §), P<0.0001. (B2) Relative gene expression of NO-4, * versus other groups with different symbols (†, ‡, §), P<0.0001. (B3) Relative gene expression of FMO2 (flavin-containing dimethylaniline monooxygenase 2), * versus other groups with different symbols (†, ‡, §), P<0.0001. (C1) Relative gene expression of Bim, * versus other groups with different symbols (†, ‡, §), P<0.0001. (D1) Relative gene expression of Bcl-2, * versus other groups with different symbols (†, ‡, §), P<0.0001. (D2) Relative gene expression of Bcl-xL, * versus other groups with different symbols (†, ‡, §), P<0.0001. n = 5 for each group. ADMSCs, adipose-derived mesenchymal stem cells; CSS, cell-sheet scaffold; LV, left ventricular; LVWSF, LV wall stress force; MI, myocardial infarction; TSPG, temperature-sensitive plasticity gel; SW, shock wave. (E) Illustrating during suturing of SSC on LV wall. White arrows indicate the CSS with white color. (F) Illustrating the complete suture and the suture lines (green arrowheads) for firmly fixing the CSS on the LV-free wall can be clearly identified. (G) Demonstrating the gross anatomical morphology of the heart by the 180th day after IM induction. The CSS on the completely absorbed LV-free wall can be clearly identified.

References

    1. Nordlander R, Nyquist O. Mortality, arrhythmias and pump failure in acute myocardial infarction in relation to estimated infarct size. Acta Med Scand 1979;206:65–71. - PubMed
    1. Erlebacher JA, Weiss JL, Weisfeldt ML, et al. . Early dilation of the infarcted segment in acute transmural myocardial infarction: role of infarct expansion in acute left ventricular enlargement. J Am Coll Cardiol 1984;4:201–208. - PubMed
    1. Pfeffer MA, Lamas GA, Vaughan DE, et al. . Effect of captopril on progressive ventricular dilatation after anterior myocardial infarction. N Engl J Med 1988;319:80–86. - PubMed
    1. Pfeffer MA, Braunwald E, Moye LA, et al. . Effect of captopril on mortality and morbidity in patients with left ventricular dysfunction after myocardial infarction. Results of the survival and ventricular enlargement trial. The SAVE Investigators. N Engl J Med 1992;327:669–677. - PubMed
    1. Mann DL. Mechanisms and models in heart failure: a combinatorial approach. Circulation 1999;100:999–1008. - PubMed