. 2024 Sep 29;10(20):e38181.
doi: 10.1016/j.heliyon.2024.e38181. eCollection 2024 Oct 30.

Quercetin activates autophagy in the distal ischemic area of random skin flaps through Beclin1 to enhance the adaptability to energy deficiency

Affiliations

Quercetin activates autophagy in the distal ischemic area of random skin flaps through Beclin1 to enhance the adaptability to energy deficiency

Xin Zheng et al. Heliyon. .

Abstract

Random flaps are frequently employed in treating substantial skin abnormalities and in surgical tissue-rebuilding interventions. The random flap technique provides flaps of specific dimensions and contours to fit the surgical incision. However, blood supply deficiency and subsequent ischemia-reperfusion injury can cause severe oxidative stress and apoptosis, eventually leading to distal necrosis, which limits the clinical application of the flap. Quercetin (QUE) is primarily found in the glycoside form in many plant parts, such as stem bark, flowers, leaves, buds, seeds, and fruits. Cellular, animal, and clinical studies have demonstrated the antioxidant, anti-apoptosis, anti-inflammatory, and activation of autophagy properties of QUE. In previous studies, high doses of QUE effectively suppressed the survival of human umbilical vein endothelial cells (HUVECs) stimulated by hydrogen peroxide. However, different concentration gradients of QUE on HUVECs revealed a significant protective effect at a concentration of 10 mM. The protective impact of QUE on HUVECs was evaluated using scratch tests, CCK-8 assays, and EDU assays. Simultaneously, a mouse model of random skin flap was created, and the impact of QUE on skin flap survival was examined by intragastric injection. The QUE group showed a significantly larger survival area of the random flap and higher blood flow intensity compared to the control group. Furthermore, the beneficial effects of QUE were reversed by the autophagy inhibitor 3-MA. Therefore, autophagy plays a significant role in the therapeutic benefits of QUE on flap survival.

Keywords: Angiogenesis; Autophagy; ERK; Quercetin; Random flaps.


Conflict of interest statement

All authors declare no conflict of interest.

Figures

Fig. 1
Fig. 1
|QUE enhanced the proliferation and migration of HUVECs following oxidative stress injury. (a) Cell viability of each cell. (b) Images of wound healing in the control, H2O2, H2O2+QUE and H2O2+QUE+3 MA groups. Images were captured at 0, 6, 12, and 24 h after the scratch. Magnification: 4×; scale: 400 μm. (c) Cell migration rate that were affected by the abovementioned factors for 6, 12, and 24 h (d) BrdU assay reveals the proliferation status of different groups of cells. Magnification: 10×; scale: 200 μm. (e) The statistical analysis of Edu-stained positive cells in the control group, H2O2 group, and H2O2+QUE group. (f) transwell assay demonstrates the migratory capacity of cells in different groups.(g)Migratory cell per field. Data were expressed as mean ± SD, n = 3. “∗”and“∗∗” represent p <0.05 or p <0.01 versus the H2O2 and QUE groups, indicating statistical significance. Magnification: 20×; scale: 100 μm.
Fig. 2
Fig. 2
|Systemic administration of QUE does not cause significant toxic damage. (a) H and E staining of the brain, kidneys, and spleen of mice in each group. Magnification: 10×; Scale bar 200 μm. (b) Blood biochemical test in each group. Data were expressed as mean ± SD, n = 3. n.s. represents no statistical significance.
Fig. 3
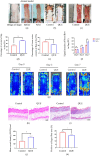
Fig. 3
|QUE could effectively enhance the random flap survival. (a) Photographs of the flap modeling area and visual images before and after vascular occlusion. (b) Photographs of flap survival area. (c) Photographs of flap edema area. (d) Chart of the percentage of the skin flap stock area in each group for 7 days. (e) Chart of the percentage of the skin flap edema area in each group for 7 days. (f) Statistical result of blood flow signal intensity at 0 days, 3 days and 7days. (g) LDBF technique reveals the subcutaneous blood flow status at 0, 3, and 7 days post-operation. (h) H and E staining images of the control and QUE groups. Magnification was × 10, Scale bar 200 μm. (i) Masson's trichrome stain images of each group showing blood vessels and collagen fibers. Magnification: 10×; Scale bar 200 μm. (j) Mean vessel density. (k) Positive collagen fiber area. Data were expressed as mean ± SD, n = 3. “∗”and“∗∗”represent p <0.05 or p <0.01 versus the QUE group, indicating statistical significance.
Fig. 4
Fig. 4
|Inhibition of autophagosome formation after QUE administration resulted in a decrease in the survival of random flaps. (a) Images reflecting flap survival at the seventh day after operation in the control group, treatment group with QUE, and treatment group with QUE+3 MA. (b) percentage of survival of flap on 7 day. (c) Images reflecting flap edema at the seventh day after operation in the control group, treatment group with QUE, and treatment group with QUE+3 MA. (d) Percentage of tissue water content of flap on 7 day. (e) Immunofluorescence showing the expression of CD34 (green), and DAPI (blue) in different groups. Magnification: 20×; Scale: 100 μm. (f) Mean fluorescence intensity of CD34 in different groups. (g) LDBF technique reveals the subcutaneous blood flow status at 7 days post-operation. (h) Statistical result of blood flow signal intensity at the seventh day. Scale: 0.5 cm. (i) H and E staining images of the control, QUE and QUE+3 MA groups. Magnification was × 10, Scale bar 400 μm. (j) Mean vessel density. (k) Western blot results showing the expression of VEGF, CD34 and MMP9 in different groups. (l–n) Quantitative analysis of VEGF, CD34 and MMP9 protein expressions. Data were expressed as mean ± SD, n = 3. “∗”and“∗∗”represent p <0.05 or p <0.01 versus the NT group, indicating statistical significance.
Fig. 4
Fig. 4
|Inhibition of autophagosome formation after QUE administration resulted in a decrease in the survival of random flaps. (a) Images reflecting flap survival at the seventh day after operation in the control group, treatment group with QUE, and treatment group with QUE+3 MA. (b) percentage of survival of flap on 7 day. (c) Images reflecting flap edema at the seventh day after operation in the control group, treatment group with QUE, and treatment group with QUE+3 MA. (d) Percentage of tissue water content of flap on 7 day. (e) Immunofluorescence showing the expression of CD34 (green), and DAPI (blue) in different groups. Magnification: 20×; Scale: 100 μm. (f) Mean fluorescence intensity of CD34 in different groups. (g) LDBF technique reveals the subcutaneous blood flow status at 7 days post-operation. (h) Statistical result of blood flow signal intensity at the seventh day. Scale: 0.5 cm. (i) H and E staining images of the control, QUE and QUE+3 MA groups. Magnification was × 10, Scale bar 400 μm. (j) Mean vessel density. (k) Western blot results showing the expression of VEGF, CD34 and MMP9 in different groups. (l–n) Quantitative analysis of VEGF, CD34 and MMP9 protein expressions. Data were expressed as mean ± SD, n = 3. “∗”and“∗∗”represent p <0.05 or p <0.01 versus the NT group, indicating statistical significance.
Fig. 5
Fig. 5
|Inhibition of autophagosome formation after QUE administration resulted in increased apoptosis levels of the random flap. (a) Immunofluorescence showing the expression of CASP3 (green), and DAPI(blue) in different groups. Magnification: 20×; Scale: 200 μm. (b) Western blot results showing the expression of Bcl-2, Bax and C-CASP3 in different groups. (c) Quantitative analysis of Bax protein expressions. (d) Mean fluorescence intensity of CASP3 in different groups. (e) Quantitative analysis of Bcl-2 protein expressions. (f) Quantitative analysis of C-CASP3 protein expressions. Data were expressed as mean ± SD, n = 3. “∗”and“∗∗”represent p <0.05 or p <0.01 versus the NT group, indicating statistical significance.
Fig. 6
Fig. 6
|Activation of the autophagy pathway is a key pathway for QUE to enhance the survival of random flaps. (a) Immunofluorescence showing the expression of P62 (green), LC3(red) and DAPI(blue) in different groups. Magnification: 20×; Scale: 200 μm. (b,c) Mean fluorescence intensity of P62 and LC3 in different groups. (d) Western blot results showing the expression of P62 and LC3 in different groups. (e) Quantitative analysis of LC3 protein expressions.(f) Western blot results showing the expression of Beclin 1 and CTSD in different groups.(g) Quantitative analysis of P62 protein expressions. (h,i) Quantitative analysis of Beclin 1 and CTSD protein expressions. (j) Western blot results showing the expression of p-AMPK, AMPK, P62 and LC3 in different groups. (k,l,m) Mean fluorescence intensity of p-AMPK/AMPK, P62 and LC3 in different groups. Data were expressed as mean ± SD, n = 3. “∗”and “∗∗” represent p <0.05 or p <0.01 versus the NT group, indicating statistical significance.
Fig. 6
Fig. 6
|Activation of the autophagy pathway is a key pathway for QUE to enhance the survival of random flaps. (a) Immunofluorescence showing the expression of P62 (green), LC3(red) and DAPI(blue) in different groups. Magnification: 20×; Scale: 200 μm. (b,c) Mean fluorescence intensity of P62 and LC3 in different groups. (d) Western blot results showing the expression of P62 and LC3 in different groups. (e) Quantitative analysis of LC3 protein expressions.(f) Western blot results showing the expression of Beclin 1 and CTSD in different groups.(g) Quantitative analysis of P62 protein expressions. (h,i) Quantitative analysis of Beclin 1 and CTSD protein expressions. (j) Western blot results showing the expression of p-AMPK, AMPK, P62 and LC3 in different groups. (k,l,m) Mean fluorescence intensity of p-AMPK/AMPK, P62 and LC3 in different groups. Data were expressed as mean ± SD, n = 3. “∗”and “∗∗” represent p <0.05 or p <0.01 versus the NT group, indicating statistical significance.

References

    1. Gaboriau H.P., Murakami C.S. Skin anatomy and flap physiology. Otolaryng Clin N Am. 2001;34(3):555. - PubMed
    1. Costeloe A., Newman J. Aesthetician role in facial plastic surgery and systemic therapy for healthy skin. Facial Plast Surg Cl. 2023;31(4):557–566. - PubMed
    1. Hyakusoku H., Gao J.H., Pennington D.G., Aoki R., Murakami M., Ogawa R. The microvascular augmented subdermal vascular network (ma-SVN) flap: its variations and recent development in using intercostal perforators. Brit J Plast Surg. 2002;55(5):402–411. - PubMed
    1. Park T.H. The utility of hyaluronidase for the free and pedicle flap salvage. J. Craniofac. Surg. 2023;34(3):1058–1060. - PubMed
    1. Wu L.J., Gao S.Y., Tian K., Zhao T.L., Li K. "Pingpong racket" flap model for evaluating flap survival. J Cosmet Dermatol-Us. 2021;20(8):2593–2597. - PubMed

LinkOut - more resources