. 2024 Oct 18;10(20):e39475.
doi: 10.1016/j.heliyon.2024.e39475. eCollection 2024 Oct 30.

Influence of budesonide and fluticasone propionate in the anti-osteoporotic potential in human bone marrow-derived mesenchymal stem cells via stimulation of osteogenic differentiation

Affiliations

Influence of budesonide and fluticasone propionate in the anti-osteoporotic potential in human bone marrow-derived mesenchymal stem cells via stimulation of osteogenic differentiation

Terrence Suministrado Sumague et al. Heliyon. .

Abstract

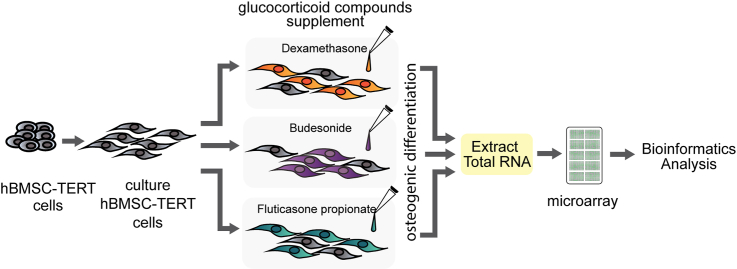
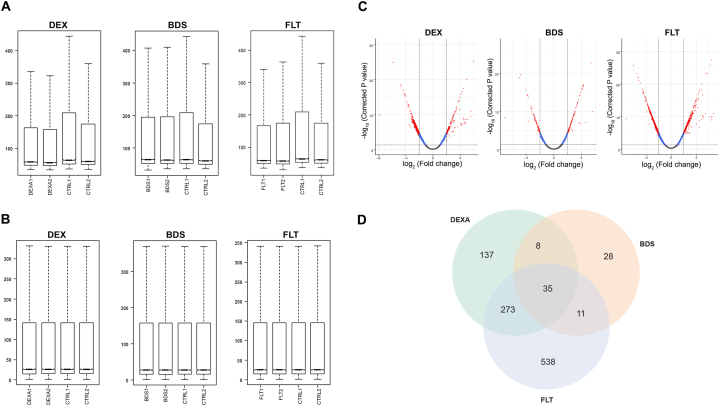
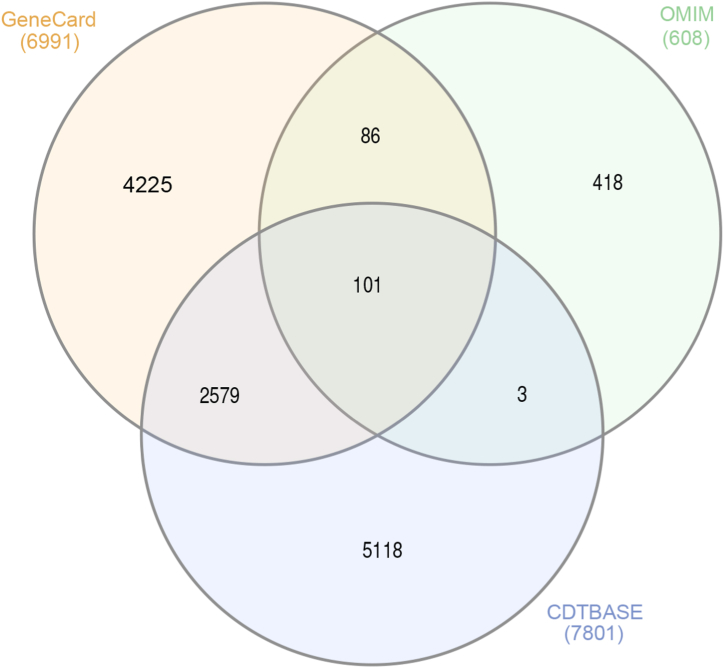
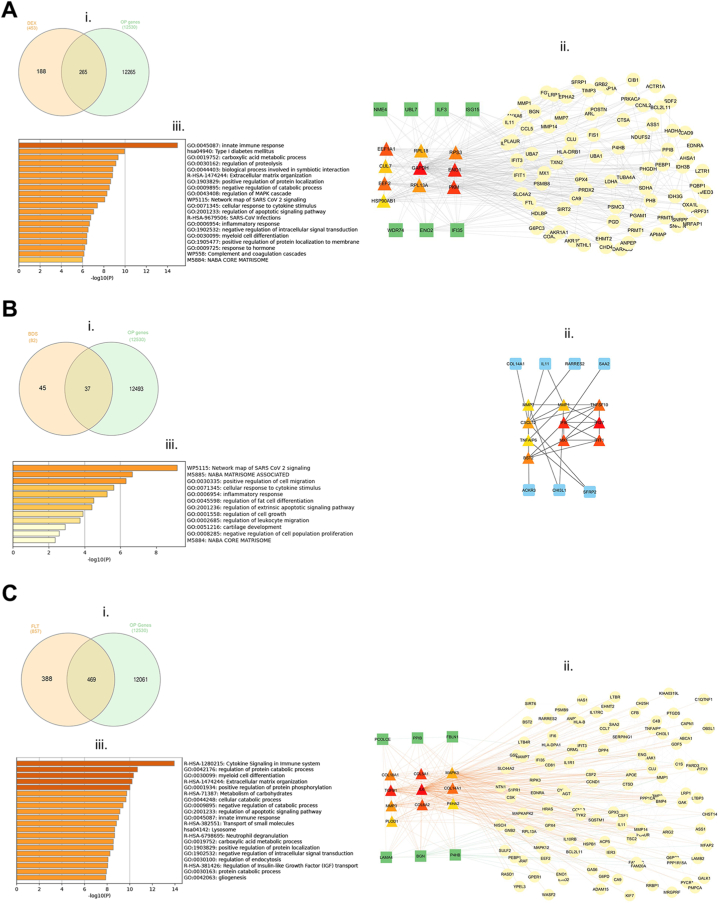
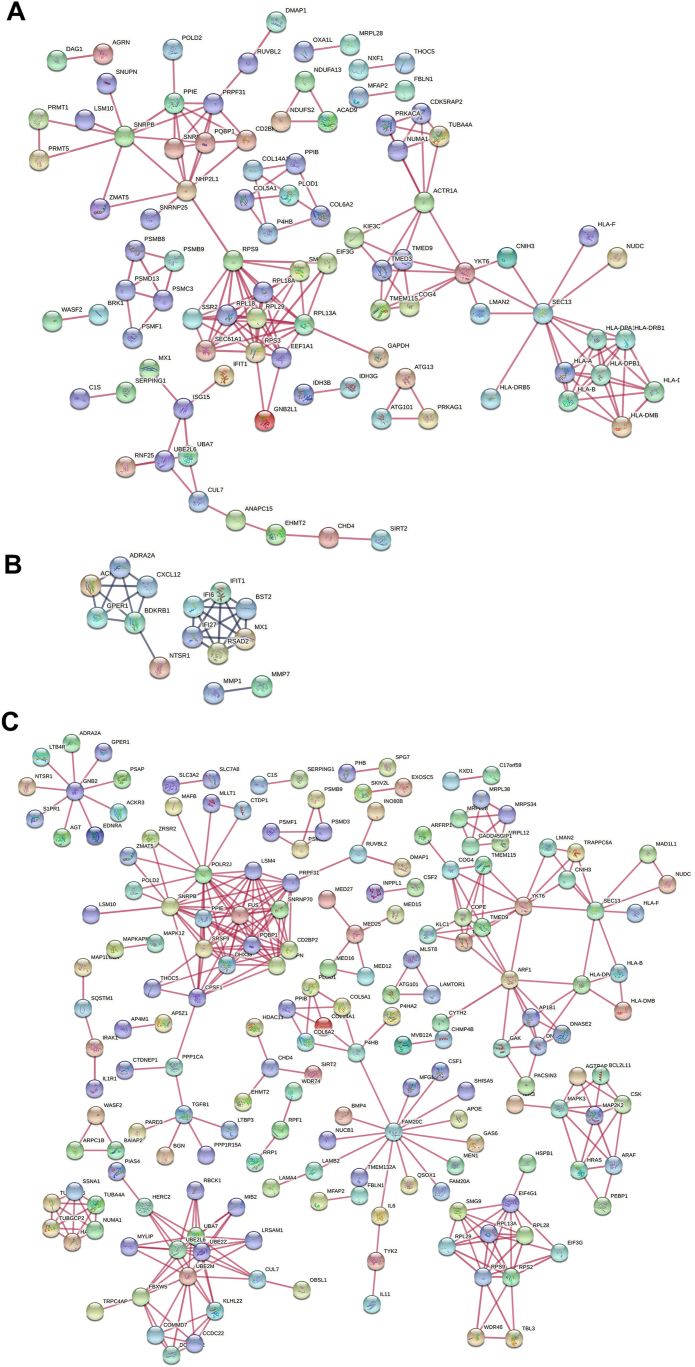
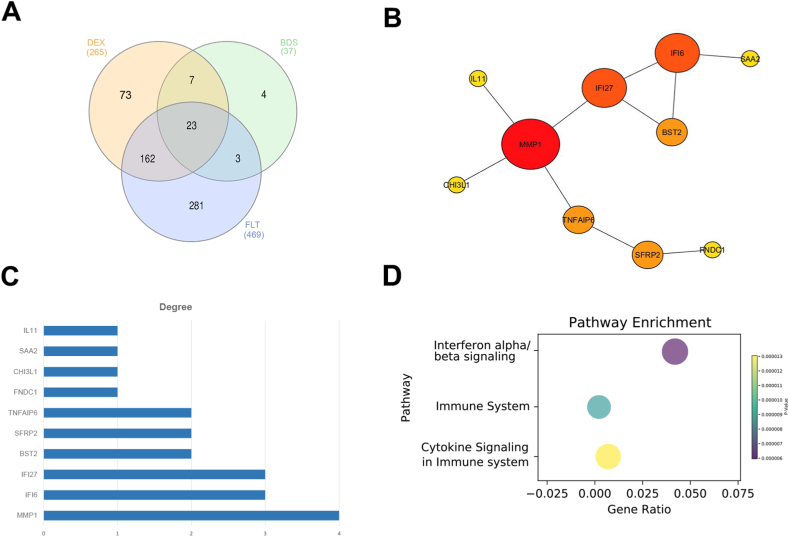
Osteoporosis is a prevalent bone condition with adverse effects observed in patients undergoing long-term glucocorticoid therapy, resulting in bone demineralization and tissue loss. There has been limited studies on the global response to dexamethasone in terms of comparing its expression profile to other common glucocorticoids during osteogenic differentiation. This study focused on the downregulated gene expression profile of glucocorticoid compounds; dexamethasone, budesonide, and fluticasone propionate, during osteogenic differentiation to elucidate the related target genes and pathways associated with the anti-osteoporotic potential of telomerase-immortalized human bone marrow-derived mesenchymal stem cells using a bioinformatics approach. Based on gene expression microarrays experiments and bioinformatics analysis, several key genes involved in the regulation of osteogenic differentiation and osteoporosis development in mesenchymal stem cells that were targeted by these specific glucocorticoids were determined. Network analysis using GeneCards, OMIM, and CTD databases were performed and osteoporosis-related genes were identified. LIMMA and moderated Welch test R packages were performed to determine significant downregulated differentially expressed genes for each glucocorticoid treatment. A total of 479 (dexamethasone), 84 (budesonide), and 889 (fluticasone propionate) differentially expressed genes were identified for each glucocorticoid, of which 35 common genes overlapped. Enrichment pathway analysis was conducted using Metascape, and protein-protein interaction networks were constructed using the STRING database and Cytoscape software to determine potential target genes involved with osteoporosis. Enrichment pathway analysis revealed genes involved in 3 Reactome pathways namely cytokine signaling in immune system, immune system and the interferon alpha/beta signaling pathways and identified 10 hub genes based on the PPI network to determine potential target pathways associated with osteoporosis. These findings provide preliminary insights into the relationship between the key target genes of dexamethasone, budesonide, and fluticasone propionate, and the pathways associated with regulated osteoporosis metabolism during osteogenic differentiation.

Keywords: Anti-Osteoporosis; Bioinformatics approach; Glucocorticoid compound; Mesenchymal stem cells; Osteogenic differentiation.


Conflict of interest statement

The authors declare that they have no known competing financial interests or personal relationships that could have appeared to influence the work reported in this paper.

Figures

Image 1
Graphical abstract
Fig. 1
Fig. 1
Microarray data pre-processing, normalization and analysis. The distribution of gene expressions from glucocorticoid-treated hBMSCs datasets A. before and B. after normalization. Dataset signal distributions plots calculated in R MWT software package, y-axis represents FDR value and x-axis is coefficient fold-change, where coefficient < −2.0 and FDR <0.05 is significant. C. Volcano plot showing the up and downregulated DEGs among GCs. Red color represents significant, blue color and gray color indicates non-significant DEG. D. Venn diagram analysis depicting the overlap of downregulated differentially expressed genes among DEX, BDS and FLT. Overall, 35 common genes from 1452 total genes. (For interpretation of the references to color in this figure legend, the reader is referred to the Web version of this article.)
Fig. 2
Fig. 2
The Venn diagram of OP target genes based on database analysis.
Fig. 3
Fig. 3
Visualization of pathway and process enrichment analysis of OP-related DEGS (A) DEX- (B) BDS- and (C) FLT-treated hBMSCs. i. Venn diagram of GCs and OP-related intersection genes; ii. A PPI network of GC OP genes. Triangle represent main hub genes; green squares and yellow circles represent first-neighbor node of main hub genes. Main hub genes color intensities indicate node hub MCC ranking score; iii. Top enriched terms across differentially expressed genes, colored by P values represented as heatmap. (For interpretation of the references to color in this figure legend, the reader is referred to the Web version of this article.)
Fig. 4
Fig. 4
Protein–protein interaction network. Circles represent genes, lines represent the interaction of proteins between genes, and the results within the circle represent the structure of proteins. The downregulated proteins among treated-hBMSCs were analyzed by STRING and network was built using ‘highest confidence’ (0.900) interaction score. Each node represents a protein, line thickness indicates the strength of data support, and the edges indicate that the proteins are part of a physical complex.
Fig. 5
Fig. 5
Protein–protein interaction network construction of OP-related genes. (A) Venn diagram of GC common genes matched from OP-related genes. (B) Common GCs gene hubs. Circle size represents the node degree and color intensity represents the hub ranking score. (C) PPI hub genes calculated node degree (D) Bubble plot of function enrichment using STRING. (For interpretation of the references to color in this figure legend, the reader is referred to the Web version of this article.)
Fig. 6
Fig. 6
Schematic diagram of molecular docking of DEX and (A) matrix metallopeptidase 1 (MMP1), (B) interleukin 11 (IL11) and (C) chitinase 3 like 1 (CHI3L1); (i) ligand-receptor complex structure (ii) H-bond interacting atoms (iii) ligand (iv) ligand-receptor amino acid interactions.
Fig. 7
Fig. 7
Schematic diagram of molecular docking of BDS and (A) matrix metallopeptidase 1 (MMP1), (B) interleukin 11 (IL11) and (C) chitinase 3 like 1 (CHI3L1); (i) ligand-receptor complex structure (ii) H-bond interacting atoms (iii) ligand (iv) ligand-receptor amino acid interactions.
Fig. 8
Fig. 8
Schematic diagram of molecular docking of FLT and (A) matrix metallopeptidase 1 (MMP1), (B) interleukin 11 (IL11) and (C) chitinase 3 like 1 (CHI3L1); (i) ligand-receptor complex structure (ii) H-bond interacting atoms (iii) ligand (iv) ligand-receptor amino acid interactions.

Similar articles

References

    1. Canalis E. Mechanisms of glucocorticoid-induced osteoporosis. Curr. Opin. Rheumatol. 2003;15(4):454–457. doi: 10.1097/00002281-200307000-00013. - DOI - PubMed
    1. Yuasa M., Yamada T., Taniyama T., Masaoka T., Xuetao W., Yoshii T., Horie M., Yasuda H., Uemura T., Okawa A., Sotome S. Dexamethasone enhances osteogenic differentiation of bone marrow- and muscle-derived stromal cells and augments ectopic bone formation induced by bone morphogenetic protein-2. PLoS One. 2015;10(2) doi: 10.1371/journal.pone.0116462. - DOI - PMC - PubMed
    1. Spiro A.S., Beil F.T., Schinke T., Schilling A.F., Eulenburg C., Rueger J.M., Amling M. Short-term application of dexamethasone enhances bone morphogenetic protein-7-induced ectopic bone formation in vivo. J. Trauma. 2010;69(6):1473–1480. doi: 10.1097/TA.0b013e3181dc59e4. - DOI - PubMed
    1. Lupsa B.C., Insogna K. Bone health and osteoporosis. Endocrinol. Metabol. Clin. 2015;44(3):517–530. doi: 10.1016/j.ecl.2015.05.002. - DOI - PubMed
    1. Shalhoub V., Conlon D., Tassinari M., Quinn C., Partridge N., Stein G.S., Lian J.B. Glucocorticoids promote development of the osteoblast phenotype by selectively modulating expression of cell growth and differentiation associated genes. J. Cell. Biochem. 1992;50(4):425–440. doi: 10.1002/jcb.240500411. - DOI - PubMed

LinkOut - more resources