. 2024 Oct 18;10(20):e39534.
doi: 10.1016/j.heliyon.2024.e39534. eCollection 2024 Oct 30.

Blockade of 11β-hydroxysteroid dehydrogenase type 1 ameliorates metabolic dysfunction-associated steatotic liver disease and fibrosis

Affiliations

Blockade of 11β-hydroxysteroid dehydrogenase type 1 ameliorates metabolic dysfunction-associated steatotic liver disease and fibrosis

Hwan Ma et al. Heliyon. .

Abstract

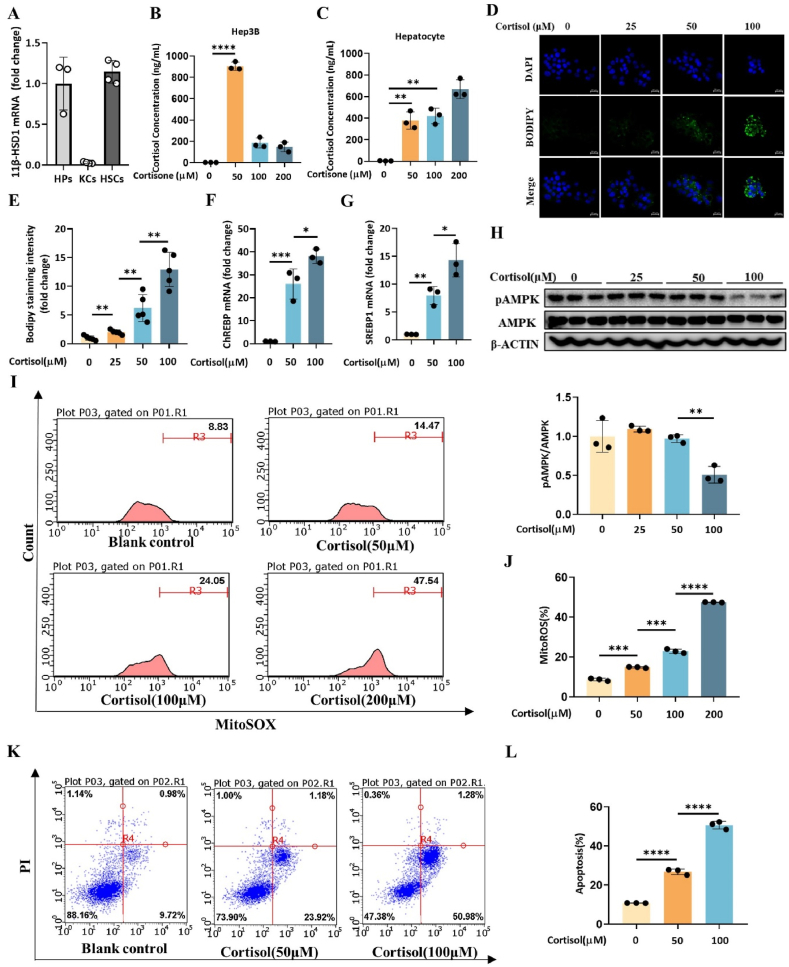
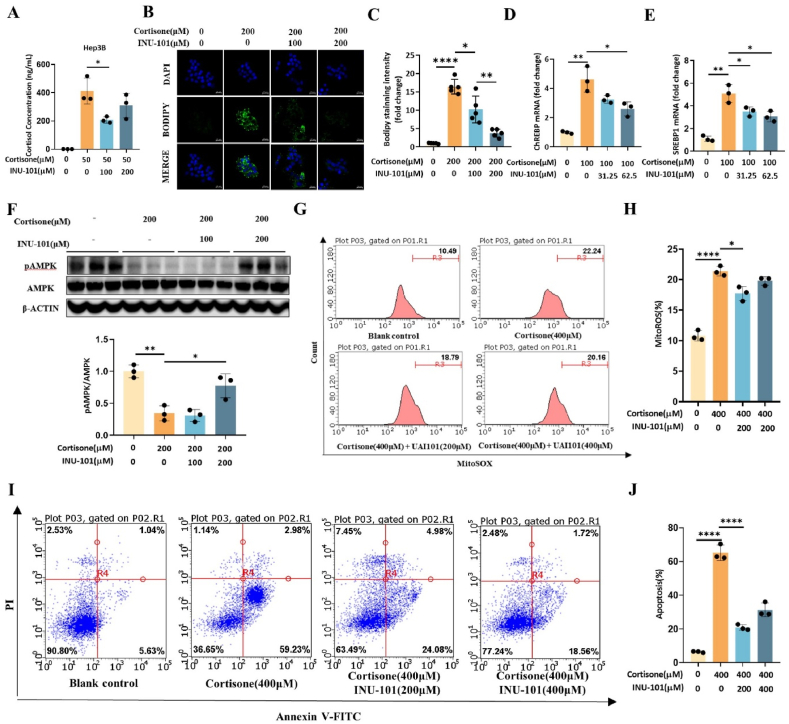
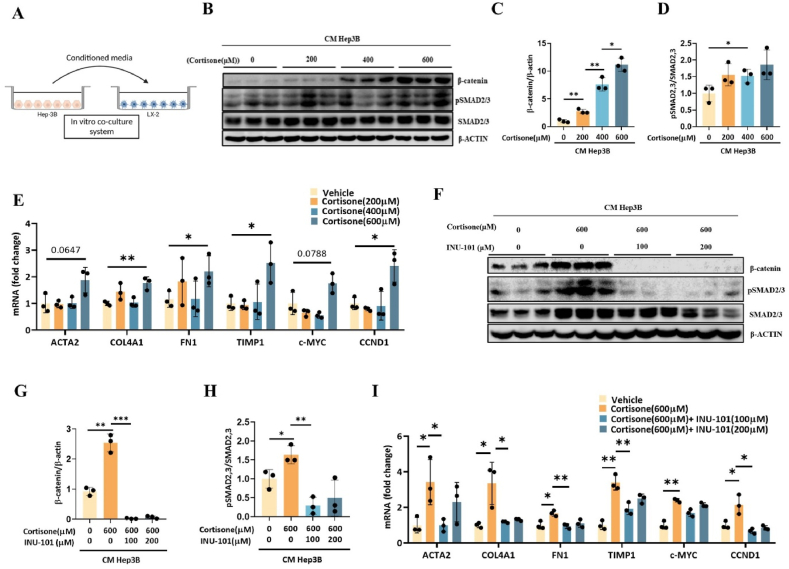
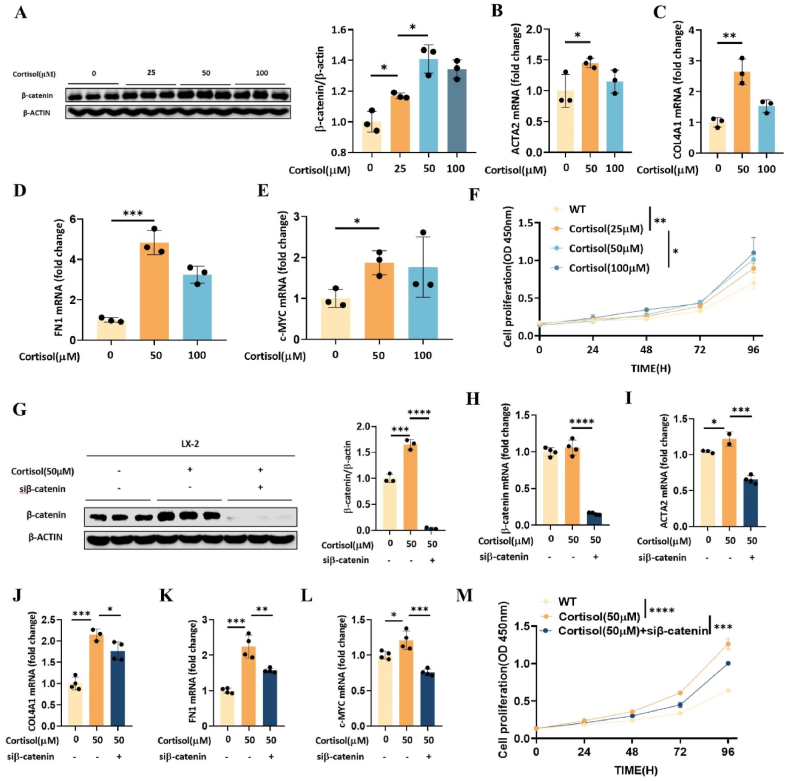
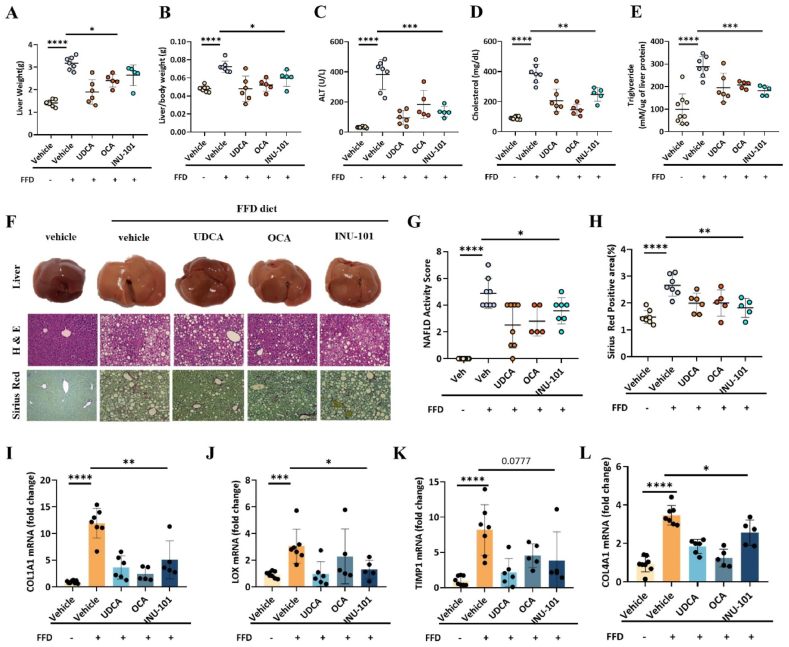
11β-Hydroxysteroid dehydrogenase type 1 (11β-HSD1) is a key enzyme involved in the conversion of cortisone to active cortisol in the liver. Elevated cortisol levels can trigger oxidative stress, inflammation, and hepatocyte damage, highlighting the importance of 11β-HSD1 inhibition as a potential therapeutic approach. This study aimed to explore the effects of INU-101, an inhibitor of 11β-HSD1, on the development of metabolic dysfunction-associated steatotic liver disease (MASLD) and fibrosis. Our findings demonstrated that INU-101 effectively mitigated cortisol-induced lipid accumulation, reactive oxygen species generation, and hepatocyte apoptosis. Furthermore, 11β-HSD1 inhibition suppressed hepatic stellate cell activation by modulating β-catenin and phosphorylated SMAD2/3. INU-101 administration significantly reduced hepatic lipid accumulation and liver fibrosis in mice fed fast-food diet. This study suggests that INU-101 holds promise as a clinical candidate for treating MASLD and fibrosis, offering potential therapeutic benefits by targeting the intricate processes involving 11β-HSD1 and cortisol regulation in the liver.

Keywords: 11β-HSD1; Cortisol; Cortisone; Lipid accumulation; Liver fibrosis.


Conflict of interest statement

The authors declare the following financial interests/personal relationships which may be considered as potential competing interests: Jun Sung Jang reports equipment, drugs, or supplies was provided by Ahn-Gook Phamaceutical Co., Ltd. Soo Im Chang reports equipment, drugs, or supplies was provided by Ahn-Gook Phamaceutical Co., Ltd. Jun Sung Jang reports a relationship with Ahn-Gook Phamaceutical Co., Ltd. that includes: employment. Soo Im Chang reports a relationship with Ahn-Gook Phamaceutical Co., Ltd. that includes: employment. INU-101 is under intellectual property rights owned by Ahn-Kook Pharmaceutical Co., Ltd., Korea, and we conducted experiments with the provision of INU-101, UDCA, and OCA. If there are other authors, they declare that they have no known competing financial interests or personal relationships that could have appeared to influence the work reported in this paper.

Figures

Fig. 1
Fig. 1
Cortisol induces hepatic lipid accumulation and subsequent cell death (A) 11βHSD1 mRNA expression in primary hepatocytes, KCs, and HSCs. (B–C) ELISA for detecting conversion of cortisone to cortisol in Hep3B cells and primary hepatocyte. (D–E) BODIPY staining and quantification of cortisol in HepG2 cells. (F–G) mRNA expression of SREBP1 and ChREBP in Hep3B cells treated with cortisol. (H) Quantification of AMPK and p-AMPK protein levels in Hep3B cells following cortisol treatment. The original image was provided in Figure S3 (I-J) Flow cytometry analysis of mitochondrial ROS production in Hep3B cells after cortisol treatment. (K–L) Flow cytometry analysis of apoptosis in Hep3B cells after cortisol treatment. Relative mRNA expression levels were normalized to mouse GAPDH levels. The data are expressed as means ± sem. ∗P < 0.05, ∗∗P < 0.01, ∗∗∗P < 0.001, ∗∗∗∗P < 0.0001.
Fig. 2
Fig. 2
Blockade of 11β-HSD1 prevents cortisone-mediated lipid accumulation and subsequent cell death (A) ELISA showing cortisone conversion to cortisol following co-treatment with INU-101 in Hep3B cells. (B–C) BODIPY staining and quantification of cortisone following co-treatment with INU-101 in HepG2 cells. (D–E) SREBP1 and ChREBP mRNA expression following co-treatment of cortisone with INU-101 in Hep3B cells. (F) Quantification of AMPK and p-AMPK protein levels in Hep3B cells following cortisone and INU-101 treatment. The original image was provided in Figure S4 (G-H) Flow cytometry analysis of mitochondrial ROS production in Hep3B cells after cortisone and INU-101 treatment. (I–J) Flow cytometry analysis of apoptosis detection in Hep3B cells after cortisone and INU-101 treatment. Relative mRNA expression levels were normalized to mouse GAPDH levels. The data are expressed as means ± sem. ∗P < 0.05, ∗∗P < 0.01, ∗∗∗P < 0.001, ∗∗∗∗P < 0.0001.
Fig. 3
Fig. 3
Cortisol signaling links hepatocyte-derived DAMPs to HSC activation (A) Schematic co-culture system. (B) Protein levels of β-catenin, p-SMAD2/3, and SMAD2/3 in LX2 cells after cell supernatant treatment. The original image was provided in Figure S5 (C-D) TQuantitative analysis of β-catenin/actin and p-SMAD2/3/SMAD2/3. (E) mRNA expression of pro-fibrosis- and proliferation-related genes (including ACTA2, COL4A1, FN1, TIMP1, C-MYC and CCND1) in LX2 cells after cell supernatant treatment. (F) Protein levels of β-catenin, p-SMAD2/3, and SMAD2/3 in LX2 cells after co-treatment with supernatant and INU-101. The original image was provided in Fig. S6. (H) Quantification of β-catenin, p-SMAD2/3, and SMAD2/3. The original image was provided in Fig. S6. (I) mRNA expression of pro-fibrosis- and proliferation-related genes (including ACTA2, COL4A1, FN1, TIMP1, C-MYC and CCND1) in LX2 cells after co-treatment with supernatant and INU-101. Relative mRNA expression levels were normalized to mouse GAPDH levels. The data are expressed as means ± sem. ∗P < 0.05, ∗∗P < 0.01, ∗∗∗P < 0.001.
Fig. 4
Fig. 4
11β-HSD1 mediates cortisol-induced HSC activation by regulating β-catenin signaling (A) Protein level of β-catenin in cortisol-treated LX2 cells. The original image was provided in Figure S7 (B-E) mRNA expression of pro-fibrosis- and proliferation-related genes (including ACTA2, COL4A1, FN1, C-MYC and CCND1) in LX2 cells. (F) Cell proliferation assay of LX2 after treatment with different concentrations of cortisol. (G) Protein levels of β-catenin. The original image was provided in Figure S8 (H-L) mRNA expression of pro-fibrosis- and proliferation-related genes in LX2 cells after treatment with cortisol or cortisol combined with β-catenin knockdown. (M) Cell proliferation assay of LX2 cells after treatment with cortisol or cortisol combined with β-catenin knockdown. Relative mRNA expression levels were normalized to mouse GAPDH levels. The data are expressed as means ± sem. ∗P < 0.05, ∗∗P < 0.01, ∗∗∗P < 0.001, ∗∗∗∗P < 0.0001.
Fig. 5
Fig. 5
Pharmacological inhibition of 11β-HSD1 ameliorates FFD-induced MASLD and fibrosis (A) Liver weight of mice fed for 24 -weeks with normal chow diet (NCD), FFD, FFD + UDCA, FFD + OCA, and FFD + INU-101. (B) Liver-to-body weight ratio of 2mice fed for 4-weeks with NCD, FFD, FFD + UDCA, FFD + OCA, and FFD + INU-101. (C) Serum ALT levels of 24 -weeks with NCD, FFD, FFD + UDCA, FFD + OCA, and FFD + INU-101. (D) Serum cholesterol levels of 24 -weeks with NCD, FFD, FFD + UDCA, FFD + OCA, and FFD + INU-101. (E) Serum triglyceride levels of mice fed for 24-weeks with NCD, FFD, FFD + UDCA, FFD + OCA, and FFD + INU-101. (F) Macroscopic observation, H&E staining and Sirius red staining of liver tissues from mice fed for 24-weeks with NCD, FFD, FFD + UDCA, FFD + OCA, and FFD + INU-101. (G) NAS scoring of liver tissues from mice fed for 24 -weeks with NCD, FFD, FFD + UDCA, FFD + OCA, and FFD + INU-101. (H) Quantification of Sirius red staining of liver tissue from mice fed for 24 -weeks with NCD, FFD, FFD + UDCA, FFD + OCA, and FFD + INU-101 liver tissue. (I–L) mRNA expression of pro-fibrosis-related genes, such as COL1A1, LOX, TIMP1 and COL4A1, in liver tissue. Relative mRNA expression levels were normalized to mouse GAPDH levels. The data are expressed as means ± sem. ∗P < 0.05, ∗∗P < 0.01, ∗∗∗P < 0.001, ∗∗∗∗P < 0.0001.

Similar articles

References

    1. Huby T., Gautier E.L. Immune cell-mediated features of non-alcoholic steatohepatitis. Nat. Rev. Immunol. 2022;22:429–443. doi: 10.1038/s41577-021-00639-3. - DOI - PMC - PubMed
    1. Duell P.B., Welty F.K., Miller M., Chait A., Hammond G., Ahmad Z., Cohen D.E., Horton J.D., Pressman G.S., Toth P.P., T. American Heart Association Council on Arteriosclerosis, Vascular B., Council on H., D. Council on the Kidney in Cardiovascular, Council on L., Cardiometabolic H., Council D. On peripheral Vascular.Nonalcoholic fatty liver disease and cardiovascular risk: a scientific statement from the American heart association. Arterioscler. Thromb. Vasc. Biol. 2022;42:e168–e185. doi: 10.1161/ATV.0000000000000153. - DOI - PubMed
    1. Jiang Y., Wu L., Zhu X., Bian H., Gao X., Xia M. Advances in management of metabolic dysfunction-associated steatotic liver disease: from mechanisms to therapeutics. Lipids Health Dis. 2024;23:95. doi: 10.1186/s12944-024-02092-2. - DOI - PMC - PubMed
    1. Sharma M., Premkumar M., Kulkarni A.V., Kumar P., Reddy D.N., Rao N.P. Drugs for non-alcoholic steatohepatitis (NASH): quest for the holy grail. J Clin Transl Hepatol. 2021;9:40–50. doi: 10.14218/JCTH.2020.00055. - DOI - PMC - PubMed
    1. Harrison S.A., Bedossa P., Guy C.D., Schattenberg J.M., Loomba R., Taub R., Labriola D., Moussa S.E., Neff G.W., Rinella M.E., Anstee Q.M., Abdelmalek M.F., Younossi Z., Baum S.J., Francque S., Charlton M.R., Newsome P.N., Lanthier N., Schiefke I., Mangia A., Pericas J.M., Patil R., Sanyal A.J., Noureddin M., Bansal M.B., Alkhouri N., Castera L., Rudraraju M., Ratziu V., Investigators M.-N. A phase 3, randomized, controlled trial of resmetirom in NASH with liver fibrosis. N. Engl. J. Med. 2024;390:497–509. doi: 10.1056/NEJMoa2309000. - DOI - PubMed

LinkOut - more resources