

Interaction of graphene oxide with tannic acid: computational modeling and toxicity mitigation in C. elegans
- PMID: 39498295
- PMCID: PMC11533115
- DOI: 10.3762/bjnano.15.105
Interaction of graphene oxide with tannic acid: computational modeling and toxicity mitigation in C. elegans
Abstract
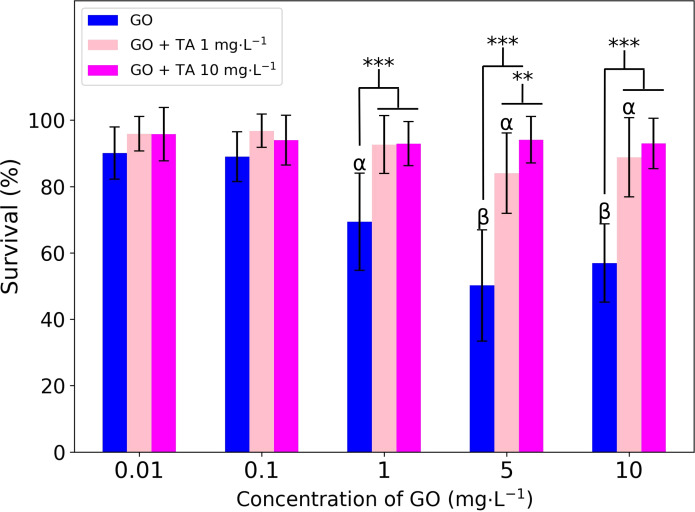
Graphene oxide (GO) undergoes multiple transformations when introduced to biological and environmental media. GO surface favors the adsorption of biomolecules through different types of interaction mechanisms, modulating the biological effects of the material. In this study, we investigated the interaction of GO with tannic acid (TA) and its consequences for GO toxicity. We focused on understanding how TA interacts with GO, its impact on the material surface chemistry, colloidal stability, as well as, toxicity and biodistribution using the Caenorhabditis elegans model. Employing computational modeling, including reactive classical molecular dynamics and ab initio calculations, we reveal that TA preferentially binds to the most reactive sites on GO surfaces via the oxygen-containing groups or the carbon matrix; van der Waals interaction forces dominate the binding energy. TA exhibits a dose-dependent mitigating effect on the toxicity of GO, which can be attributed not only to the surface interactions between the molecule and the material but also to the inherent biological properties of TA in C. elegans. Our findings contribute to a deeper understanding of GO's environmental behavior and toxicity and highlight the potential of tannic acid for the synthesis and surface functionalization of graphene-based nanomaterials, offering insights into safer nanotechnology development.
Keywords: biodistribution; density functional theory; ecotoxicity; molecular dynamics; surface interactions; toxicity mitigation.
Copyright © 2024, Petry et al.
Conflict of interest statement
There are no conflicts to declare.
Figures


Similar articles
-
Toxicity mitigation and biodistribution of albumin corona coated graphene oxide and carbon nanotubes in Caenorhabditis elegans.NanoImpact. 2022 Jul;27:100413. doi: 10.1016/j.impact.2022.100413. Epub 2022 Aug 6. NanoImpact. 2022. PMID: 35940564
-
Fluorescence study of the influence of centrifugation on graphene oxide dispersions in water and in tannic acid.Spectrochim Acta A Mol Biomol Spectrosc. 2022 Oct 5;278:121302. doi: 10.1016/j.saa.2022.121302. Epub 2022 Apr 28. Spectrochim Acta A Mol Biomol Spectrosc. 2022. PMID: 35525181
-
The environmental fate of graphene oxide in aquatic environment-Complete mitigation of its acute toxicity to planktonic and benthic crustaceans by algae.J Hazard Mater. 2020 Nov 15;399:123027. doi: 10.1016/j.jhazmat.2020.123027. Epub 2020 May 27. J Hazard Mater. 2020. PMID: 32937708
-
Graphene-Oxide Peptide-Containing Materials for Biomedical Applications.Int J Mol Sci. 2024 Sep 22;25(18):10174. doi: 10.3390/ijms251810174. Int J Mol Sci. 2024. PMID: 39337659 Free PMC article. Review.
-
Toxicological Evaluation of Graphene-Family Nanomaterials.J Nanosci Nanotechnol. 2020 Apr 1;20(4):1993-2006. doi: 10.1166/jnn.2020.17364. J Nanosci Nanotechnol. 2020. PMID: 31492205 Review.
References
-
- Arıcı Ş, Kaçmaz E G, Kamali A R, Ege D. Mater Chem Phys. 2023;293:126961. doi: 10.1016/j.matchemphys.2022.126961. - DOI
-
- Guo S, Garaj S, Bianco A, Ménard-Moyon C. Nat Rev Phys. 2022;4:247–262. doi: 10.1038/s42254-022-00422-w. - DOI
-
- Zhu Y, Ji H, Cheng H-M, Ruoff R S. Natl Sci Rev. 2018;5:90–101. doi: 10.1093/nsr/nwx055. - DOI
LinkOut - more resources
Full Text Sources