. 2024 Oct 9;27(11):111025.
doi: 10.1016/j.isci.2024.111025. eCollection 2024 Nov 15.

Federated difference-in-differences with multiple time periods in DataSHIELD

Affiliations

Federated difference-in-differences with multiple time periods in DataSHIELD

Manuel Huth et al. iScience. .

Abstract

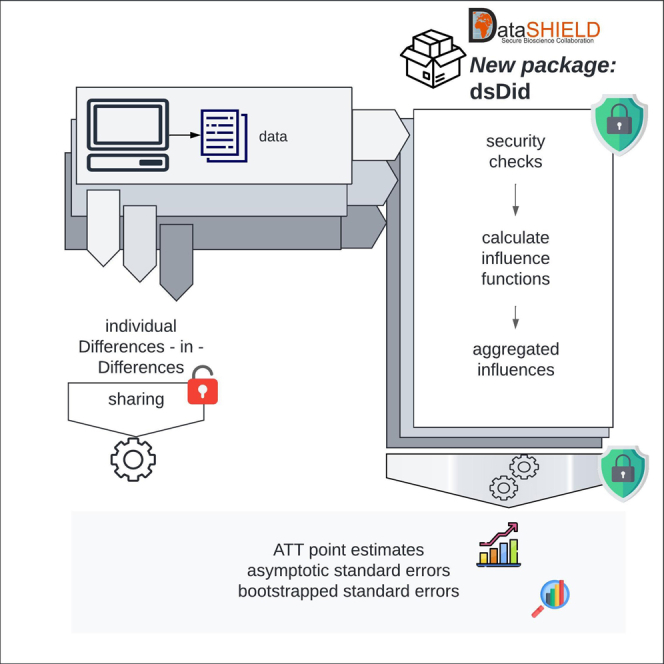
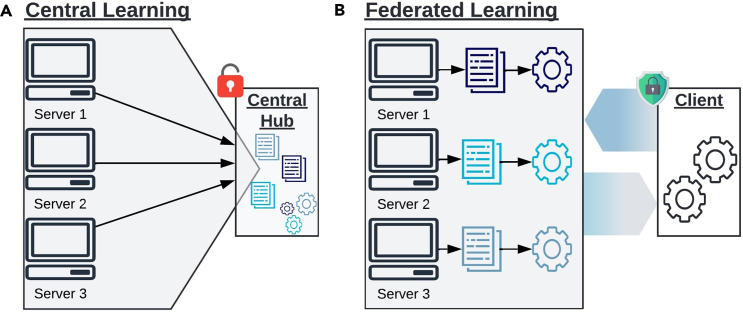
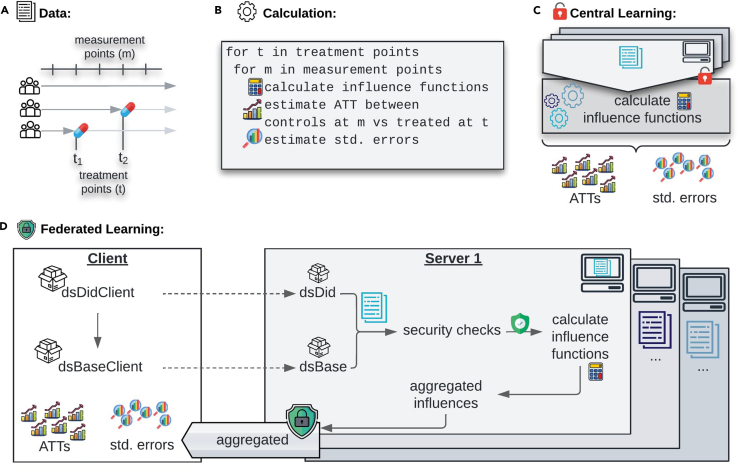
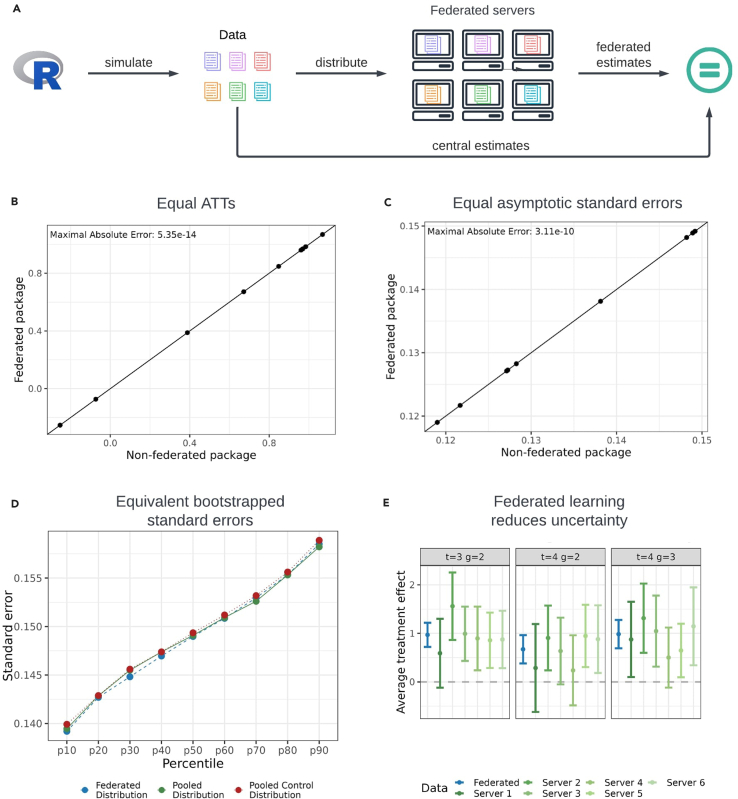
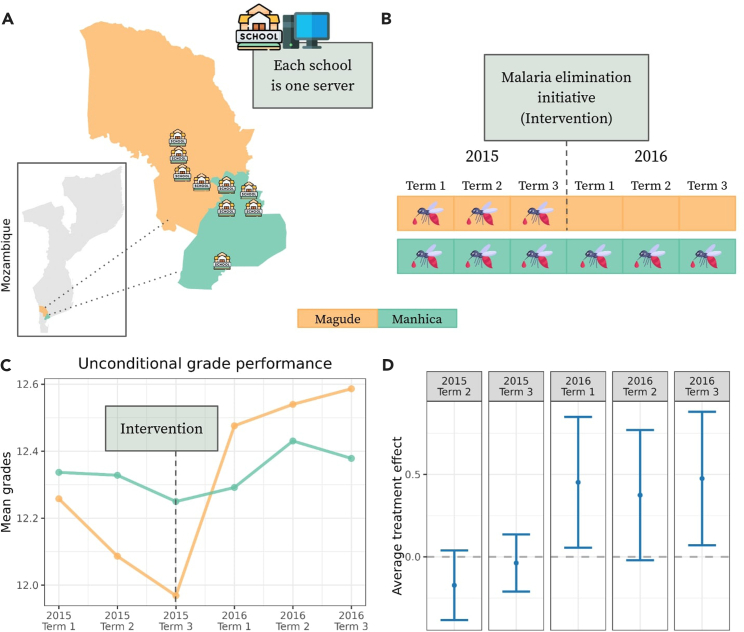
Difference-in-differences (DID) is a key tool for causal impact evaluation but faces challenges when applied to sensitive data restricted by privacy regulations. Obtaining consent can shrink sample sizes and reduce statistical power, limiting the analysis's effectiveness. Federated learning addresses these issues by sharing aggregated statistics rather than individual data, though advanced federated DID software is limited. We developed a federated version of the Callaway and Sant'Anna difference-in-differences (CSDID), integrated into the DataSHIELD platform, adhering to stringent privacy protocols. Our approach reproduces key estimates and standard errors while preserving confidentiality. Using simulated and real-world data from a malaria intervention in Mozambique, we demonstrate that federated estimates increase sample sizes, reduce estimation uncertainty, and enable analyses when data owners cannot share treated or untreated group data. Our work contributes to facilitating the evaluation of policy interventions or treatments across centers and borders.

Keywords: Computer science; Health informatics; Machine learning.


Conflict of interest statement

The authors declare no competing interests.

Figures

None
Graphical abstract
Figure 1
Figure 1
Learning paradigma (A) Explanation of central learning. In central learning, models are trained at one central hub (analyst). All servers (data owners) send their data to the central hub, granting the analyst full access to individual-level information without preserving data privacy. (B) Explanation of federated learning. In federated learning, model updates are computed locally at the servers, and only aggregated information is sent to the analyst (client). The locally aggregated information is then further aggregated to compute overall model parameter updates, which are sent back to the servers. This iterative process continues until a convergence criterion is met, ensuring efficient and privacy-preserving collaboration between servers and the analyst. This figure has been designed using resources from Flaticon.com.
Figure 2
Figure 2
Federated implementation (A) Visualization of data structure. The data have a panel structure with many observations per individual and varying treatment timing. (B) High-level algorithm of the CSDID. For each combination of evaluation period and treatment period, an ATT and its standard error are computed using the influence function of each individual. (C) CSDID for central learning. In central learning, the data are all at one server such that the sample analogs can be computed directly. (D) CSDID for federated learning. The analysis is initialized by using functions from the client side package dsDidClient that calls the dsDid package on the server sides using opal. During the local computations of the influence functions on the server sides, security checks are enforced in order to guarantee data privacy. The server-side influences are aggregated on each server and only the aggregated information is sent to the client side at which ATTs and standard errors are computed. This figure has been designed using resources from Flaticon.com.
Figure 3
Figure 3
Similarity of federated and central estimation for the DR estimate with not-yet-treated individuals as the control group (A) Simulation setup. The federated setup involved 6 servers. Three servers had 134 (536) individuals (observations), and three had 133 (532) individuals (observations). Individuals were either never treated or treated in period two or three, with all observations of an individual on one server. (B) Equality of central and federated point estimates. The x axis shows central (non-federated) estimates, while the y axis shows federated estimates. The 45° line indicates equal results when aligned. (C) Equality of central and federated asymptotic standard errors. The x axis shows central asymptotic standard errors, and the y axis shows federated standard errors. The 45° line is shown for reference. (D) Comparison of bootstrapped standard errors. Percentiles of the distribution function compare the distribution of federated (blue) and central (green) bootstrapped standard errors. Two central learning distributions establish reference differences, with 500 bootstrapped standard errors analyzed. (E) Treatment effect estimates. Point estimates (dots) and 95% confidence intervals for post-treatment periods are shown. Federated package estimates are in blue; estimates from one server are in green. This figure has been designed using resources from Flaticon.com.
Figure 4
Figure 4
Federated learning enables estimation of DR estimates (A) The districts of Magude and Manhiça in Mozambique and the location of the 9 schools. (B) The timeline of the malaria elimination initiative that was launched in Magude before the term 1 in 2016. (C) Unconditional means of the mean grades in Magude and Manhiça, respectively. The means are estimated as sample averages over the observations (mean grades of students) of the individuals in the respective districts at the respective time. (D) The subplot presents point estimates (depicted as dots) and 95% confidence intervals of the estimated federated treatment effects for all periods. This figure has been designed using resources from Flaticon.com.

References

    1. Ashenfelter O. Estimating the effect of training programs on earnings. Rev. Econ. Stat. 1978;60:47–57.
    1. Card D., Krueger A.B. Minimum wages and employment: A case study of the fast-food industry in New Jersey and Pennsylvania: reply. Am. Econ. Rev. 2000;90:1397–1420.
    1. Molyneux P., Reghezza A., Xie R. Bank margins and profits in a world of negative rates. J. Bank. Finance. 2019;107
    1. Nawaz M.A., Seshadri U., Kumar P., Aqdas R., Patwary A.K., Riaz M. Nexus between green finance and climate change mitigation in N-11 and BRICS countries: empirical estimation through difference in differences (DID) approach. Environ. Sci. Pollut. Res. Int. 2021;28:6504–6519. - PMC - PubMed
    1. Galiani S., Gertler P., Schargrodsky E. Water for life: The impact of the privatization of water services on child mortality. J. Polit. Econ. 2005;113:83–120.

LinkOut - more resources