. 2024 Nov 4;6(4):lqae146.
doi: 10.1093/nargab/lqae146. eCollection 2024 Sep.

Tumor purity estimated from bulk DNA methylation can be used for adjusting beta values of individual samples to better reflect tumor biology

Affiliations

Tumor purity estimated from bulk DNA methylation can be used for adjusting beta values of individual samples to better reflect tumor biology

Iñaki Sasiain et al. NAR Genom Bioinform. .

Abstract

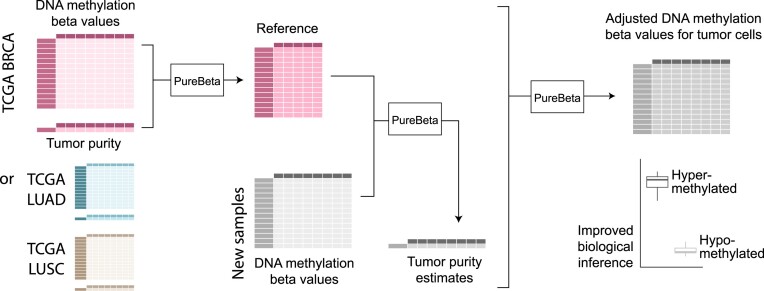
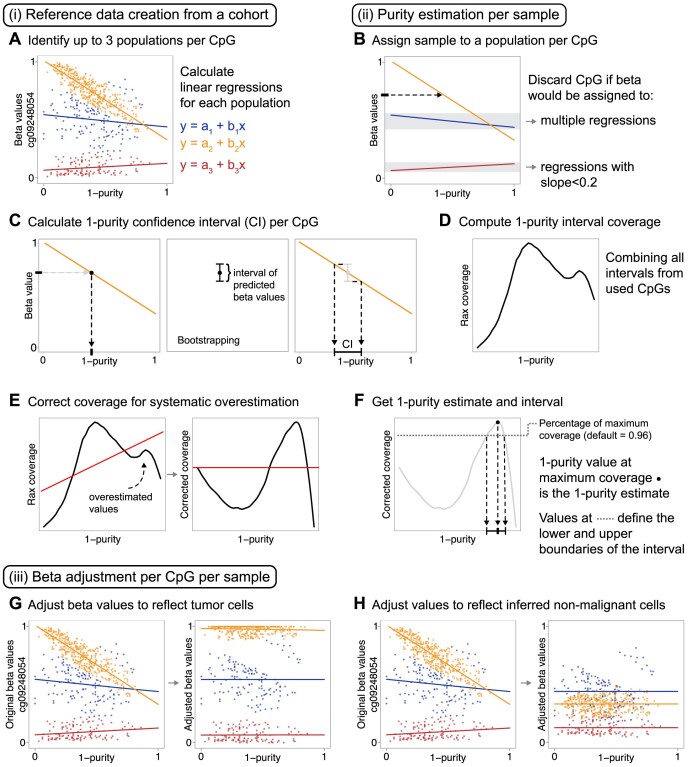
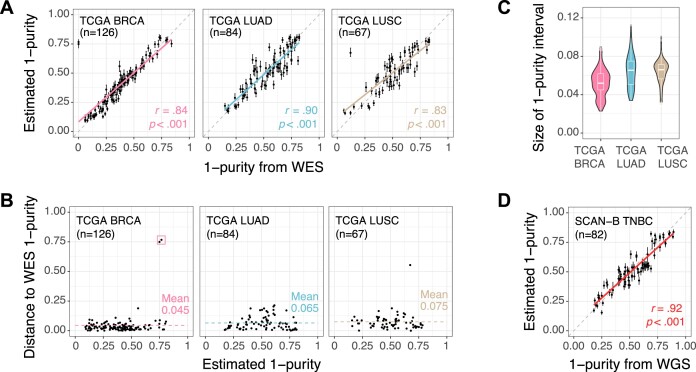
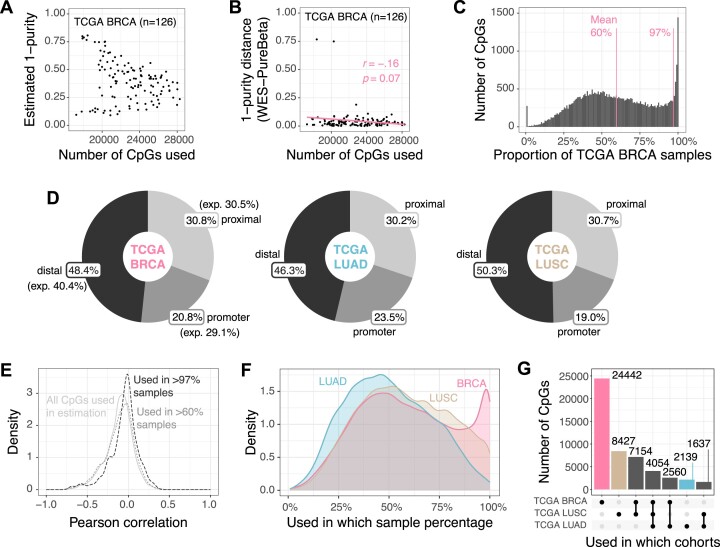
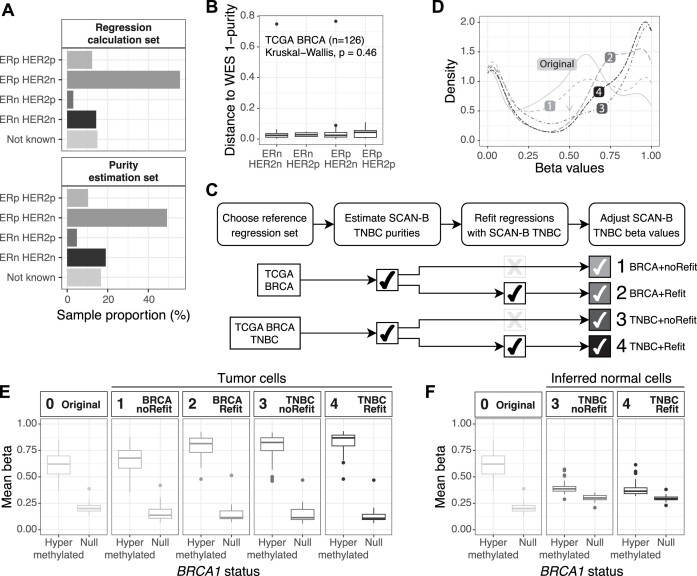
Epigenetic deregulation through altered DNA methylation is a fundamental feature of tumorigenesis, but tumor data from bulk tissue samples contain different proportions of malignant and non-malignant cells that may confound the interpretation of DNA methylation values. The adjustment of DNA methylation data based on tumor purity has been proposed to render both genome-wide and gene-specific analyses more precise, but it requires sample purity estimates. Here we present PureBeta, a single-sample statistical framework that uses genome-wide DNA methylation data to first estimate sample purity and then adjust methylation values of individual CpGs to correct for sample impurity. Purity values estimated with the algorithm have high correlation (>0.8) to reference values obtained from DNA sequencing when applied to samples from breast carcinoma, lung adenocarcinoma, and lung squamous cell carcinoma. Methylation beta values adjusted based on purity estimates have a more binary distribution that better reflects theoretical methylation states, thus facilitating improved biological inference as shown for BRCA1 in breast cancer. PureBeta is a versatile tool that can be used for different Illumina DNA methylation arrays and can be applied to individual samples of different cancer types to enhance biological interpretability of methylation data.


Figures

Graphical Abstract
Graphical Abstract
Figure 1.
Figure 1.
PureBeta's framework. Overview of the algorithm's three main modules (i–iii). (A) As the first module, samples are divided into up to three populations for each CpG and linear regressions are calculated between beta values and known sample purities as exemplified by one CpG (cg09248054) and the TCGA BRCA cohort. (B) To estimate the purity of a new sample in the second module of PureBeta, the sample is first assigned to a population based on its beta value. This is performed per CpG. If the beta value would be assigned to multiple regressions or to regressions with small slopes, the CpG is discarded from the estimation calculation. (C) A purity interval is calculated based on the original beta values and the assigned linear regression for each kept CpG using a bootstrapping approach. (D) All purity intervals are combined into a purity coverage. (E) The purity coverage is corrected for a detected systematic overrepresentation of low purity values. (F) The maximum coverage value is assigned as the sample's purity estimate together with a purity interval. (G, H) As the final module of the algorithm, original beta values are adjusted per CpG to reflect values of samples comprised of only tumor (G) or only normal (H) cells according to the calculated sample purities and linear regressions. Beta values shown in these panels are from the same CpG and samples in panel A. See Methods for more details on each step.
Figure 2.
Figure 2.
PureBeta's performance in the different cohorts. (A) Correlation between 1-purity as estimated with PureBeta and reference values calculated from WES on 20% of samples after using the other 80% to calculate regressions per TCGA cohort. Vertical bars correspond to the 1-purity interval for a sample. Dashed line corresponds to a 1:1 relationship. (B) Error between 1-purity as estimated with PureBeta and from WES calculated as absolute distance between estimates per sample for the three TCGA cohorts. Dashed line corresponds to the mean distance. (C) Violin plot of purity interval size as obtained from PureBeta per TCGA cohort. Violin width reflects cohort size. (D) Correlation between 1-purity as estimated with PureBeta and reference values calculated from WGS in SCAN-B TNBC. Vertical bars correspond to the 1-purity interval for a sample. Dashed line corresponds to a 1:1 relationship.
Figure 3.
Figure 3.
CpG usage by PureBeta in the TCGA cohorts. (A) 1-purity estimated with PureBeta in TCGA BRCA compared to the number of CpGs used for making the estimate. (B) Absolute distance between estimated and reference 1-purities in TCGA BRCA compared to the number of CpGs used during estimation. (C) Percentage of TCGA BRCA samples that had a same CpG used during purity estimation. (D) Distribution relative to genes of all CpGs used for purity estimation in the three cohorts compared to expected (exp.) values considering all ∼421 000 CpGs available. Expected values are the same across cohorts. (E) Distribution of Pearson correlation values between DNA methylation beta values and gene expression data after CpG to gene mapping through genomic coordinates. Only CpGs categorized as in promoters were kept. (F) Percentage of samples in a cohort using a same CpG during purity estimation. CpGs that were not used in any sample were excluded. (G) Upset plot of CpGs used during purity estimation and how many were in common across cohorts.
Figure 4.
Figure 4.
Beta adjustment and cohort influence. (A) Proportion of breast cancer clinical subgroups based on ER and HER2 status in the TCGA BRCA cohort when split into two sets. (B) Distance between estimated and reference 1-purity values distributed by clinical subgroup of samples. (C) Overview of strategy for investigating the influence of cohort composition on beta adjustment. (D) Density of beta values from the original cohort and from tumor cells after adjustment for purity with the four methods in (C) showing a decrease in values around 0.5 (arrow). (E, F) Mean value per sample of original beta values, (E) adjusted beta values for tumor cells, and (F) adjusted beta values for inferred non-malignant background cells as calculated with approaches presented in (C).

Similar articles

Cited by

References

    1. Hanahan D. Hallmarks of cancer: new dimensions. Cancer Discov. 2022; 12:31–46. - PubMed
    1. Garcia-Martinez L., Zhang Y., Nakata Y., Chan H.L., Morey L. Epigenetic mechanisms in breast cancer therapy and resistance. Nat. Commun. 2021; 12:1786. - PMC - PubMed
    1. Chaligne R., Gaiti F., Silverbush D., Schiffman J.S., Weisman H.R., Kluegel L., Gritsch S., Deochand S.D., Gonzalez Castro L.N., Richman A.R. et al. . Epigenetic encoding, heritability and plasticity of glioma transcriptional cell states. Nat. Genet. 2021; 53:1469–1479. - PMC - PubMed
    1. Lianidou E. Detection and relevance of epigenetic markers on ctDNA: recent advances and future outlook. Mol Oncol. 2021; 15:1683–1700. - PMC - PubMed
    1. Glodzik D., Bosch A., Hartman J., Aine M., Vallon-Christersson J., Reutersward C., Karlsson A., Mitra S., Nimeus E., Holm K. et al. . Comprehensive molecular comparison of BRCA1 hypermethylated and BRCA1 mutated triple negative breast cancers. Nat. Commun. 2020; 11:3747. - PMC - PubMed

LinkOut - more resources