. 2024 Oct 17:77:102881.
doi: 10.1016/j.eclinm.2024.102881. eCollection 2024 Nov.

Development of fully automated models for staging liver fibrosis using non-contrast MRI and artificial intelligence: a retrospective multicenter study

Affiliations

Development of fully automated models for staging liver fibrosis using non-contrast MRI and artificial intelligence: a retrospective multicenter study

Chunli Li et al. EClinicalMedicine. .

Abstract

Background: Accurate staging of liver fibrosis (LF) is essential for clinical management in chronic liver disease. While non-contrast MRI (NC-MRI) yields valuable information for liver assessment, its effectiveness in predicting LF remains underexplored. This study aimed to develop and validate artificial intelligence (AI)-powered models utilizing NC-MRI for staging LF.

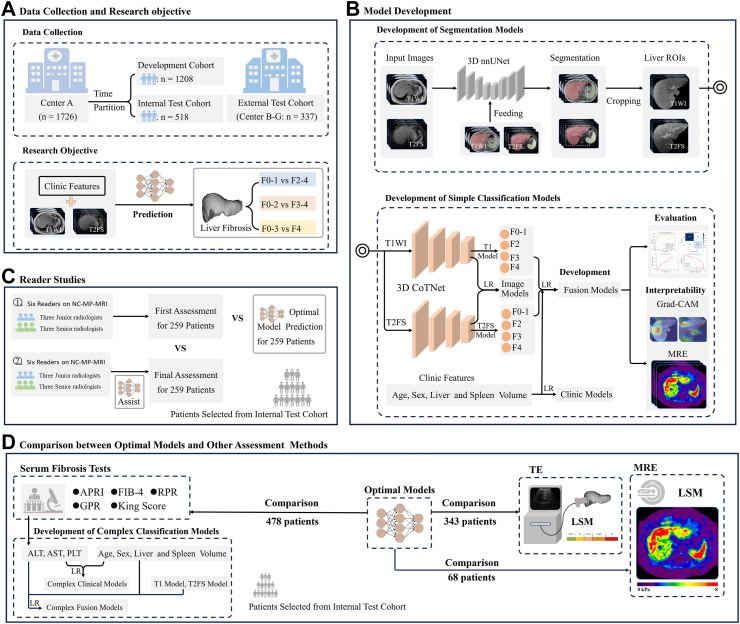
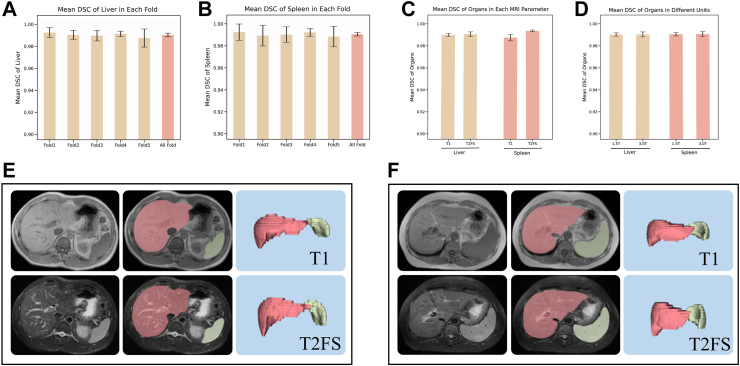
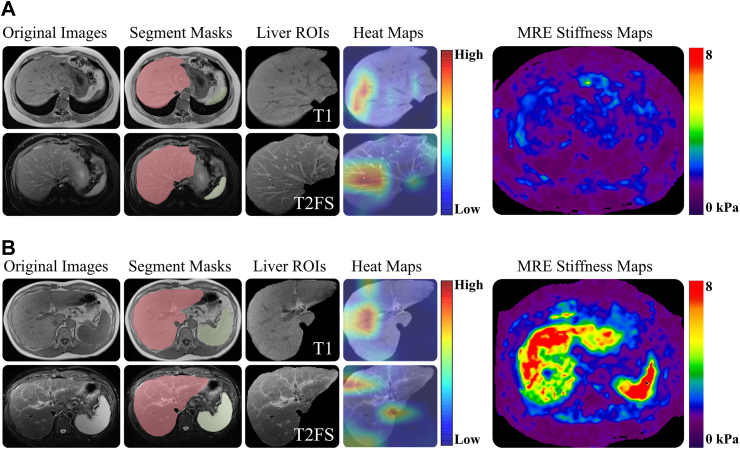
Methods: A total of 1726 patients from Shengjing Hospital of China Medical University, registered between October 2003 and October 2022, were retrospectively collected, and divided into development (n = 1208) and internal test (n = 518) cohorts. An external test cohort consisting of 337 individuals from six centers, registered between June 2015 and November 2022, were also included. All participants underwent NC-MRI (T1-weighted imaging, T1WI; and T2-fat-suppressed imaging, T2FS) and liver biopsies. Two classification models (CMs), named T1 and T2FS, were trained on respective image types using 3D contextual transformer networks and evaluated on both test cohorts. Additionally, three CMs-Clinic, Image, and Fusion-were developed using clinical features, T1 and T2FS scores, and their integration via logistic regression. Classification effectiveness of CMs was assessed using the area under the receiver operating characteristic curve (AUC). A comparison was conducted between the optimal models (OMs) with highest AUC and other methods (transient elastography, five serum biomarkers, and six radiologists).

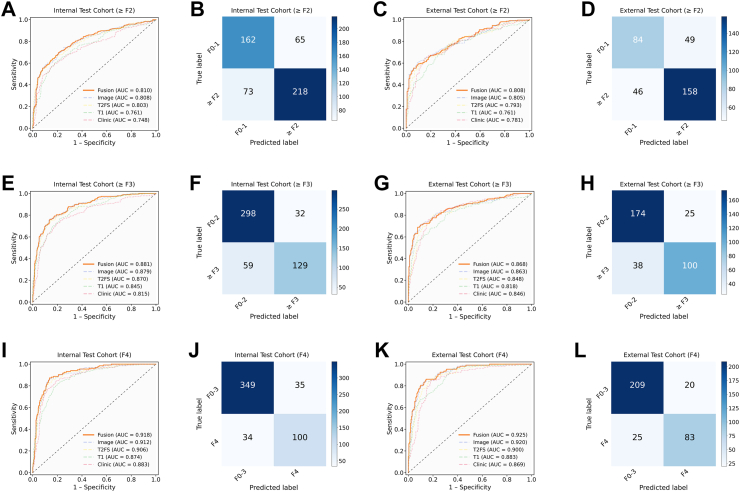
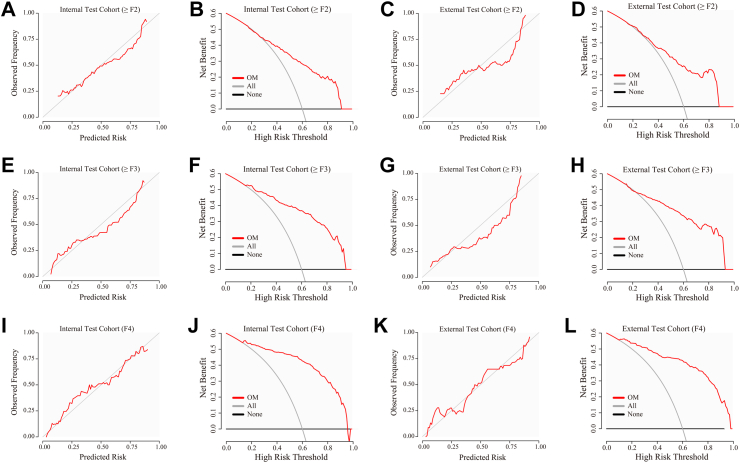
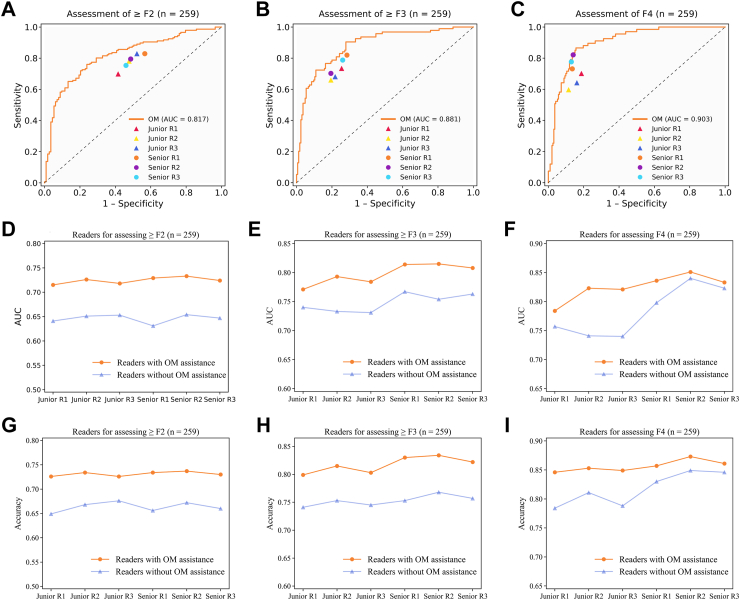
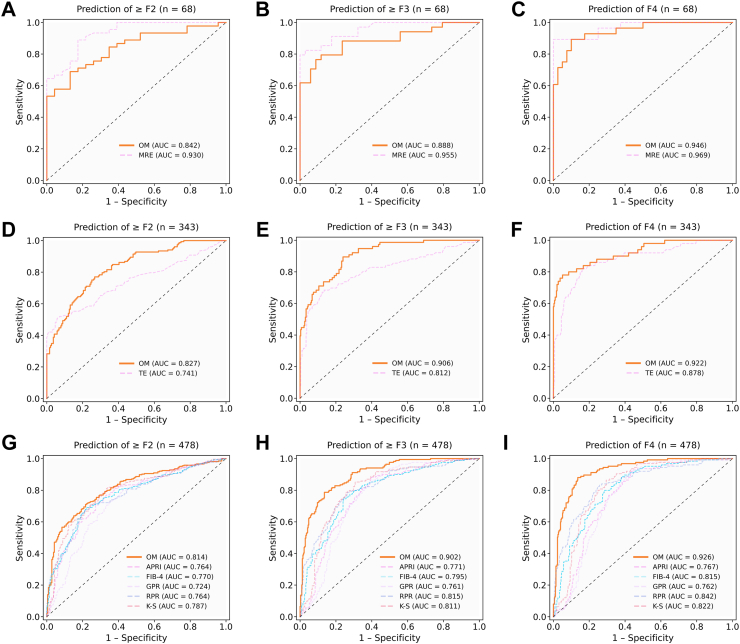
Findings: Fusion models (i.e., OM) yielded the highest AUC among the CMs, achieving AUCs of 0.810 for significant fibrosis, 0.881 for advanced fibrosis, and 0.918 for cirrhosis in the internal test cohort, and 0.808, 0.868, and 0.925, respectively, in the external test cohort. The OMs demonstrated superior performance in AUC, significantly surpassing transient elastography (only for staging ≥ F2 and ≥ F3 grades), serum biomarkers, and three junior radiologists for staging LF. Radiologists, with the aid of the OMs, can achieve a higher AUC in LF assessment.

Interpretation: AI-powered models utilizing NC-MRI, including T1WI and T2FS, accurately stage LF.

Funding: National Natural Science Foundation of China (No. 82071885); General Program of the Liaoning Provincial Department of Education (LJKMZ20221160); Liaoning Province Science and Technology Joint Plan (2023JH2/101700127); the Leading Young Talent Program of Xingliao Yingcai in Liaoning Province (XLYC2203037).

Keywords: Artificial intelligence; Liver fibrosis; Multicenter study; Non-contrast MRI.


Conflict of interest statement

We declare no competing interests related to this study.

Figures

Fig. 1
Fig. 1
Overview of the study design. (A) Data collection and research objective; (B) Development of segmentation models for the liver and spleen on NC-MRI, and five classification models for staging fibrosis grades; (C) Two reader studies on 259 cases (without and with the assistance of OMs) to assess fibrosis grades using NC-MRI; (D) A comparison between the OMs and other methods (serum fibrosis tests of 478 patients, TE of 343 patients, and MRE of 68 patients). Abbreviations: OM, optimal models; NC-MRI, non-contrast MRI; LR, logistic regression; TE, transient elastography; MRE, magnetic resonance elastography; LSM, liver stiffness measurement; Center A: Shengjing Hospital of China Medical University; Center B: Liaoning Cancer Hospital & Institute; Center C: Shandong Provincial Hospital Affiliated to Shandong First Medical University; Center D: The Second Affiliated Hospital of Baotou Medical College; Center E: Yantai Yuhuangding Hospital, Qingdao University; Center F: Hubei Cancer Hospital, Tongji Medical College; Center G: The Sixth People's Hospital of Shenyang.
Fig. 2
Fig. 2
Model performance for liver and spleen segmentation. (A) Box plot illustrating the mean DSC of the liver across each fold.; (B) Box plot illustrating mean DSC of spleen in each fold; (C) Box plot illustrating mean DSC of liver and spleen in each MRI parameter; (D) Box plot illustrating mean DSC of liver and spleen in different units; A–D, Error bars indicate 95% confidence interval; (E) Origin images and segmentation masks of F1 grade; (F) Origin images and segmentation masks of F4 grade. Abbreviation: DSC, dice Similarity Coefficient; T2FS, T2-weighted fat-suppressed imaging.
Fig. 3
Fig. 3
Performance of classification models for staging fibrosis grades. The ROC curves of five models in the internal (≥F2 at A; ≥ F3 at E; F4 at I) and the external test cohorts (≥F2 at C; ≥F3 at G; F4 at K). The confusion matrices of the OMs in the internal (≥F2 at B; ≥ F3 at F; F4 at J) and the external test cohorts (≥F2 at D; ≥ F3 at H; F4 at L). Abbreviation: OM, optimal model; ROC, receiver operating characteristic; AUC, area under the receiver operating characteristic curve.
Fig. 4
Fig. 4
Calibration and DCA curves for staging fibrosis grades. The OM for the evaluation of ≥ F2 grades in the internal (Calibration at A; DCA at B) and the external test cohorts (Calibration at C; DCA at D); the OM for the assessment of ≥ F3 grades in the internal (Calibration at E; DCA at F) and the external test cohorts (Calibration at G; DCA at H); the OM for the assessment of F4 grade in the internal (Calibration at I; DCA at J) and the external test cohorts (Calibration at K; DCA at L). Abbreviation: OM, optimal model; DCA, decision curve analysis.
Fig. 5
Fig. 5
Comparison between MRE stiffness maps and the visualization heat maps of T1 and T2FS models using Grad-CAM in different fibrosis grades. (A) Original T1 and T2FS images, segmented masks, live ROIs, heat maps, and MRE stiffness map of a case with F1 grade; (B) Original T1 and T2FS images, segmented masks, live ROIs, heat maps, and MRE stiffness map of a case with F4 grade. The fibrosis grades of the cases were confirmed using MRE. In the heat maps of the liver ROIs, red signifies higher activation, while blue represents lower activation. Abbreviation: ROIs, regions of interest; T2FS, T2-weighted fat-suppressed imaging; Grad-CAM, gradient-weighted class activation mapping; MRE, magnetic resonance elastography.
Fig. 6
Fig. 6
Performance of two reader studies using 259 samples selected from the internal test cohort, both without and with the assistance of OMs. (A–C) The readers without the assistance of OMs for ≥ F2, ≥ F3 and F4 prediction; (D–F) The AUCs of readers with the assistance of OMs for ≥ F2, ≥ F3 and F4 prediction; (G–I) The accuracy of readers with the assistance of OMs for ≥ F2, ≥ F3 and F4 prediction. Abbreviation: OM, optimal model; R1-6, radiologists with varying levels of experience; AUC, area under the receiver operating characteristic curve.
Fig. 7
Fig. 7
ROC curves of OMs and other methods (MRE: n = 68; TE: n = 343; and five serum methods: n = 478) using samples selected from the internal test cohort. (A–C) ROC curves of OMs and MRE for ≥ F2, ≥ F3 and F4 prediction; (D–F) ROC curves of OMs and TE for ≥ F2, ≥ F3 and F4 prediction; (G–I) ROC curves of OMs and five serum methods for ≥ F2, ≥ F3 and F4 prediction. Abbreviation: OM, optimal model; MRE, magnetic resonance elastography; TE, transient elastography; APRI, aspartate aminotransferase and platelet ratio index; FIB-4, liver fibrosis factor 4 index; RPR, red blood cell volume distribution width platelet ratio; GPR, γ-glutamyl transpeptidase to platelet ratio; K-S, king score; AUC, area under the receiver operating characteristic curve.

Similar articles

Cited by

References

    1. Caligiuri A., Gentilini A., Pastore M., Gitto S., Marra F. Cellular and molecular mechanisms underlying liver fibrosis regression. Cells. 2021;10(10):2759. - PMC - PubMed
    1. Kisseleva T., Brenner D. Molecular and cellular mechanisms of liver fibrosis and its regression. Nat Rev Gastroenterol Hepatol. 2021;18(3):151–166. - PubMed
    1. Ginès P., Krag A., Abraldes J.G., Solà E., Fabrellas N., Kamath P.S. Liver cirrhosis. Lancet. 2021;398(10308):1359–1376. - PubMed
    1. Tapper E.B., Ufere N.N., Huang D.Q., Loomba R. Review article: current and emerging therapies for the management of cirrhosis and its complications. Aliment Pharmacol Ther. 2022;55(9):1099–1115. - PMC - PubMed
    1. Huang D.Q., Tan D.J.H., Ng C.H., et al. Hepatocellular carcinoma incidence in alcohol-associated cirrhosis: systematic review and meta-analysis. Clin Gastroenterol Hepatol. 2023;21(5):1169–1177. - PMC - PubMed

LinkOut - more resources