. 2025 Jan;21(1):e2405832.
doi: 10.1002/smll.202405832. Epub 2024 Nov 5.

Phage-Templated Synthesis of Targeted Photoactive 1D-Thiophene Nanoparticles

Affiliations

Phage-Templated Synthesis of Targeted Photoactive 1D-Thiophene Nanoparticles

Paolo Emidio Costantini et al. Small. 2025 Jan.

Abstract

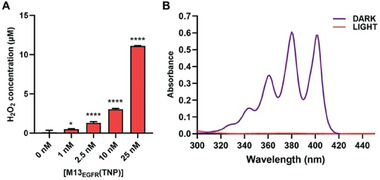
Thiophene-based nanoparticles (TNPs) are promising therapeutic and imaging agents. Here, using an innovative phage-templated synthesis, a strategy able to bypass the current limitations of TNPs in nanomedicine applications is proposed. The phage capsid is decorated with oligothiophene derivatives, transforming the virus in a 1D-thiophene nanoparticle (1D-TNP). A precise control of the shape/size of the nanoparticles is obtained exploiting the well-defined morphology of a refactored filamentous M13 phage, engineered by phage display to selectively recognize the Epidermal Growth Factor Receptor (EGFR). The tropism of the phage is maintained also after the bioconjugation of the thiophene molecules on its capsid. Moreover, the 1D-TNP proved highly fluorescent and photoactive, generating reactive oxygen species through both type I and type II mechanisms. The phototheranostic properties of this platform are investigated on biosystems presenting increasing complexity levels, from in vitro cancer cells in 2D and 3D architectures, to the in vivo tissue-like model organism Hydra vulgaris. The phage-templated 1D-TNP showed photocytotoxicity at picomolar concentrations, and the ability to deeply penetrate 3D spheroids and Hydra tissues. Collectively the results indicate that phage-templated synthesis of organic nanoparticles represents a general strategy, exploitable in many diagnostic and therapeutic fields based on targeted imaging and light mediated cell ablation.

Keywords: M13 phage; photodynamic therapy; phototheranostic platform; thiophene nanoparticles; virus‐templated synthesis.


Conflict of interest statement

The authors declare no conflict of interest.

Figures

Scheme 1
Scheme 1
A) Photoactive thiophene molecular scaffold (TM) used for the synthesis of B) human serum albumin ‐ thiophene bioconjugate (HSA‐TM); C) 3D TM‐like polymer thiophene nanoparticle (3D‐TNP) and D) phage templated 1D thiophene nanoparticle (1D‐TNP).
Figure 1
Figure 1
A) Development of phage‐derived 1‐D thiophene nanoparticles M13EGFR(TNP). M13 was first genetically engineered to target EGFR‐positive cells (M13EGFR) and then chemically conjugated with oligothiophene derivatives. B) A representative cryo‐TEM image of M13EGFR(TNP) in PBS 1x; C) Spectroscopic characterization of the M13EGFR(TNP) hybrid in PBS 1x. UV–vis spectra of M13EGFR (black line), oligothiophene derivative (green line), and purified M13EGFR(TNP) (red line). The inset shows the fluorescence spectra of the oligothiophene derivative (green line) and M13EGFR(TNP) (red line).
Figure 2
Figure 2
Photo‐dependent ROS generation of M13EGFR(TNP). A) Peroxide generation was estimated by measuring the fluorescence of resurfin, while B) singlet oxygen production was evaluated by measuring the decrease of the absorbance of the ABMDMA molecule. Statistical significance was calculated by one‐way ANOVA in comparison to the control (0 nm) * = p<0.05, **** = p<0.0001.
Figure 3
Figure 3
Targeting of the M13EGFR(TNP) and HSA‐TM bioconjugates on A431 cell line. Confocal microscopy images of cells after incubation for 45 min with M13EGFR(TNP) (A–C) or HSA‐TM bioconjugates (D–F) at equivalent carrier concentration (1 nm). A) and D) nuclei colored in cyan, B) and E) oligothiophene fluorescence in magenta, C) and F) merged images. Scale bar = 50 µm. G) Semi‐quantitative analysis of oligothiophene fluorescence intensity detected in confocal images. Flow cytometry results expressed as H) histogram of fluorescence peaks, I) mean fluorescence intensity (MFI), J) percentage of fluorescent events. Statistical significance was calculated by t‐test for the analysis performed on confocal images and by one‐way ANOVA multiple comparison for flow cytometry data, **** p<0.0001.
Figure 4
Figure 4
Cellular localization of M13EGFR(TNP) on A431 cell line. Confocal microscopy images of cells stained with Mitotracker and incubated with M13EGFR(TNP) (A–D). A) nuclei counterstained by Hoechst are shown in cyan, B) Mitotracker staining, yellow, C) oligothiophene fluorescence, magenta, D) merged images from A, B, and C. Scale bar, 10 µm. (E, F) Scatter plots representing colocalization of Mitotracker and M13EGFR(TNP) on A431 cells. Colocalization was determined in the whole cell area (E) or intracellularly (F) by excluding the signals on the cell membrane. In E‐F panels, white line is the tendency line and R show Pearson's R value calculated with Fiji Coloc2.
Figure 5
Figure 5
Photo‐dependent cytotoxicity on cancer cells treated with M13EGFR(TNP) or HSA‐TM bioconjugates. A431 cells incubated for 45 min with M13EGFR(TNP) or HSA‐TM bioconjugates, were A) kept in dark condition or B) irradiated for 10 min with white light, and cell viability was evaluated 24 h after the treatment. Data are shown as mean ± SD of 3 independent experiments and results are expressed as percentage of control (untreated – dark). C) Photo‐induced intracellular ROS generation in cancer cells treated with increasing concentrations of M13EGFR(TNP). Results are expressed as luminescence fold increase normalized on control (untreated). Statistical analysis was performed using one‐way ANOVA in comparison to the control (0 nm), * p<0.05, *** p<0.001.
Figure 6
Figure 6
Cell damage and mechanism of cell death upon bioconjugates irradiation. Real‐time monitoring of the photodamage induced by M13EGFR(TNP) on A431 cells over time. Images were acquired every 2 min from A) t = 0 min to F) t = 10 min. Panels A‐F are merged images, nuclei are stained with Hoechst and colored in cyan while M13EGFR(TNP) is colored in magenta. Scale bar = 20 µm. G) Evaluation of cell death mechanism. Percentage of living cells (white), cells undergoing apoptosis (purple), and necrotic cells (dark grey), 3 and 24 h after PDT treatment with M13EGFR(TNP). Results are expressed as mean± SD of 3 independent experiments. Statistical significance was calculated by one‐way parametric ANOVA followed by Dunnet's multiple comparison test; *** p<0.001; **** p<0.0001; n = 3.
Figure 7
Figure 7
Targeting and phototoxicity of M13EGFR(TNP) and HSA‐TM bioconjugates on 3D spheroids. Penetration into spheroid of A–C) M13EGFR(TNP) and D–F) HSA‐TM bioconjugates at a concentration of 3 nm, over time. Acquisitions were performed every 45 min for 180 min and laser settings were maintained fixed among different samples. Fluorescence of the oligothiophene derivatives is shown in magenta. Scale bar = 100 µm. I) Quantification of fluorescence intensity detected in panel (A–F). Spheroid integrity after PDT was assessed 24 h after the treatment with G) M13EGFR(TNP) or H) HSA‐TM bioconjugates, by acquiring confocal images of Hoechst (cyan) labeled spheroid. J) Spheroid viability evaluated through CellTiter‐Glo 3D Cell Viability Assay 24h after PDT treatment. Statistical analysis was performed by one‐way ANOVA multiple comparison. *** p<0.001, **** p<0.0001.
Figure 8
Figure 8
Biosafety and biodistribution of M13EGFR(TNP) in Hydra vulgaris. A) Toxicological assessment of engineered phages in dark condition. Polyps were continuously incubated with M13EGFR(TNP) at the indicated concentrations (related to the bacteriophage) and up to 72 h. Data show biosafety in every condition at every time point. Each image shows a representative polyp of a given condition. All polyps analyzed (n = 10) exhibited the same phenotype. Scale bars: 500 µm. B) In vivo biodistribution of M13EGFR(TNP) in Hydra by fluorescence imaging. Untreated polyps show the absence of tissue autoflorescence in the spectral region selected by the fluorescence microscopy filter set (BP365/12‐FT395‐LP397). Polyps treated with 0.1 nm M13EGFR(TNP) were observed after 30 min, 3 h or 24 h treatment. Each column shows for each incubation time the brightfield‐fluorescence merged images (upper row) and the fluorescence images at two magnifications of a representative polyp. 10 polyps per condition were analyzed, showing the same strong red fluorescence labeling preferentially the tentacles. Scale bars, 500 µm (upper and middle rows); 100 µm, lower row.
Figure 9
Figure 9
In vivo photodynamic treatment with M13EGFR(TNP). A) Polyps were treated with 0.1 nm of M13EGFR(TNP) and irradiated (light power density of 0.04 mW cm−2) at different durations. The images show intact head and body tissue of treated polyp before irradiation (left column) and after 5, 15, and 30 min of irradiation. Cell blebbing and damages of tentacle cells increase progressively as the irradiation time increases. 10 polyps/conditions were analyzed, showing the same damages on all tentacles. Scale bars, 200 µm (0 min and 5 min irradiation), 50 µm (15 min and 30 min irradiation) B) In vivo fluorescence imaging of a Hydra during photodynamic treatment. Brightfield (left column), fluorescence (middle), and merged (right column) images of a representative Hydra polyp treated 30 min with the M13EGFR(TNP) and irradiated for 10 min. The lower panel shows details of the region red framed in the upper panel. Clear cell lysis occurs on the tentacles, co‐localizing with the M13EGFR(TNP) fluorescence. Scale bars, 100 µm. C) Toluidine‐blue staining of tentacles showing the nematocytes organized in battery cells. D) The organization and the number of nematocytes is depleted in animals treated with M13EGFR(TNP) and progressively increase with the irradiation time. Scale bars, 200 µm. E,F) Transcriptional analysis of stress and apoptotic responsive genes in response to photodynamic treatment. Animals were treated 30 min with 0.1 nm phage, washed, irradiated 10 min, and allowed to recover 4 h before processing for RNA extraction and qRT‐PCR analysis using specific primers (see Table S1, Supporting Information). The Hydra Elongation factor 1‐alpha (Ef‐1α) was used as reference gene. Transcription levels of E) HySOD and Hsp70, and F) HyCasp‐3 and HyBcl2 genes. Data represent the mean ±SD of three technical repeats from two biological replicates (n = 15). An unpaired T‐test was used for statistical comparisons. * P<0.05, ** P<0.01, *** P<0.0001.

References

    1. Perepichka I. F., Perepichka D. F., Handbook of Thiophene‐Based Materials: Applications in Organic Electronics and Photonics, John Wiley and Sons, Hoboken, New Jersey: 2009.
    1. Barbarella G., Zangoli M., Di Maria F., Adv. Heterocycl. Chem. 2017, 123, 105.
    1. Zhang L., Colella N. S., Cherniawski B. P., Mannsfeld S. C. B., Briseno A. L., ACS Appl. Mater. Interfaces 2014, 6, 5327. - PubMed
    1. Fichou D., Handbook of Oligo‐ and Polythiophenes, John Wiley and Sons, Hoboken, New Jersey: 1998.
    1. Shao W., Yang C., Li F., Wu J., Wang N., Ding Q., Gao J., Ling D., Nanomicro Lett. 2020, 12, 147 - PMC - PubMed

Publication types

LinkOut - more resources