. 2024 Nov 15;13(11):bio060345.
doi: 10.1242/bio.060345. Epub 2024 Nov 5.

Intracellular dynamics of ubiquitin-like 3 visualized using an inducible fluorescent timer expression system

Affiliations

Intracellular dynamics of ubiquitin-like 3 visualized using an inducible fluorescent timer expression system

Yuka Terada et al. Biol Open. .

Abstract

Exosomes are small extracellular vesicles (sEVs) secreted via multivesicular bodies (MVBs)/late endosomes and mediators of cell-cell communication. We previously reported a novel post-translational modification by ubiquitin-like 3 (UBL3). UBL3 is localized in MVBs and the plasma membrane and released outside as sEVs, including exosomes. Approximately 60% of proteins sorted in sEVs are affected by UBL3 and localized in various organelles, the plasma membrane, and the cytosol, suggesting that its dynamic movement in the cell before entering the MVBs. To examine the intracellular dynamics of UBL3, we constructed a sophisticated visualization system via fusing fluorescent timers that changed from blue to red form over time with UBL3 and by its expression under Tet-on regulation. Intriguingly, we found that after synthesis, UBL3 was initially distributed within the cytosol. Subsequently, UBL3 was localized to MVBs and the plasma membrane and finally showed predominant accumulation in MVBs. Furthermore, by super-resolution microscopy analysis, UBL3 was found to be associated with one of its substrates, α-tubulin, in the cytosol, and the complex was subsequently transported to MVBs. This spatiotemporal visualization system for UBL3 will form a basis for further studies to elucidate when and where UBL3 associates with its substrates/binding proteins before localization in MVBs.

Keywords: Fluorescent timers; Multivesicular bodies (MVBs); Post-translational modification (PTM); Ubiquitin-like 3 (UBL3).


Conflict of interest statement

Competing interests The authors declare no competing or financial interests.

Figures
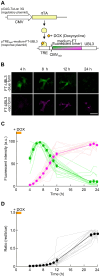
Fig. 1.
Fig. 1.
Design and construction of a system for spatiotemporal visualization of UBL3 localization. (A) Schematic diagram of plasmids and the Tet-On inducible system. The pCAG-Tet-on 3G is a regulatory plasmid containing DOX-inducible reverse tetracycline transactivator (rtTA) under the cytomegalovirus (CMV) promoter. The pTREtight-medium-FT-UBL3 is a response plasmid containing the expression cassette of UBL3 fused to the C-terminus of the medium-fluorescent timer (FT) under the promoter comprising tetracycline response element (TRE) and minimal cytomegalovirus promoter (CMV mini). The cells were transfected with pCAG-Tet-on 3G plasmid and pTREtight-medium-FT-UBL3 plasmid. When DOX was added to the medium, it bound to rtTA, which in turn was bound to TRE and induces medium-FT-UBL3 gene expression. When DOX was washed out, rtTA was dissociated from TRE, and gene expression was terminated. (B) Representative sum intensity projection sequential images of identical MDA-MB-231 cells transfected with FT-UBL3 after 4, 8, 12, and 24 h of DOX treatment. Green pseudo-color, blue form of FT-UBL3. Magenta pseudo-color, red form of FT-UBL3. Scale bar: 50 µm. (C,D) Time changes of the blue (green line and circles) and red (magenta line and circles) sum fluorescence intensities (C) and ratio value (red form/blue form) (D) of FT-UBL3-expressing cells. The orange line indicates DOX induction time window. Data are presented as mean±s.e.m. Light colored lines depict data from individual cell (n=16 cells from three independent experiments).
Fig. 2.
Fig. 2.
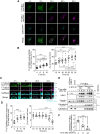
The subcellular route of UBL3 transported to multivesicular bodies. (A) Representative maximum intensity projection images of different MDA-MB-231 cells transfected with FT-UBL3 plus CD63-iRFP670 (a multivesicular body marker) after 4, 8, 14, 20, and 24 h of DOX treatment. Green pseudo-color, blue form of FT-UBL3. Magenta pseudo-color, red form of FT-UBL3. Scale bar: 20 µm. (B) Quantitative analysis of the blue (after 4, 6, 8, and 10 h of DOX treatment) and red (after 12, 14, 16, 18, 20, 22, and 24 h of DOX treatment) fluorescence intensities of FT-UBL3-expressing cells in CD63-positive MVBs. (C) Representative vertical cross-sections of different MDA-MB-231 cells transfected with FT-UBL3 and labeling of the plasma membrane using the CellMask Deep Red plasma membrane stain. Yellow squares indicate cropped areas. The white dashed lines indicate the boundary between the cytosol and the plasma membrane defined by the CellMask plasma membrane stain. Arrowheads indicate the localization of FT-UBL3. Scale bars: 5 µm and 0.3 µm. (D) Quantitative analysis of blue (after 4, 6, 8, and 10 h of DOX treatment) and red (after 12, 14, 16, 18, 20, 22, and 24 h of DOX treatment) fluorescence intensities of FT-UBL3-expressing cells in the CellMask-positive basal area. (E) Western blot analysis of cytosolic and membrane fractions of FT-UBL3 expressing MDA-MB-231 cells after 4, 8, and 24 h of DOX treatment using antibodies against Vinculin (cytosolic marker), Calreticulin (organelle membrane marker) and Caveolin 1 (plasma membrane marker). (F) Quantitative analysis of the ratio of FT-UBL3 protein in the cytosolic fraction relative to the membrane fraction, with 0.017 μg of protein. Data are presented as mean±s.e.m. Dots indicate data from individual cells (n=17–28 cells from more than three independent experiments) (B,D) or individual experiments (n=5) (F). One-way analysis of variance with Tukey's multiple comparison test. P-values are shown at the top of the graphs only for the time periods in which significant differences were found for B, D and F. ***P<0.001, **P<0.01, *P<0.05.
Fig. 3.
Fig. 3.
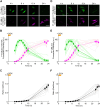
Characterization of a system for spatiotemporal dynamics of UBL3 mutants, C113/114A (lacking both UBL3 modification activity and membrane localization) and UBL3Δ1 (retaining membrane localization, lacking UBL3 modification activity). (A,D) Representative sequential images of identical MDA-MB-231 cells transfected with FT-UBL3C113/114A (A) and FT-UBL3Δ1 (D) after 4, 8, 12, and 24 h of DOX treatment. Scale bars: 50 µm. (B,E) Time changes of the blue (green line and circles) and red (magenta line and circles) sum fluorescence intensities of FT-UBL3 C113/114A (B) and FT-UBL3Δ1 expressing cells (E). (C,F) Time changes in the ratio of red form/blue form of FT-UBL3 C113/114A (C) and FT-UBL3Δ1 expressing cells (F). The orange line indicates DOX induction time window. Data are presented as mean±s.e.m. Light colored lines depict data from individual cell (n=12 cells from more than three independent experiments).
Fig. 4.
Fig. 4.
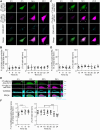
The spatiotemporal localization of UBL3C113/114A (lacking both UBL3 modification activity and membrane localization) and UBL3Δ1 (retaining membrane localization, lacking UBL3 modification activity). (A,C) Representative maximum intensity projection images of different MDA-MB-231 cells transfected with FT-UBL3C113/114A (A) and FT-UBL3Δ1 (C) plus CD63-iRFP670 (a multivesicular body marker) after 4, 8, 14, and 24 h of DOX treatment. Green pseudo-color, blue form of FT-UBL3C113/114A and FT-UBL3Δ1. Magenta pseudo-color, red forms of FT-UBL3C113/114A and FT-UBL3Δ1. Arrowheads indicate the cell periphery. Scale bars: 20 µm. (B,D) Quantitative analysis of the blue (after 4, 6, 8, and 10 h of DOX treatment) and red (after 12, 14, 16, 18, 20, 22, and 24 h of DOX treatment) fluorescence intensities of FT-UBL3C113/114A and FT-UBL3Δ1-expressing cells in CD63-positive MVBs. (E) Representative vertical cross-sections of different MDA-MB-231 cells transfected with FT-UBL3Δ1 and labeling of the plasma membrane using the CellMask Deep Red plasma membrane stain. Yellow squares indicate cropped areas. The white dashed lines indicate the boundary between the cytosol and the plasma membrane defined by the CellMask plasma membrane stain. Arrowheads indicate the localization of FT-UBL3Δ1. Scale bars: 5 µm and 0.3 µm. (F) Quantitative analysis of the blue (after 4, 6, 8, and 10 h of DOX treatment) and red (after 12, 14, 16, 18, 20, 22, and 24 h of DOX treatment) fluorescence intensities of FT-UBL3Δ1-expressing cells in the CellMask-positive plasma membrane. Data are presented as mean±s.e.m. Dots indicate data from individual cells (n=12–20 cells from more than three independent experiments). One-way analysis of variance with Tukey's multiple comparison test. P-values are shown at the top of the graphs only for the time periods in which significant differences were found for B, C, D, F, G, and H. ***P<0.001, **P<0.01, and *P<0.05.
Fig. 5.
Fig. 5.
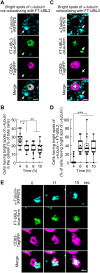
Association of UBL3 and α-tubulin, its substrate, in the cytosol and transport to MVBs. (A) Representative super-resolution images show bright spots of α-tubulin-iRFP670 with a long diameter of 200–800 nm in the cytosol, the blue form of FT-UBL3, and TagRFP-CD63 (a MVB marker). Arrowheads indicate bright spots of α-tubulin not colocalizing with FT-UBL3. Scale bar: 1 µm. (B) Quantitative analysis of the percentage of cells with bright spots of α-tubulin with a long diameter of 200–800 nm in the cytosol. (C) Representative super-resolution images show bright spots of α-tubulin-iRFP670 colocalized with the blue form of FT-UBL3 and TagRFP-CD63. Arrows indicate bright spots of α-tubulin colocalizing with FT-UBL3. Scale bar: 1 µm. (D) Quantitative analysis of the percentage of cells with bright spots of α-tubulin co-localized with FT-UBL3 in the cytosol divided by the number of cells that have bright spots of α-tubulin in the cytosol. (E) Representative super-resolution time-lapse images to track the bright spot of α-tubulin colocalized with the blue form of FT-UBL3 and TagRFP-CD63. Scale bar: 500 nm. Data are presented as min to max. Dots indicate data from independent experiments (n=14 independent experiments). Kruskal–Wallis with Dunn's test. P-values are shown at the top of the graphs. ***P<0.001, **P<0.01, and *P<0.05.

References

    1. Ageta-Ishihara, N., Miyata, T., Ohshima, C., Watanabe, M., Sato, Y., Hamamura, Y., Higashiyama, T., Mazitschek, R., Bito, H. and Kinoshita, M. (2013). Septins promote dendrite and axon development by negatively regulating microtubule stability via HDAC6-mediated deacetylation. Nat. Commun. 4, 2532. 10.1038/ncomms3532 - DOI - PMC - PubMed
    1. Ageta, H., Ageta-Ishihara, N., Hitachi, K., Karayel, O., Onouchi, T., Yamaguchi, H., Kahyo, T., Hatanaka, K., Ikegami, K., Yoshioka, Y.et al. (2018). UBL3 modification influences protein sorting to small extracellular vesicles. Nat. Commun. 9, 3936. 10.1038/s41467-018-06197-y - DOI - PMC - PubMed
    1. Ageta, H. and Tsuchida, K. (2019). Post-translational modification and protein sorting to small extracellular vesicles including exosomes by ubiquitin and UBLs. Cell. Mol. Life Sci. 76, 4829-4848. 10.1007/s00018-019-03246-7 - DOI - PMC - PubMed
    1. Ahearn, I. M., Haigis, K., Bar-Sagi, D. and Philips, M. R. (2011). Regulating the regulator: post-translational modification of RAS. Nat. Rev. Mol. Cell Biol. 13, 39-51. 10.1038/nrm3255 - DOI - PMC - PubMed
    1. Alberts, B., Wilson, J. H., Hunt, T., Heald, R., Johnson, A. D., Morgan, D. O., Raff, M. C., Roberts, K. and Walter, P. (2022). Molecular Biology of the Cell. W.W. Norton & Company.

Publication types

LinkOut - more resources