Review
. 2025 Jan;14(1):e2402571.
doi: 10.1002/adhm.202402571. Epub 2024 Nov 5.

3D-Printed Polymeric Biomaterials for Health Applications

Affiliations
Review

3D-Printed Polymeric Biomaterials for Health Applications

Yuxiang Zhu et al. Adv Healthc Mater. 2025 Jan.

Abstract

3D printing, also known as additive manufacturing, holds immense potential for rapid prototyping and customized production of functional health-related devices. With advancements in polymer chemistry and biomedical engineering, polymeric biomaterials have become integral to 3D-printed biomedical applications. However, there still exists a bottleneck in the compatibility of polymeric biomaterials with different 3D printing methods, as well as intrinsic challenges such as limited printing resolution and rates. Therefore, this review aims to introduce the current state-of-the-art in 3D-printed functional polymeric health-related devices. It begins with an overview of the landscape of 3D printing techniques, followed by an examination of commonly used polymeric biomaterials. Subsequently, examples of 3D-printed biomedical devices are provided and classified into categories such as biosensors, bioactuators, soft robotics, energy storage systems, self-powered devices, and data science in bioplotting. The emphasis is on exploring the current capabilities of 3D printing in manufacturing polymeric biomaterials into desired geometries that facilitate device functionality and studying the reasons for material choice. Finally, an outlook with challenges and possible improvements in the near future is presented, projecting the contribution of general 3D printing and polymeric biomaterials in the field of healthcare.

Keywords: advanced manufacturing; biomedical; healthcare; pharmaceutical; regenerative medicine.


Conflict of interest statement

The authors declare no conflict of interest.

Figures

Figure 1
Figure 1
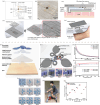
Overview of 3D printing, biopolymers, and their interactions for human health and medical applications.
Figure 2
Figure 2
Frequently used 3D printing methods for health applications: a) FDM, b) DIW, c) SLA, d) DLP, e) PBF, f) Inkjet printing/LOM.
Figure 3
Figure 3
Molecular structures of common a) synthetic biocompatible polymers and b) natural polymers.
Figure 4
Figure 4
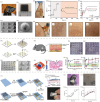
a1) EHD jetting of the sensing layer (PEO/PANI/Graphene). a2) Structure of the packaged sandwiched sensor. a3) Resistance response of the printed pressure sensor under various pressures (with 1 jetted layer and 5 jetted layers). a4) Resistance response of the sensor under 1000 loading‐unloading cycles at a frequency of 0.15 Hz. a5) Recorded pulse wave curves before and after dancing by the sensor. a6) Recorded resistance signals of cough, swallowing, and drinking. Reproduced with permission.[ 489 ] Copyright 2022, ACS. b1) Chemical sketch of copolymerization of acrylamide (Aam) with [2‐(acryloyloxy) ethyl] trimethylammonium chloride (AETA) or 3‐sulfopropyl acrylate potassium salt (SPA) using N, N’‐methylenebisacrylamide (MBA) crosslinker, which was used in the SLA printing. b2) SLA printing of stacked ionic assemblies via resin vat exchange during the 3D printing process, where the ion type, charge density, and crosslinking density within the iontronic device can vary. b3) Output voltage amplitude as a function of the applied stress, with the compartments having different ion types of SPA versus AETA at 30 mol.%. A 3D‐printed two‐compartmented finger sleeve with tactile feedback mimicking successive touches on the fingertip (b4) and the fingernail (b5) showing different sensitivities. Reproduced with permission.[ 490 ] Copyright 2023, Wiley. c1) Schematic image of in situ 3D printing of DIW on a breathing lung and real‐time tracking of the surface. c2) Layered structure of the hydrogel‐based electrical impedance tomography (EIT) sensor, with the inset image showing the silicone‐hydrogel interface bonding that enhances the robustness of the device. c3) Schematic of the peripheral operating circuitry for the sensing system. MUX, multiplexing; DC, direct current. c4) Photo of the in‐situ printing gantry system. c5) Photo of the printed circular layer of the hydrogel and the fiducial markers on the surface of the lung. c6) UV‐curing of the silicone ring to fix the embedded electrodes. c7) Results obtained via the spatiotemporal mapping of a porcine lung in two cyclic contractions. Reproduced with permission.[ 492 ] Copyright 2020, AAAS.
Figure 5
Figure 5
a1) Photograph and schematic of the multimaterial all‐3D‐printed nanocomposite‐based (M2A3DNC) capacitive pressure sensor for multiple physiological signals monitoring. a2) Schematic representation of 3D printing of the PDMS supporting layer, the MWCNT+CNT conductive layer, and the Ecoflex‐microstructured dielectric layer in 3 steps, followed by manual assembly of two printed pieces and exfoliation from the precoated PVA in a water bath. Inset: optical image of 3D printing of the hemicylinder‐patterned dielectric layer. a3) Layer schematics of the M2A3DNC sensor. a4) Optical image of the printed dielectric layer on top of the supporting and conductive layer, scale bar: 2 mm. a5) The cross‐sectional SEM image of the 3D‐printed multilayers on a double‐sided tape attached to a glass substrate. a6) The microscopic image of the dielectric grids, scale bar 100 µm. a7) Simulated Z‐axis displacement under 4 kPa for the (top) planar structured and the (bottom) microcylinder structured dielectric. a8) The capacitance changes under different pressures for the M2A3DNC sensors with and without a microstructure‐patterned dielectric layer. (a9) The photograph of the M2A3DNC sensor measuring the pressure of a water droplet (≈9 Pa), and a10) the recorded pressure of three sequentially applied water droplets. a11) The photograph of the capacitive sensor on a human abdomen, measuring a12) the breathing waves with different breathing tempos. a13) Optical image of the sensor on a human's throat, recording the acoustic vibrations of the larynx when saying a14) “Hi” and a15) “How are you”. Reproduced with permission.[ 494 ] Copyright 2021, Wiley. b1) Schematic image of aerosol jet printing of the Ag electrode layer with an ultrasonic atomizer and a multilayer capacitance sensor implanted in an aneurysm model. b2) Circuit overview and example of received wireless signals in on‐ and off‐resonance cases. Photographs of b3) a zoomed‐out overview of the sensor, b4) zoomed‐in views of the capacitive sensor, b5) the sensor with a copper coil for wireless monitoring of hemodynamics in an in vitro study. b6) Pulsatile flow captured by the sensor, where the average capacitance increased with flow velocities from 0.05 (left) to 0.35 (right) m s−1. The schematic demonstrates that the increased capacitance resulted from the increased blood flow into the aneurysm. Reproduced with permission.[ 500 ] Copyright 2019, Wiley. c1) Schematic of the insole with four inductor‐capacitor (LC) sensors positioned beneath cylindrical origami blocks 3D printed via the FDM method. c2) Descriptive schematics showing different directions of origami for the (left) overall insole part and the (right) cylindrical pressure sensing part. c3) The Miura‐ori foldcore unit. c4) 3D images demonstrate the deformation of the origami block with conductive serpentines (pink) under pressure. c5) Experiment setup of the sensor‐embedded insole and two antennas (green) connected to the vector network analyzer (VNA). Photographs of the deformed insole with pressure (c6) on the forefoot and the (c7) hindfoot. c8) Pressure mapping of two postures with a higher pressure applied to the hindfoot than the forefoot (left) and a higher pressure applied to the forefoot than the hindfoot (right). c9) Resonant frequency changes (Δfr) regarding the pressure applied on (top) forefoot position and (bottom) hindfoot position (scale bars: 10 mm). Reproduced with permission.[ 502 ] Copyright 2022, Springer Nature.
Figure 6
Figure 6
a1) Schematic of a conventional planar microfluidic concentration gradient generator (µ‐CGG). a2) The limitation of 2D µ‐CGGs, where inputs 1 and 3 form no combinations. a3) The advantage of a 3D microchannel network, which can generate symmetric 3D gradients of three input fluids. a4) Reverse solids model of the 3D microfluidic channels. a5) Photograph of the printed 3D µ‐CGG. a6) Schematic of the experiment setups for conducting the antimicrobial susceptibility testing (AST) screening of three antibiotics with the 3D µ‐CGG. Bacterial proliferation would be carried out in the fluids collected from the outlets with various antibiotic gradients. a7) The manufacturing process of Multijet 3D printing. a8) Three‐antibiotic interaction study, showing (left) E. coli proliferation profiles with fluid collected from 13 outputs and (right) illustration of the 3D channels and the number of outlets. Reproduced with permission.[ 508 ] Copyright 2020, Springer Nature. b) Schematic illustration of the 3D‐printed microfluidic device (via inkjet 3D printing) for the isolation of circulating tumor cells (CTCs), including the simulated velocity magnitude and particle tracing, and the surface function of the printed parts. Reproduced with permission.[ 509 ] Copyright 2020, Elsevier. c1) The technical drawing of the microfluidic platform for Multijet 3D printing. c2) Schematic of the gradient generation unit, with the black numbers indicating the channel length ratios and white numbers indicating the relative concentrations of the antibiotics. c3) Photograph of the printed gradient generator (GG). c4) The computational fluid dynamic (CFD) simulation of the antibiotic concentration using COMSOL. The total flow rate was 1000 µL min−1. c5) Photograph showing the GG outlets of a two‐fold dilution series of dye (reservoir A) and water (reservoir B). c6) CFD simulation and experimental results of the relative concentrations at the six outlets. The source solutions include a blue dye, glucose, and ciprofloxacin. Error bars represent the standard deviation from three consecutive experiments. Reproduced with permission.[ 510 ] Copyright 2022, Royal Society of Chemistry.
Figure 7
Figure 7
a1) Top‐view schematic of the all‐inclusive integrated wearable (AIIW) patch from the DIW 3D printing. a2) Photograph of the AIIW patch, consisting of 3D printed ion sensors and a wearable‐microfluidic sample handling (WMFSH) unit. a3) Schematic of the components of the AIIW patch before and after assembly. a4) Cross‐section of the AIIW patch attached to human skin. a5) Individual components of the AIIW patch, including 3D printed electrodes, PDMS substrate, electrodes membrane, adhesive layer, and WMFSH unit. Reproduced with permission.[ 518 ] Copyright 2021, Wiley. b1) Schematic illustration of the key components of the sweatainer system and epidermal interface via the DLP 3D printing technique. b2) Structural detail of the sweatainer, including the inlet, capillary burst valves (CBVs), collection reservoirs, and ventilation holes. b3) Schematic renders of four designs of CBVs, with the blue areas highlighting the differences between the CBV designs. b4) Calculated bursting pressures (BPs) as a function of channel size for a square geometry using the Young‐Laplace equation. b5) Theoretical BP as a function of diverging angle β for a channel with a width of 600 µm and a height of 400 µm. b6) Sequence of photographs illustrating the liquid entering the chambers of different CBV designs in order. b7) Photograph of sweatainer position on the exerciser's skin. b8) Measured chloride concentration from both the collection (chloridometer) and colorimetric sweatainers for three independent exercises (stationary cycling for 50 min). Reproduced with permission.[ 520 ] Copyright 2023, AAAS.
Figure 8
Figure 8
a1) SLA platform that manufactured the microneedles. a2) Photograph of the 3D‐printed hollow microneedle (HMN) array. SEM images of a3) the HMN array (scale bar: 1 mm) and a4) a single HMN (scale bar: 500 µm). a5) Photograph of the microneedle (MN) pH sensor attached to the forearm. a6) Potentiometric response of the MN pH sensor from both the in vitro calibration (left) and the on‐body experiment (right). a7) Temperature correction of the recorded interstitial fluid pH. a8) Effect of the piercing of the MN sensor on the skin after the test. Reproduced with permission.[ 526 ] Copyright 2023, Elsevier. b1) Illustration of the fabrication process of the MN patches, including 3D printing, stretching, spraying of Ca2+ ions, and dehydration. b2,b3) SEM images of the MN patch. b4) Schematic of the MN patch working on the dorsal skin of a mouse. b5) Photograph of the mouse skin pierced by the MN for 10 min. b6) Trypan blue staining, b7) 3D optical profiler image, and b8) H&E staining image of the pierced mouse skin. In vivo blood glucose monitoring with the MN sensor of the mice within b9) 5 h and b10) 4 days. Reproduced with permission.[ 529 ] Copyright 2020, Elsevier. c1) Fabrication process of the MN biosensor. c2) Schematic of the MN array inserted into the dermis. c3) Photograph of the 3D‐printed cone‐shaped MNs with a base diameter of 400 µm and a height of 1.5 mm. c4) Photograph of the MN array applied to a mouse. c5) Magnified image of the mouse skin pieced by the MN array biosensor. c6) In vitro sensing of glucose in different PBS solutions. (C1: 0.8 mM, C2: 2.2 mM, C3: 3.0 mM, C4: 6.0 mM, C5: 12 mM, C7: 14 mM) (c7) In vivo sensing of subcutaneous glucose in a mouse injected with glucose. Reproduced with permission.[ 531 ] Copyright 2021, Springer Nature.
Figure 9
Figure 9
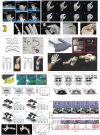
a1) Resin composition for the soft and rigid materials for SLA. a2) Process flow for the multi‐material SLA printing. a3) Design of a 3D‐printed microactuator chip with an air inlet on the side. The size of the chip was 20 mm × 20 mm × 3 mm, with a soft membrane of 200 µm thickness. a4) The unactuated state of the chip has an flat surface, while the inflated state of the chip features the soft membrane protruding and expanding. Reproduced with permission.[ 541 ] Copyright 2023, MDPI. b1) Chemical schematic of vinyl‐terminated silicones, blended with a thiol‐crosslinker, fumed silica as rheology modifier, flax fibers as reinforce filler, and a photoinitiator. b2) The multimaterial direct ink writing seamlessly used to produce the actuators in a single print. b3) Geometry and parameters of the actuator in twisting mode. b4) Actuator in contraction mode, where stiff strips were along the long axis of a soft silicone tube (lead angle α = 0°). b5) A bender was obtained by printing soft silicone chambers onto a stiff silicone film. Inflating the air cavities with a pressure of 6 kPa resulted in bending angles up to 90°. b6) A grabbing actuator consisted of a larger stiff silicone cylinder and a concentric inner soft tube that could be inflated. b7) A twisting motion was achieved by winding slanted stiff strips around the soft inner tube, with α = 45° as an example. The twisting angle increased with the applied internal air pressure. b8) Demonstration of the grabbing and contractile actuators bearing loads. Scale bars are 2 cm for b4‐b7 and 4 cm for b8. Reproduced with permission.[ 545 ] Copyright 2018, Springer. c1) Multiphase direct ink writing (MDIW) printing nozzle design, including the spinneret, minimizer, layer multiplier, and reducer. UV‐assisted printing along the in‐plane c2) x‐axis and c3) y‐axis. c4) An optical and digital photograph of thin‐ply stacking films with 2 and 10 printed layers. Scale bar is 500 µm. c5) 90°‐rolled 5‐layered composites expanded as a function of time on a hot plate of 60 °C. Scale bar is 1 cm. c6) Thermal images showing temperature distributions during the expansion of the composites.[ 37 ] Copyright 2022, Elsevier. d1) Fabrication of the soft somatosensitive actuator (SSA), including the curvature sensor printed within the dorsal matrix (Layer 1); the actuator features and the inflation sensor printed within the actuator matrix (Layer 2); and the contact sensor printed in the anterior matrix (Layer 3). d2) Schematic demonstration and d3) images under black light exposure of the manufactured SSA, with the fugitive and sensor inks dyed blue and red, respectively, to facilitate visualization. Scale bars are 1 cm. d4) Resistance change of the curvature, inflation, and contact sensors and displacement angle as a function of inflation pressure without blockage. d5) Photographs of an SSA at 0 kPa (top) and 152 kPa (bottom) during a dynamic free displacement test. d6) The corresponding ΔR for each sensor as a function of time, where the 0 kPa and inflation pressures were held for 20 s, respectively, with the increasing inflation pressure in increments of 14–152kPa. d7) Images of the gripper grabbing a ball and then being pulled away. d8) The corresponding ΔR of each sensor during the interaction shown in (d7). Reproduced with permission.[ 546 ] Copyright 2018, Wiley.
Figure 10
Figure 10
a1) The time lapse of FDM printing of the prosthetic hand. a2) Finger movement for performing pinch grasp. a3) Schematic of the corner‐filleted flexure joint. a4) Photograph of a printed finger with three corner‐filleted flexure joints. Details of the printed finger including a5) the fingernail and a cavity in the fingertip for higher contact surface area in pinch grasp, and a6) the teeth‐like surface on the index fingertip and the thumb for stable grasp. Photographs of the printed hand a7) performing a tripod grasp and a8) grasping a fragile, spherical object. Reproduced with permission.[ 552 ] Copyright 2020, PLOS. b1) Illustration of the mechanism of the 3D‐printed pneumatic actuator, whose asymmetrical strain was caused by the constant length of the strain limiting layer (L2) and the increased length of the inflated serpentine (L1). b2) Image analysis for calculating the curvature indices of four printed designs, all pressurized at 200 kPa. b3) Schematic of the gripper with four printed actuators bending inward picking up b4) an orange. b5) Schematic of the gripper with outward facing actuators grasping b6) inside of a cylindrical can. b7) CAD model of the assistive glove. b8) Components of a rehabilitative device, including the 3D‐printed actuators, that use electromyography muscle signals for control. b9) The 3D‐printed assistive glove facilitating hand grasping. Reproduced with permission.[ 555 ] Copyright 2018, Wiley. c1) Conceptual illustration of the multimaterial PolyJet 3D printing of the fluidic circuitry embedded robots, using rigid (white), compliant (black), and sacrificial (yellow) materials. c2) Time‐lapse images of the corresponding 3D printing process. Scale bar, 2 cm. c3–c5) Operation principles of the 3D‐printed fluidic diode. The architecture of the diode in its c3) resting state, c4) “forward flow” state, and c5) “reverse flow” state. c6) Experiment data of the directional flow rate versus pressure for the printed diode. c7–c10) Operation principles of the 3D‐printed normally closed fluidic transistor. The architecture of the normally closed transistor in its c7) resting state, c8) “closed” state, c9) “open” state, and c10) “reclosed” state, where Ps is the input source pressure, and PG is the input gate pressure which could be low and high. c11–c13) Operation principles of the 3D‐printed normally open fluidic transistor. c11) The architecture of the normally open transistor in its c11) resting state, c12) “open” state, and c13) “closed” state. c14–c17) Conceptual illustration of the aperiodic fluidic input‐based soft robotic hand and analogous circuit diagrams of the integrated fluidic circuitry. Four primary states are shown, with a constant Ps input and different PG magnitudes. The integrated normally open fluidic transistors possessed distinct pressure‐gains (γ) (γ1 < γ2 < γ3). Photographs of a soft robotic finger with a γ3 transistor under Ps = 20 kPa, with PG = (c18 left) 0 kPa and (c18 right) 20 kPa. c19) Recorded fingertip actuation force versus PG, driven by the fluidic transistor systems with three different γ and constant Ps of 10 kPa. c20) Demonstration of the robotic hand playing the Super Mario Bros. video game controlled by a preprogrammed PG input (Ps remained constant). Insets include the game state and the corresponding controller activation state as well as the photograph of the robotic hand pressing the controller in real time. Reproduced with permission.[ 556 ] Copyright 2021, AAAS.
Figure 11
Figure 11
a1) Photograph of the FDM printed gill‐mimicking substrate and schematic image of the π‐π interaction between PANI and MWCNTs. a2) Simulated temperature distribution of thermoelectric generators with the gill‐mimicking morphology (top) and a flat design (bottom) with the bottom surface in contact with the skin. a3) Voltage generated when the thermoelectric generator (TEG) was attached to a human forearm. a4) Recorded voltage variation as a function of finger bending, with the inserted circuit diagram of the sensing system and the photo showing finger gestures. a5) Voltage change as a response to the chest movement during respiration, with the zoomed‐in figure demonstrating the breathing cycles between 35 and 70 seconds and the photo of the setup. Reproduced with permission.[ 583 ] Copyright 2021, Royal Society of Chemistry. Schematic of b1) the functionalization of the BTO nanoparticles and the photopolymerization during the µCLIP and b2) the µCLIP setup. b3) Photograph of a 30 wt% functionalized BTO octet‐truss lattice structure, scale bar: 1 mm (left). Recorded voltage signals during the tapping test (middle) and the press‐and‐release test (right). Reproduced with permission.[ 585 ] Copyright 2022, AAAS. c1) Schematic of the electrical field‐assisted FDM platform, with the inserted demonstration of the functionalized KNN nanoparticles and the PVDF matrix (left), and rapid poling of the extruded composite with an inner‐built electric field. c2) Schematic illustration of the implanted piezoelectric sensor with the sinusoidal lattice in response to blood pressure. c3) Fluorescence microscope images of the 3T3 fibroblasts cultured both on KNN/PVDF film and artificial artery, scale bar: 100 µm. c4) Real‐time pressure change in the artificial artery system using a syringe pump to drive the PBS‐simulated blood flow (top), and the corresponding voltage output (bottom). c5) Voltage output in response to a series of pressures in the artery system.[ 586 ] Copyright 2020, Wiley. d1) Schematic illustration of the production of the self‐powered toroidal triboelectric sensor (STTS). d2) Schematic diagram of the muscle contraction and nodal expansion during finger flexion, and the charge generation and current flow of the STTS in the finger bending cycles. d3) Voltage generated by the STTS by 5 Hz external load. d4) STTS assembled with a 3D‐printed flexible glove. d5) Photograph of a hand wearing the glove with STTS, with the inserted photo of a single sensor. Finger bent d6) and released d7) wearing the glove, resulting in one output cycle. d8) Output voltage of the STTS glove with different bending angles of the finger. d9) Photograph of controlling robotic hands with the STTS glove. Reproduced with permission.[ 587 ] Copyright 2022, Elsevier.
Figure 12
Figure 12
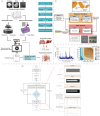
a) Scheme of employing machine learning to predict the relationship between the mechanical properties of the composite ink and the printability, guiding the design of 3D‐printable bioinks comprised of natural polymers. Reproduced with permission.[ 597 ] Copyright 2020, IOP Publishing. b) Bayesian optimization framework used to evaluate printability and optimize the concentrations of gelatin methacryloyl (GelMA) and hyaluronic acid mechacrylate (HAMA). Reproduced with permission.[ 598 ] Copyright 2020, Elsevier. c) Hotelling T2 control chart to identify printing anomalies (left) and anomaly rate contour revealing the relationship between the printing quality and the printing parameters (right). Reproduced with permission.[ 93 ] Copyright 2023, Wiley. d) Overview of the image and data processing regarding the printed line analysis. Reproduced with permission.[ 599 ] Copyright 2020, Elsevier.

References

    1. Woolf S. H., Schoomaker H., JAMA, J. Am. Med. Assoc. 2019, 322, 1996. - PMC - PubMed
    1. Someya T., Amagai M., Nat. Biotechnol. 2019, 37, 382. - PubMed
    1. Wang Y., Haick H., Guo S., Wang C., Lee S., Yokota T., Someya T., Chem. Soc. Rev. 2022, 51, 3759. - PubMed
    1. Bhalla N., Jolly P., Formisano N., Estrela P., Essays Biochem. 2016, 60, 1. - PMC - PubMed
    1. da Silva Neves M. M. P., González‐García M. B., Hernandez‐Santos D., Fanjul‐Bolado P., Curr. Opin. Electrochem. 2018, 10, 107.

MeSH terms

LinkOut - more resources