. 2024 Dec 1;17(12):dmm052005.
doi: 10.1242/dmm.052005. Epub 2024 Nov 29.

Modelling quiescence exit of neural stem cells reveals a FOXG1-FOXO6 axis

Affiliations

Modelling quiescence exit of neural stem cells reveals a FOXG1-FOXO6 axis

Kirsty M Ferguson et al. Dis Model Mech. .

Abstract

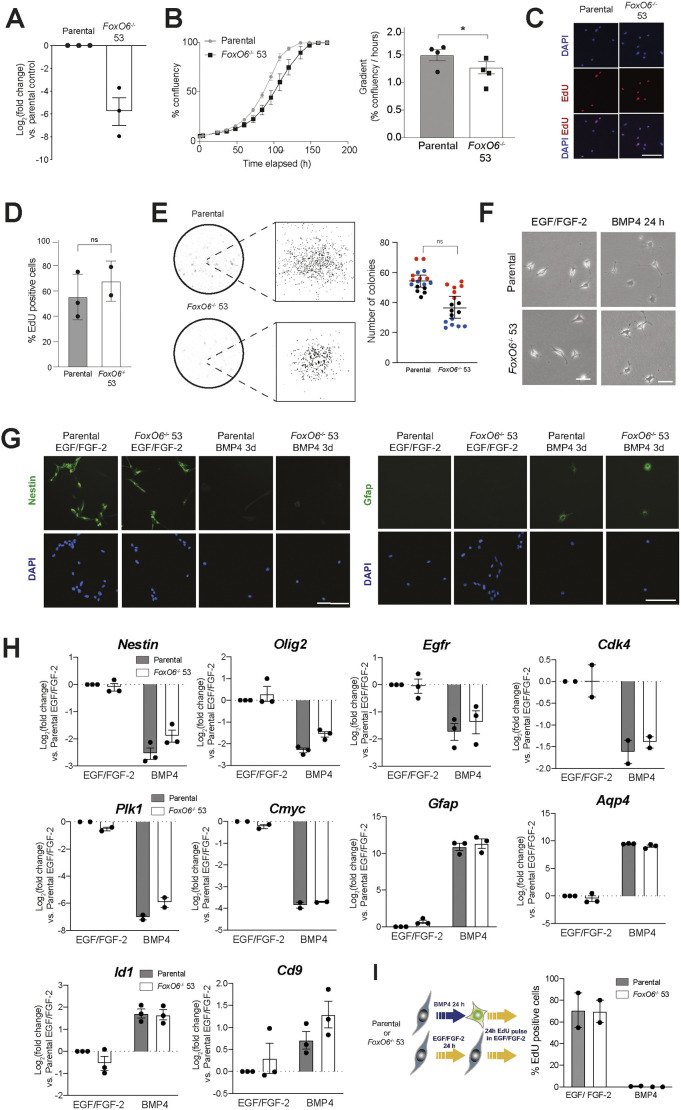
The molecular mechanisms controlling the balance of quiescence and proliferation in adult neural stem cells (NSCs) are often deregulated in brain cancers such as glioblastoma multiforme (GBM). Previously, we reported that FOXG1, a forebrain-restricted neurodevelopmental transcription factor, is frequently upregulated in glioblastoma stem cells (GSCs) and limits the effects of cytostatic pathways, in part by repression of the tumour suppressor Foxo3. Here, we show that increased FOXG1 upregulates Foxo6, a more recently discovered FOXO family member with potential oncogenic functions. Although genetic ablation of Foxo6 in proliferating NSCs had no effect on the cell cycle or entry into quiescence, we found that Foxo6-null NSCs could no longer efficiently exit quiescence following FOXG1 elevation. Increased Foxo6 resulted in the formation of large acidic vacuoles, reminiscent of Pak1-regulated macropinocytosis. Consistently, Pak1 expression was upregulated by FOXG1 overexpression and downregulated upon FOXO6 loss in proliferative NSCs. These data suggest a pro-oncogenic role for FOXO6, downstream of GBM-associated elevated FOXG1, in controlling quiescence exit, and shed light on the potential functions of this underexplored FOXO family member.

Keywords: FOXG1; FOXO6; Glioblastoma; Neural stem cell; Pak1; Quiescence.


Conflict of interest statement

Competing interests The authors declare no competing or financial interests.

Figures

Fig. 1.
Fig. 1.
Elevated FOXG1 transcriptionally activates Foxo6 in mouse neural stem cells (NSCs) and glioblastoma stem cells. (A) Quantitative real-time PCR (qRT-PCR) analysis of FOXG1 transgene and endogenous Foxo6 expression in two independent adult mouse NSC lines [F6 (left) and F11-19 (right)] with doxycycline (Dox)-inducible FOXG1-V5 expression grown in NSC medium with or without Dox for 24 h. Expression shown relative to −Dox [in which log2(fold change)=0]. Mean±s.e.m. The y-axis shows log2(fold change). n=2/3 independent experiments for F6 and F11-19, respectively. Each data point shows the mean of one experiment performed in technical duplicates. Two-tailed one-sample t-test. *P≤0.05. (B) Schematic of homology-directed repair-mediated knock-in of a haemagglutinin (HA) epitope tag at the 3′ end of the last Foxo6 coding exon in F6 cells. PCR genotyping of the bulk transfected F6 cell population revealed a 196 bp product, indicating the presence of cells with insertion of the HA tag at the 3′ end of Foxo6. (C) Wide-field immunofluorescent images following immunocytochemistry (ICC) of FOXO6-HA (red) and DAPI (blue) in the tagged F6 NSCs following Dox addition for 4 days in EGF/FGF-2. Scale bar: 100 μm. (D) Western blot analysis of FOXG1-V5 and FOXO6-HA protein expression in tagged F6 NSCs following Dox addition for 4 days in EGF/FGF-2. GAPDH was used as a loading control. (E) Experimental strategy for Foxg1 deletion in IENS-GFP cells. Yellow triangles show the target sites of the sgRNAs at either the 5′ or 3′ end of the coding exon. PCR genotyping of parental IENS-GFP cells and Foxg1 knockout (KO) clonal cell lines (KO 58 and KO 59). Wild-type PCR product, ∼2.6 kb; KO PCR product, ∼1.3 kb. (F) ICC confirms the loss of FOXG1 protein expression in IENS-GFP Foxg1 KO clonal lines (KO 58 and KO 59). Scale bar: 100 μm. (G) Western blot analysis confirming the loss of FOXG1 protein in the two independent IENS-GFP KO clonal lines (KO 58 and KO 59). GAPDH was used as a loading control. (H) qRT-PCR analysis of Foxo6 and Ki67 expression in IENS-GFP Foxg1 KO clonal lines, compared to parental IENS-GFP [in which log2(fold change)=0]. Mean±s.e.m., n=3 independent experiments. Each data point shows the mean of one experiment performed in technical duplicates. Two-tailed one-sample t-test. *P≤0.05.
Fig. 2.
Fig. 2.
FOXG1 induces Foxo6 during quiescent NSC reactivation. (A) Schematic of the experimental design for assessing FOXG1-induced reactivation of quiescent NSCs and associated changes in gene expression, using clonal F6 adult mouse NSC line with Dox-inducible FOXG1-V5 expression. Non-BMP4-treated control=cells in NSC medium with EGF/FGF-2. (B) ICC for V5, confirming FOXG1-V5 expression upon Dox addition (scale bar: 100 μm). (C) Representative phase-contrast images showing changes in cell morphology upon addition of Dox (scale bar: 100 μm). (D) Colony formation after 24 h BMP4 treatment followed by 10 days in EGF/FGF-2 with or without Dox. Representative images shown of wells stained with Methylene Blue and imaged on a bright-field microscope. n=3 independent experiments. (E) Higher-magnification phase-contrast images of representative colonies after 24 h BMP4 treatment and 10 days in EGF/FGF-2 with or without Dox as in D (scale bars: 200 μm). (F) Number of colonies formed after 24 h BMP4 treatment and 10 days in EGF/FGF-2 with or without Dox. Mean±s.d., n=3 independent experiments. Each data point shows the mean of one experiment performed in technical triplicates. (G,H) qRT-PCR analysis of human FOXG1 transgene (G) and Foxo6 (H) expression during the reactivation time course. Expression shown relative to non-BMP4-treated (EGF/FGF-2) control [in which log2(fold change)=0 (dotted line)]. The y-axis shows log2(fold change). Day (d)0=expression after 24 h BMP4 treatment. Mean±s.e.m., n=2 (FOXG1) or 4 (Foxo6). Each data point shows the mean of one experiment performed in technical duplicates. Two-way ANOVA with Sidak correction. ****P≤0.0001.
Fig. 3.
Fig. 3.
FOXO6 is not required for continued NSC proliferation or response to BMP4. (A) qRT-PCR analysis of Foxo6 mRNA levels in Foxo6 KO clonal cell line 53, compared to ANS4 parental cells [in which log2(fold change)=0]. Expression values were normalised to Gapdh. The y-axis represents log2(fold change). Mean±s.e.m., n=3 independent experiments. Each data point shows the mean of one experiment, performed in technical duplicates. (B) Left: growth curve analysis of parental and Foxo6 KO 53 clonal cells in EGF/FGF-2. Mean±s.d., n=3 technical replicates. Representative of n=4 independent experiments. Right: graph showing the gradient of the linear portion of the logistic growth curve (%/h). Mean±s.e.m., n=4 independent experiments. Two-tailed paired Student's t-test. *P≤0.05. (C) 5-Ethynyl 2′-deoxyuridine (EdU) incorporation assay (24 h pulse) in EGF/FGF-2 for parental and FOXO6 KO 53 cells. Representative fluorescent images of EdU incorporation after 24 h pulse. Scale bar: 100 μm. (D) EdU incorporation assay (24 h pulse) in EGF/FGF-2 for parental and FOXO6 KO 53 cells. Plot shows mean±s.e.m., n=3 independent experiments. Each data point shows the mean of one experiment performed in technical triplicates. Two-tailed paired Student's t-test. ns, not significant. (E) Left: brightfield images of colony formation by parental or FOXO6 KO 53 cells 10 days after plating at low density in NSC medium (EGF/FGF-2). Plates stained with Methylene Blue. Right: quantification of colony formation in parental or FOXO6 KO 53 cells. Each dot represents one technical replicate (n=5/6). Mean±s.e.m., n=3 biological replicates, coloured in red, blue or black. Two-tailed paired Student's t-test. ns, not significant. (F) Representative phase-contrast images showing morphology of ANS4 and Foxo6 KO 53 in EGF/FGF-2 medium and after 24 h BMP4 treatment. Scale bar: 25 μm. (G) ICC analysis of NES and GFAP expression in ANS4 parental and FOXO6 KO 53 cells in EGF/FGF-2 or after 3 days’ BMP4 treatment at low density. Scale bars: 100 μm. (H) qRT-PCR analysis of NSC (Nes, Olig2, Egfr), cell cycle (Plk1, Cdk4, cMyc) and astrocyte/quiescence (Gfap, Aqp4, Id1, Cd9) markers, in parental and FOXO6 KO 53 cells in EGF/FGF-2 and after 24 h BMP4 treatment. Expression shown relative to parental in EGF/FGF-2 [in which log2(fold change)=0]. Mean±s.e.m., n=2/3 independent experiments. Each data point shows the mean of one experiment performed in technical duplicates. (I) Left: schematic of the experimental design for determining EdU incorporation after treatment with BMP4 or EGF/FGF-2 for 24 h, followed by a 24 h EdU pulse in EGF/FGF-2. Right: quantification of EdU-positive cells in EGF/FGF-2 and after 24 h BMP4 treatment. Mean±s.e.m., n=2 independent experiments. Each data point shows the mean one experiment, performed in technical triplicates.
Fig. 4.
Fig. 4.
FOXG1-induced reactivation of quiescent NSCs is inhibited upon Foxo6 loss. (A) qRT-PCR analysis of FOXG1 transgene expression in parental or FOXO6 KO 53 cells engineered with inducible FOXG1-V5 after 24 h BMP4 and return to EGF/FGF-2 with or without Dox for 4 days. Expression shown relative to parental non-BMP treated (EGF/FGF-2) control [in which log2(fold change)=0 (dotted line)]. Mean±s.e.m., n=5 independent experiments. Each data point shows the mean of one experiment performed in technical duplicates. Two-tailed paired Student's t-test. ns, not significant. (B) Representative ICC images showing FOXG1-V5 expression after 24 h BMP4 treatment and 4 days in EGF/FGF-2, with or without Dox, in parental and FOXO6 KO 53 cells with inducible FOXG1-V5. Scale bar: 100 μm. (C) Percentage of parental or FOXO6 KO 53 cells with inducible FOXG1 expressing FOXG1-V5 (assessed by ICC) after 24 h BMP4 treatment and 4 days in EGF/FGF-2, with or without Dox. Mean±s.e.m., n=4 independent experiments. Each data point shows the mean of one experiment performed in technical triplicates. Two-tailed paired Student's t-test. ns, not significant. (D) Representative images of colony formation assay with parental and FOXO6 KO 53 cells at day 10 in EGF/FGF-2, with or without Dox. Plates stained with Methylene Blue following fixation. (E) Numbers of colonies formed after 24 h BMP4 treatment and 10-15 days in EGF/FGF-2, with or without Dox as in D. Mean±s.e.m., n=4 independent experiments. Each data point shows the mean of one experiment performed in technical triplicates. Two-tailed paired Student's t-test. **P≤0.01. (F) Percentage of the well area covered by cells after 24 h BMP4 treatment and 10-15 days in EGF/FGF-2, with or without Dox as in D. Mean±s.e.m., n=4 independent experiments. Each data point shows the mean of one experiment performed in technical triplicates.
Fig. 5.
Fig. 5.
Elevated FOXO6 induces the formation of large acidic vacuoles by macropinocytosis. (A) Western blotting (left) and ICC (right) confirming expression of FOXO6-HA transgene following 24 h Dox treatment. Image inset highlights the appearance of vacuoles in FOXO6-HA-overexpressing cells (+Dox). Scale bars: 100 μm or 25 μm (inset). GAPDH is used as a housekeeping loading control. (B) Left: ICC of FOXO6-HA overexpression showing vacuolisation upon Dox addition to clonal NSC lines with Dox-inducible Foxo6-HA-IRES-mCherry expression. Scale bar: 50 μm. Right: qRT-PCR for FOXO6-HA expression in clonal cell lines (mean±s.d., technical duplicates; −Dox=0 for each clonal line). (C) Live imaging following Dox addition to clonal NSCs with Dox-inducible Foxo6-HA-IRES-mCherry expression (C71). Dox was added 4 h prior to imaging. Images were obtained every 10 min for ∼18 h. Scale bars: 100 μm or 25 μm (insets). (D) Imaging of LysoView-488 accumulation in clonal FoxO6-inducible cell line (C71) with or without Dox addition (2 days). Scale bars: 50 μm or 10 μm (insets). (E) ICC for lysosomal marker LAMP1 and early endosomal marker EEA1 to visualise colocalisation with vacuoles (arrowheads) (C59, following overnight Dox incubation). Scale bar: 25 μm. (F) Live imaging of 70 kDa FITC-dextran uptake and mCherry expression following incubation with Dox overnight in FOXO6-inducible cell line (C59). Scale bar: 25 μm. (G) Flow cytometry-based quantification of 70 kDa FITC-dextran uptake following incubation with Dox overnight in FOXO6-inducible cell lines (6, 59, 71). Samples displayed are +Dox −Dextran control (orange), −Dox +Dextran (blue) and +Dox +Dextran (red). Gating shows ‘Dextran high’ population. Percentages represent the increase in ‘Dextran high’ cells upon Dox addition.
Fig. 6.
Fig. 6.
Pak1 expression is upregulated upon FOXG1 elevation and downregulated upon FOXO6 loss in proliferative NSCs. (A) qRT-PCR analysis of FOXG1 transgene, and endogenous Foxo6 and Pak1 expression in F6 cells with Dox-inducible FOXG1-V5 grown in EGF/FGF-2 for 24 h with or without Dox (n=2 biological replicates, mean±s.e.m.; each data point shows the mean of one experiment performed in technical duplicates). (B) Western blot analysis of Pak1 expression in F6 cells treated with Dox in EGF/FGF-2 for 24 h. GAPDH is used as a loading control. Quantification of Pak1 bands normalised to GAPDH and −Dox control shown, where −Dox=1. (C) qRT-PCR analysis of Pak1 expression in ANS4 parental versus FOXO6 KO clones 6, 53 and 62 (n=3 biological replicates, mean±s.e.m.; each data point shows the mean of one experiment performed in technical duplicates). Two-tailed one-sample t-test. *P<0.05. (D) Western blot analysis of Pak1 expression in parental versus FOXO6 KO clones 6, 53 and 62 (n=3 biological replicates). (E) Quantification of Pak1 western blot band intensities as in D. Parental=1 (n=3 biological replicates, mean±s.e.m.; each data point shows the intensity from one experiment). Two-tailed one-sample t-test. ns, not significant. *P<0.05. (F) qRT-PCR analysis of Pak1 expression in IENS-GFP Foxg1 KO clonal lines, compared to parental IENS-GFP [in which log2(fold change)=0]. Mean±s.e.m., n=3 independent experiments. Each data point shows the mean of one experiment performed in technical duplicates. Two-tailed one-sample t-test. *P≤0.05. (G) qRT-PCR analysis of FOXG1 transgene, and endogenous Foxo6, Pak1 and Ki67 expression in F6 cells after 24 h BMP4 treatment and return to EGF/FGF-2 with or without Dox for 2 days. Expression shown relative to non-BMP-treated (EGF/FGF-2) control [in which log2(fold change)=0]. d0=expression after 24 h BMP4 treatment (n=2 biological replicates, mean±s.e.m.; each data point shows the mean of one experiment performed in technical duplicates).

References

    1. Adusumilli, V. S., Walker, T. L., Overall, R. W., Klatt, G. M., Zeidan, S. A., Zocher, S., Kirova, D. G., Ntitsias, K., Fischer, T. J., Sykes, A. M., et al. (2021). ROS Dynamics delineate functional states of hippocampal neural stem cells and link to their activity-dependent exit from quiescence. Cell Stem Cell 28, 300-314.e6. 10.1016/j.stem.2020.10.019 - DOI - PMC - PubMed
    1. Bond, A. M., Bhalala, O. G. and Kessler, J. A. (2012). The dynamic role of bone morphogenetic proteins in neural stem cell fate and maturation. Dev. Neurobiol. 1068-1084. - PMC - PubMed
    1. Bressan, R. B., Dewari, P. S., Kalantzaki, M., Gangoso, E., Matjusaitis, M., Garcia-Diaz, C., Blin, C., Grant, V., Bulstrode, H., Gogolok, S., et al. (2017). Efficient CRISPR/Cas9-assisted gene targeting enables rapid and precise genetic manipulation of mammalian neural stem cells. Development 144, 635-648. 10.1242/dev.140855 - DOI - PMC - PubMed
    1. Bressan, R. B., Southgate, B., Ferguson, K. M., Blin, C., Grant, V., Alfazema, N., Wills, J. C., Marques-Torrejon, M. A., Morrison, G. M., Ashmore, J., et al. (2021). Regional identity of human neural stem cells determines oncogenic responses to histone H3.3 mutants. Cell Stem Cell 28, 877-893.e9. 10.1016/j.stem.2021.01.016 - DOI - PMC - PubMed
    1. Bruggeman, S. W. M., Hulsman, D., Tanger, E., Buckle, T., Blom, M., Zevenhoven, J., Van Tellingen, O. and Van Lohuizen, M. (2007). Bmi1 controls tumor development in an Ink4a/Arf-independent manner in a mouse model for glioma. Cancer Cell 12, 328-341. 10.1016/j.ccr.2007.08.032 - DOI - PubMed