Comparative Study
. 2024 Nov 4;24(12):3.
doi: 10.1167/jov.24.12.3.

Ocular biometric responses to simulated polychromatic defocus

Affiliations
Comparative Study

Ocular biometric responses to simulated polychromatic defocus

Sowmya Ravikumar et al. J Vis. .

Abstract

Evidence from human studies of ocular accommodation and studies of animals reared in monochromatic conditions suggest that chromatic signals can guide ocular growth. We hypothesized that ocular biometric response in humans can be manipulated by simulating the chromatic contrast differences associated with imposition of optical defocus. The red, green, and blue (RGB) channels of an RGB movie of the natural world were individually incorporated with computational defocus to create two different movie stimuli. The magnitude of defocus incorporated in the red and blue layers was chosen such that, in one case, it simulated +3 D defocus, referred to as color-signed myopic (CSM) defocus, and in another case it simulated -3 D defocus, referred to as color-signed hyperopic (CSH) defocus. Seventeen subjects viewed the reference stimulus (unaltered movie) and at least one of the two color-signed defocus stimuli for ∼1 hour. Axial length (AL) and choroidal thickness (ChT) were measured immediately before and after each session. AL and subfoveal ChT showed no significant change under any of the three conditions. A significant increase in vitreous chamber depth (VCD) was observed following viewing of the CSH stimulus compared with the reference stimulus (0.034 ± 0.03 mm and 0 ± 0.02 mm, respectively; p = 0.018). A significant thinning of the crystalline lens was observed following viewing of the CSH stimulus relative to the CSM stimulus (-0.033 ± 0.03 mm and 0.001 ± 0.03 mm, respectively; p = 0.015). Differences in the effects of CSM and CSH conditions on VCD and lens thickness suggest a directional, modulatory influence of chromatic defocus. On the other hand, ChT responses showed large variability, rendering it an unreliable biomarker for chromatic defocus-driven responses, at least for the conditions of this study.


Figures

Figure 1.
Figure 1.
Log normalized amplitudes as a function of log spatial frequency for the red (R), green (G), and blue (B) color channels of the original stimulus video, prior to computational blurring. Mean amplitudes were derived from separate Fourier analyses of the R, G, and B layers of 71,143 frames, shown here in red, green, and blue, respectively.
Figure 2.
Figure 2.
Panels show the components of Equation 1. (A) LCA as a function of wavelength for an emmetropic eye (solid black line), 3-D myope (dotted line), and 3-D hyperope (dashed line). (B) Magnitude of desired retinal defocus as a function of wavelength for the reference condition (solid black line), CSM condition (dotted line), and CSH condition (dashed line). (C) Magnitude of imposed computational defocus as a function of wavelength used to generate the stimuli for the CSM condition (dotted line) and the CSH condition (dashed line). No computational defocus was imposed in the reference case (solid black line).
Figure 3.
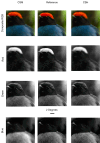
Figure 3.
Components of a sample frame from the experimental videos. The topmost row of images shows the true color composite RGB image of the same sample frame from all three experimental conditions (reference, left panel; CSM, center panel; CSH, right panel). Isolated red, green, and blue channel grayscale images from the corresponding experimental condition are shown in the corresponding panels of the second, third, and bottom rows, respectively. Note that the isolated green channel grayscale images are invariant across the three conditions. The black scale bar below the green reference image represents an angular size of 2°.
Figure 4.
Figure 4.
Box plots showing changes across each of the three viewing conditions (reference, green; CSM defocus, red; CSH defocus, blue), in axial length (A), subfoveal ChT (B), LT (C), and VCD (D). The horizontal line in each box represents the median change, and the X represents the mean change. Outliers are shown as dots of corresponding colors. Relative to that of the reference condition, the change in LT was statistically significant for the CSH condition (C, p = 0.015), as was the change in vitreous chamber depth for the CSH condition (D, p = 0.018).
Figure 5.
Figure 5.
Mean changes in ChT (post- and pre-stimulus viewing), with the solid lines indicating reference (green), CSM (red), and CSH (blue), as a function of eccentricity from the foveal pit, indicated by 0 on the x-axis, with nasal and temporal retinal regions on either side assigned negative and positive values, respectively. Error bars represent ±SD.
Figure 6.
Figure 6.
Baseline ChT, averaged across the central 1 mm and further averaged across the three study visits for the eight subjects completing all three study visits. The mean ChT for the group is shown on the right. Error bars represent 2 SD of the mean in all cases.
Figure 7.
Figure 7.
Mean change in ChT averaged across the 9-mm scan for the three different viewing conditions and each of the eight participants who completed all three test conditions. Error bars represent 2 SD of the mean. Red, blue, and black asterisks indicate significant differences between CSH and reference, between CSM and reference, and between CSH and CSM, respectively (p < 0.05).

References

    1. Aldakhil, S. (2021). The effect of optical defocus on the choroidal thickness: A review. The Open Ophthalmology Journal, 15(1), 283–287, 10.2174/1874364102115010283. - DOI
    1. Arumugam, B., Hung, L. F., To, C. H., Sankaridurg, P., & Smith, E. L. (2016). The effects of the relative strength of simultaneous competing defocus signals on emmetropization in infant rhesus monkeys. Investigative Ophthalmology and Visual Science, 57(10), 3949–3960, 10.1167/iovs.16-19704. - DOI - PMC - PubMed
    1. Campbell, M. C. W., Harrison, E. M., & Simonet, P. (1990). Psychophysical measurement of the blur on the retina due to optical aberrations of the eye. Vision Research, 30(11), 1587–1602, 10.1016/0042-6989(90)90146-C. - DOI - PubMed
    1. Chakraborty, R., Ostrin, L. A., Benavente-Perez, A., & Verkicharla, P. K. (2020). Optical mechanisms regulating emmetropisation and refractive errors: Evidence from animal models. Clinical and Experimental Optometry, 103(1), 55–67, 10.1111/cxo.12991. - DOI - PubMed
    1. Chiang, S. T. H., Chen, T. L., & Phillips, J. R. (2018). Effect of optical defocus on choroidal thickness in healthy adults with presbyopia. Investigative Ophthalmology and Visual Science, 59(12), 5188–5193, 10.1167/iovs.18-24815. - DOI - PubMed

Publication types