. 2024 Nov 5;22(11):e3002861.
doi: 10.1371/journal.pbio.3002861. eCollection 2024 Nov.

Community-based reconstruction and simulation of a full-scale model of the rat hippocampus CA1 region

Affiliations

Community-based reconstruction and simulation of a full-scale model of the rat hippocampus CA1 region

Armando Romani et al. PLoS Biol. .

Abstract

The CA1 region of the hippocampus is one of the most studied regions of the rodent brain, thought to play an important role in cognitive functions such as memory and spatial navigation. Despite a wealth of experimental data on its structure and function, it has been challenging to integrate information obtained from diverse experimental approaches. To address this challenge, we present a community-based, full-scale in silico model of the rat CA1 that integrates a broad range of experimental data, from synapse to network, including the reconstruction of its principal afferents, the Schaffer collaterals, and a model of the effects that acetylcholine has on the system. We tested and validated each model component and the final network model, and made input data, assumptions, and strategies explicit and transparent. The unique flexibility of the model allows scientists to potentially address a range of scientific questions. In this article, we describe the methods used to set up simulations to reproduce in vitro and in vivo experiments. Among several applications in the article, we focus on theta rhythm, a prominent hippocampal oscillation associated with various behavioral correlates and use our computer model to reproduce experimental findings. Finally, we make data, code, and model available through the hippocampushub.eu portal, which also provides an extensive set of analyses of the model and a user-friendly interface to facilitate adoption and usage. This community-based model represents a valuable tool for integrating diverse experimental data and provides a foundation for further research into the complex workings of the hippocampal CA1 region.


Conflict of interest statement

The authors have declared that no competing interests exist.

Figures

Fig 1
Fig 1. Overview of the model.
A visualization of a full-scale, right-hemisphere reconstruction of rat CA1 region and its components. The number of cells is reduced to 1% for clarity, and neurons are randomly colored. The CA1 network model integrates entities of different spatial and temporal scales. The different scales also reflect our bottom-up approach to reconstruct the model. Ion channels (1) were inserted into the different morphological types (3) to reproduce electrophysiological characteristics and obtain neuron models (4). Neurons were then connected by synapses to generate an intrinsic CA1 connectome (5). For each intrinsic pathway, synaptic receptors (2) and transmission dynamics were assigned based on single neuron paired recording data (6) to create a functional intrinsic CA1 network model (7). The intrinsic CA1 circuit received synaptic input from CA3 via Schaffer collateral (SC) axons (8). The neuromodulatory influence of cholinergic release on the response of CA1 neurons and synapses was modeled phenomenologically (9). The dynamic response of the CA1 network was simulated with a variety of manipulations to model in vitro and in vivo, intrinsic and extrinsic stimulus protocols while recording intracellularly and extracellularly (10) to validate the circuit at different spatial scales against specific experimental studies (11) and to make experimentally testable predictions (12).
Fig 2
Fig 2. Coordinate system.
Custom parametric coordinates system used as spatial reference for circuit building, circuit segmentation, and for simulation experiments. (A) Longitudinal (l, red), transverse (t, green) and radial (r, blue) axes of the CA1 volume are defined parametrically in range [0,1]. Left: Slice from volume shows radial depth from SO/alveus (r = 0) to SLM/pial (r = 1) and transverse extent from CA3/proximal CA1 (t = 1) to distal CA1/subiculum (t = 0) boundaries. Right: Full volume shows surface grid of transverse vs. longitudinal axes. Longitudinal axis extends from dorsal (l = 0) to ventral (l = 1) CA1. (B) Circuit segmentation for analysis and simulation. Coordinates system used to select CA1 slices of a given thickness (B1) or a cylinders of a given diameter (B2) at specific locations along longitudinal axis. (C) Extracellular electrode placed at a given surface position (left) and channels at selected laminar depth (right) in CA1 volume. (D) Each neuron in the circuit is defined by a unique general identifier (gid), its morphological type (m-type), electrical type (e-type), spatial xyz-coordinates and parameterized ltr-coordinates.
Fig 3
Fig 3. Schaffer collaterals anatomy and physiology.
(A) Section of a slice of the dorsal CA1 showing neurons in gray and SC synapses in orange (10% of the existing ones). (B) Example of SC synapse placement (orange dots) on one reconstructed PC (in gray). (C–H) Validation of the anatomy (C–E) and physiology (F–H) of the SC. Experimental values can be found in S15–S18 Tables. Density of SC synapses (lower x axis) and PDF (upper x axis) at different depths (radial axis percentage) (C). Distributions of afferent synapses from SC to PC (D) and INT (E). Distribution of PSP amplitudes for SC → PC synapses (F). Distribution of PSC ratio (see text) for SC → CB1R+ (G) and SC → CB1R- (H). Insets in panels F–H report voltage membrane traces of 10 randomly selected pairs of SC → PC, SC → CB1R+, and SC → CB1R- interneurons, respectively. The presynaptic SC is stimulated to fire 8 times at 30 Hz, plus a recovery pulse after 500 ms from the last spike of the train. Solid black lines represent mean values and shaded gray areas the standard deviation. PC, pyramidal cell; PDF, probability density function; PSP, postsynaptic potential; SC, Schaffer collaterals.
Fig 4
Fig 4. Schaffer collaterals validation.
Effect of the feedforward inhibition on the input–output relationship of the network illustrated in a slice experiment. (A) The illustration (redrawn from Fig 1A of [56]) shows the in silico experimental setup. (B) Response of 101 selected neurons to an increasing number of stimulated SC fibers, with and without GABA. The dashed boxes identify the condition (50% of active SC) that is used to show the model’s results in panel C. (C) Raster plots of SP neurons in response to the SC stimulation (orange vertical line) with the overlaying firing rate (blue). On the right, membrane voltage traces of three randomly selected SP neurons in control (black) and no GABA (gray) conditions. SC, Schaffer collaterals.
Fig 5
Fig 5. Effects of Acetylcholine on neurons, synapses, and network.
(A) Dose-response modulation of neuronal excitability caused by ACh. Black dots are experimental data points; blue curve represents the fitted equation. The dashed part of the curve indicates regions outside available experimental data. (B) Dose-response modulation of synaptic release. Same color code as in A. (C) Example traces for PC (C1) and interneurons (C2) in sub-threshold and supra-threshold conditions, with different concentrations of ACh. (D) Example traces showing the STP dynamics for PC (D1) and interneurons (D2) at different concentrations of ACh. (E) The illustration shows the in silico experimental setup to analyze network effects of ACh. Different concentrations of CCh are applied to the circuit and multiple types of recordings made in the CA1 (membrane voltage, spike times, LFPs). (F) Mean STTC as a function of ACh concentration. (G) Maximum of the LFP PSD and peak frequency as a function of ACh concentration. (H) The voltage of 100 randomly selected neurons at different levels of ACh. The upper histograms show the instantaneous firing rate. (I) Spike-spike correlation histograms. (J) Spectrogram of the LFP measured in SP at different ACh levels. (K) PSD of the LFP recorded in SP. ACh, acetylcholine; LFP, local field potential; PC, pyramidal cell; PSD, power spectral density; STTC, spike time tiling coefficient.
Fig 6
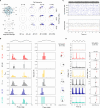
Fig 6. CA3 theta (8 Hz) oscillatory input entrains CA1 to matched theta oscillation across different scales of circuit.
(A) Schema showing the in silico experimental setup. (B) Dependency of peak frequency (left) and PSD (right) from calcium level, cell and signal frequencies during simulations of a cylinder circuit. (C) Full circuit model (2 mM calcium). LFP recordings from SP (far left), spectrogram (left middle), PSD (right middle), CSD (far right). (D) Slice circuit model (thickness of 300 μm, 2 mM calcium). (E) Cylinder circuit model (radius of 300 μm, 2 mM calcium). (F) Full circuit model (1 mM calcium). Note that PSD has 1,000 times smaller y-axis scaling than the ones in panels A–C. CSD, current source density; LFP, local field potential; PSD, power spectral density.
Fig 7
Fig 7. CA1 morphological types are homogeneously tuned to CA3 theta oscillatory input.
(A) Neurons for analysis were selected within 100 μm radius of the stratum pyramidale electrode location (top left), shown as shaded region with the arrow indicating the radius of this region. Phase locking angle and strength for a range of individual (CA3) cell frequencies (columns) and modulation frequencies (rows). (B) Phase modulation. Spike discharge probability of all neurons grouped by morphological type (left). Phase locked neurons tuning over theta cycle for each morphological class over a single theta cycle (middle). Experimental validation of phase-locking against in vivo recordings (right) with an arrow representing the mean phase angle (experimental data = black arrow; simulated = colored arrow) and gray shaded sector indicating, where known, the experimental angular deviation. (C) Spiking raster plots. SP_PC cell spiking (top panel); LFP theta rhythm (trace above plot); intereuron spiking (bottom panel). (D) Intracellular traces from morphological cell types (left) and validation against in vivo recordings. Stimulus panels B–D: 0.4 Hz SC mean spiking frequency and 8 Hz signal modulation. All simulations shown for 2 mM calcium. Experimental values in panels B and D can be found respectively in S23 and S24 Tables. LFP, local field potential; PC, pyramidal cell; SC, Schaffer collaterals.
Fig 8
Fig 8. MS disinhibition of parvalbumin-positive (PV+) interneurons induced theta oscillations in CA1.
(A) Simulation setup. All neurons received a tonic depolarizing current in the presence of ACh (“MS OFF” condition). For a given period, an oscillatory hyperpolarizing current was injected into PV+ interneurons only (“MS ON” condition). (B) Example of simulation before and after the onset of disinhibition. LFP in black and theta-filtered LFP in gray. (C) Spectrogram for a range of ACh concentrations (top labels) and tonic depolarization levels (right labels). (D) PSD across different levels of tonic depolarization (right labels) with and without disinhibition. (E) CSD analysis across different ACh concentrations (top labels), with and without disinhibition. (F) Theta band power as a function of the amplitude of oscillatory hyperpolarizing current, ACh concentration, and level of tonic depolarization. B–E: Stimulus disinhibitory modulation amplitude of 0.2 nA. ACh, acetylcholine; CSD, current source density; LFP, local field potential; MS, medial septum; PSD, power spectral density.
Fig 9
Fig 9. MS disinhibition induced anti-phase modulation of CA1 neurons during theta cycles.
(A) Neurons for analysis were selected within 100 μm radius of the stratum pyramidale electrode location (top left). Phase locking angle and strength for range of ACh concentration (columns) and levels of tonic depolarization (rows, where 100% represents the spike threshold) for modulation amplitude of A = 0.2 nA. (B) Phase modulation. Spike discharge probability of all neurons grouped by morphological type (left). Phase-locked neurons tuning over theta cycle for each morphological class over a single theta cycle (middle). Experimental validation of phase locking against in vivo recordings (right) with an arrow representing the mean phase angle (experimental data = black arrow; simulated = colored arrow) and gray shaded sector indicating, where known, the experimental angular deviation. (C) Spiking raster plots. SP_PC cell spiking (top panel); LFP theta rhythm (trace above plot); interneuron spiking (bottom panel). Disinhibition is switched on (“MS ON”) at time 10 s. (D) Intracellular traces from morphological cell types (left) and validation against in in vivo recordings. B–D: Stimulus disinhibitory modulation amplitude of A = 0.2 nA, 1 μM ACh and tonic depolarization 120%. Experimental values in panels B and D can be found respectively in S23 and S24 Tables. ACh, acetylcholine; LFP, local field potential; MS, medial septum.
Fig 10
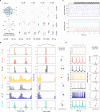
Fig 10. Intermediate frequencies propagate more efficiently through SC.
(A) In silico experimental setup. (B) Ratio between the number of CA1 and CA3 spikes as a function of input cell and signal frequencies. We considered all CA1 neurons (left), CA1 PCs (center) and CA1 interneurons (right). (C) Heatmaps representing the computed STTC values as a function of input cell and signal frequencies, for CA3-CA1 and CA1-CA1 neurons. (D) Examples of CA3 and CA1 spike train (cell frequency of 0.4 Hz, signal frequency of 10 Hz); 100 random CA3 neurons (i.e., SC fibers) and CA1 neurons are selected for clarity. The same neurons are used to compute the STTC and spike-spike correlations (panels D and E). (E) Spike-spike normalized correlation histograms for 4 signal frequencies (cell frequency of 0.4 Hz) for CA3-CA1 and CA1-CA1 neurons. SC, Schaffer collaterals; STTC, spike time tiling coefficient.

Comment in

References

    1. O’Keefe J, Dostrovsky J. The hippocampus as a spatial map. Preliminary evidence from unit activity in the freely-moving rat. Brain Res. 1971;34(1):171–175. doi: 10.1016/0006-8993(71)90358-1 - DOI - PubMed
    1. Morris RG, Garrud P, Rawlins JN, O’Keefe J. Place navigation impaired in rats with hippocampal lesions. Nature. 1982;297(5868):681–683. doi: 10.1038/297681a0 - DOI - PubMed
    1. Amaral DG, Witter MP. The three-dimensional organization of the hippocampal formation: a review of anatomical data. Neuroscience. 1989;31(3):571–591. doi: 10.1016/0306-4522(89)90424-7 - DOI - PubMed
    1. Soltesz I, Losonczy A. CA1 pyramidal cell diversity enabling parallel information processing in the hippocampus. Nat Neurosci. 2018;21(4):484–493. doi: 10.1038/s41593-018-0118-0 - DOI - PMC - PubMed
    1. Bezaire MJ, Soltesz I. Quantitative assessment of CA1 local circuits: Knowledge base for interneuron-pyramidal cell connectivity. 2013;23(9):751–785. doi: 10.1002/hipo.22141 - DOI - PMC - PubMed

LinkOut - more resources