. 2024 Dec;11(47):e2407346.
doi: 10.1002/advs.202407346. Epub 2024 Nov 5.

Hyperglycemia-Enhanced Neutrophil Extracellular Traps Drive Mucosal Immunopathology at the Oral Barrier

Affiliations

Hyperglycemia-Enhanced Neutrophil Extracellular Traps Drive Mucosal Immunopathology at the Oral Barrier

Qian Wang et al. Adv Sci (Weinh). 2024 Dec.

Abstract

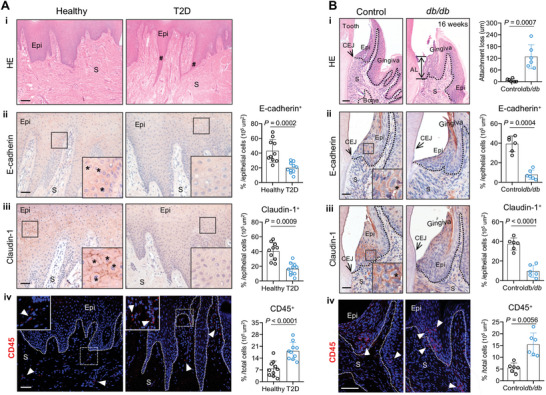
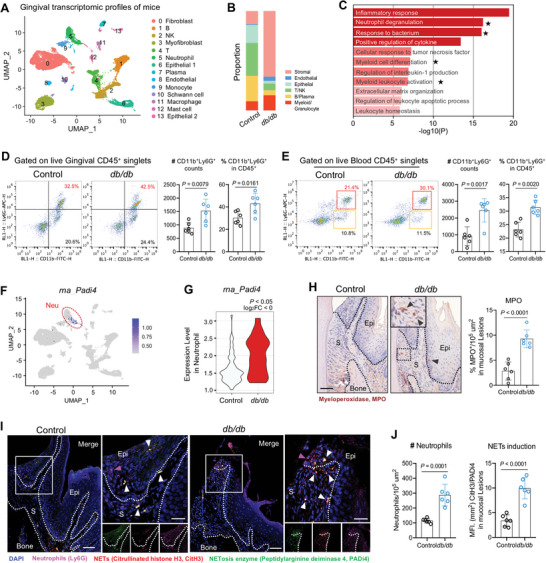
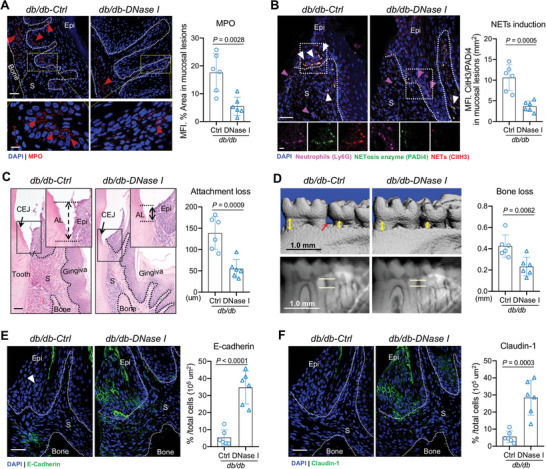
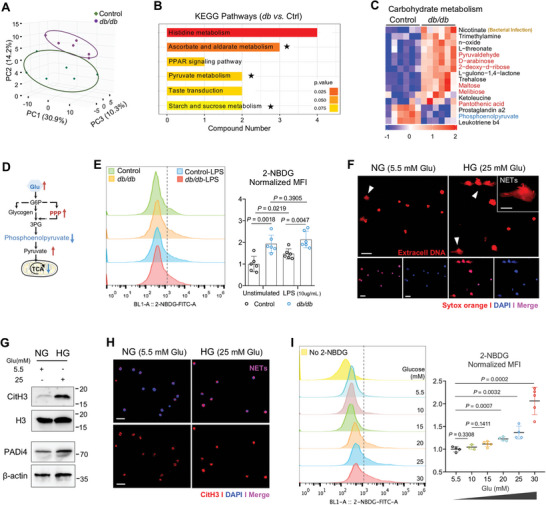
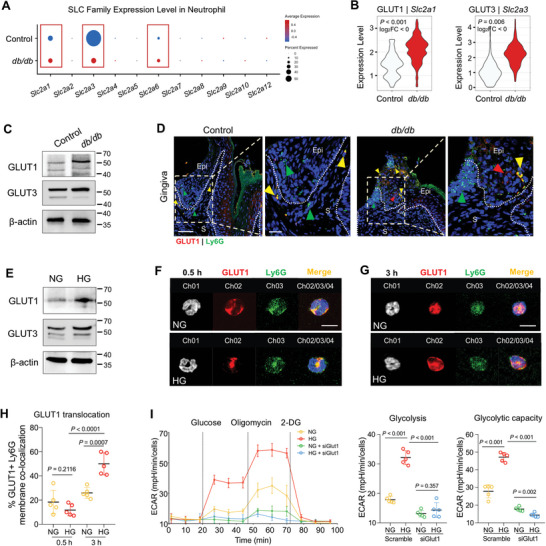
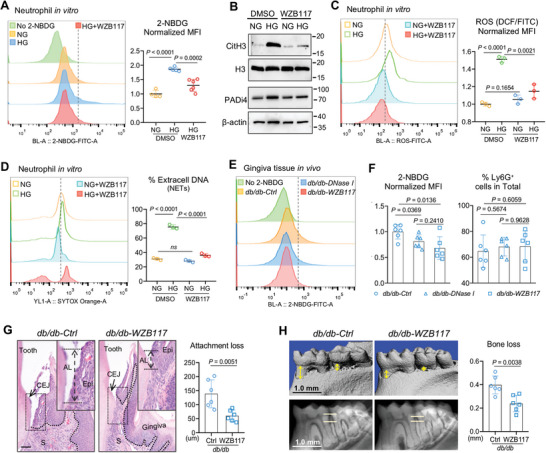
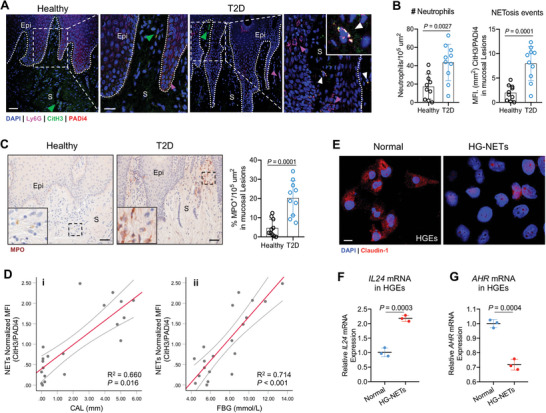
Type 2 diabetes (T2D) is a risk factor for mucosal homeostasis and enhances the susceptibility to inflammation, in which neutrophils have been increasingly appreciated for their role. Here, barrier disruption and inflammation are observed at oral mucosa (gingiva) of T2D patients and mice. It is demonstrated that neutrophils infiltrate the gingival mucosa of T2D mice and expel obvious neutrophil extracellular traps (NETs), while removal of NETs alleviates the disruption of mucosal barrier. Mechanistically, gingival neutrophils released NETs are dependent of their metabolic reprogramming. Under hyperglycemic condition, neutrophils elevate both glucose incorporation and glycolysis via increased expression of GLUT1. Moreover, significantly increased levels of NETs are observed in local gingival lesions of patients, which are associated with clinical disease severity. This work elucidates a causative link between hyperglycemia and oral mucosal immunopathology, mediated by the altered immuno-metabolic axis in neutrophil, thereby suggesting a potential therapeutic strategy.

Keywords: glucose transporter 1; glycolysis; hyperglycemia; neutrophils; oral mucosal immunity; type 2 diabetes.


Conflict of interest statement

The authors declare no conflict of interest.

Figures

Figure 1
Figure 1
Oral mucosal immunopathology in diabetic patients and mice. (A) Gingival biopsies from patients. (A‐i) Hematoxylin and eosin (H&E) staining of gingival tissue sections (black hashes indicate gingival epithelial spikes). Epi, epithelium; S, stroma. Scale bar: 100 µm. (A‐ii, iii) Immunohistochemical (IHC) staining of E‐cadherin and Claudin‐1 in gingival biopsies (black asterisks depict positive cells). Right: graphs showing the percentage of positive E‐cadherin and Claudin‐1 cells in epithelium. Scale bars, 50 µm. (A‐iv) Immunofluorescence (IF) staining for CD45 in gingival lesions. And white triangles indicate CD45+ leukocytes. Right: quantification of the mean fluorescence intensity (MFI) of CD45 staining (n = 10, one‐way ANOVA). Scale bar: 50 µm. (B) Gingival samples from animal models. db/db group: db/db mice, Control group: heterozygote mice. (B‐i) H&E staining of gingival tissue sections (black arrowhead depicts CEJ and black lines indicate mucosal attachment loss). Right: quantification of mucosal attachment loss (n = 6, two‐tail Student t‐test). AL, attachment loss; CEJ, cementoenamel junction; Epi, epithelium; S, stroma. Scale bar: 50 µm. (B‐ii, iii) IHC staining of E‐cadherin and Claudin‐1 in gingival tissues (black asterisks depict positive cells) from control and db/db mice. Right: graphs showing the percentage of positive E‐cadherin and Claudin‐1 cells in epithelium (n = 6, one‐way ANOVA). Scale bars, 25 µm. (B‐iv) IF staining for CD45 in mouse gingival tissue sections (white triangles indicate CD45+ leukocytes). Right: graphs showing the MFI of CD45 staining (n = 6, one‐way ANOVA). Scale bar: 10 µm. All data are presented as mean ± SD.
Figure 2
Figure 2
NETosis is evident in oral mucosal lesions of db/db mice. (A) Single‐cell RNA sequencing (scRNA‐seq) data about gingival mucosal map of control and db/db mice. UMAP plot representation of identified cell types (a total of 14 clusters). Right: The definition of identified cell types. (B) Bar graph of relative cell proportions by cell type, a total six subsets. (C) Gene ontology (GO) enrichment analysis of the up‐regulated biological functions in myeloid subsets in ascending order of P value. The black stars indicate the biological process associated with neutrophil activities. (D) Flow cytometry analysis of 16‐week‐old mouse oral mucosal tissues. FACS plots show changes of CD11b+Ly6G+ and CD11b+Ly6G cells in CD45+ cells. Right: Absolute counts and percentages of CD11b+Ly6G+ neutrophils in CD45+ cells (n = 6, two‐tail Student t‐test). (E) Flow cytometry analysis of mouse blood. FACS plots show changes in CD11b+Ly6G+ and CD11b+Ly6Gcells. Right: Absolute counts and percentages of CD11b+Ly6G+ neutrophils in CD45+ cells (n = 6, two‐tail Student t‐test). (F) UMAP shows the expression of NETosis marker gene Padi4 in all identified cell types (gray denotes minimal expression, purple intermediate, and blue high). The red circle indicates neutrophil sub‐cluster. Padi4 mRNA is specifically expressed in this cluster. (G) Violin plots showing the expression level of Padi4 in neutrophil cluster between two groups. (H) IHC staining of myeloperoxidase (MPO) in mouse oral mucosal tissue sections (black triangles depict MPO+ cells). Right: Quantification of the percentage of MPO‐stained positive cells in sections (n = 6, one‐way ANOVA). Scale bars, 50 µm. Epi, epithelium; S, stroma. (I) IF staining of Ly6G (purple), CitH3 (red), and PADi4 (green) in mouse gingival tissue sections, where NETs are indicated by white triangles. (Left) Low magnification, scale bar, 50 µm; (right) higher magnification, scale bar: 25 µm. (J) Percentage of Ly6G, CitH3, and PADi4 stained area, respectively. Left: graphs showing the number of neutrophils (Ly6G+) per 105 µm2 of stained tissue sections. Right: NETs are quantified by the MFI of CitH3 or PADi4 staining in oral mucosal lesions, and the ratio of CitH3 to PADi4 is calculated. All data are presented as mean ± SD.
Figure 3
Figure 3
DNase‐I treatment attenuates periodontal damage and barrier disruption in db/db mice. (A) IF staining of MPO in gingival tissue section from db/db mice with or without DNase I treatment (red triangles depict MPO+ cells). Right: Quantification of the MFI of MPO staining in oral mucosal lesions (n = 6, one‐way ANOVA). Scale bars: low magnification, 30 µm; high magnification, 10 µm. Epi, epithelium; S, stroma. (B) IF staining of Ly6G (purple), CitH3 (red), and PADi4 (green) in gingival tissue from db/db mice with or without DNase I treatment, where NETs are indicated by white triangles. Scale bars: low magnification, 30 µm; high magnification, 10µm. Right: NETs are quantified by the MFI of CitH3 or PADi4 staining in oral mucosal lesions, and the ratio of CitH3 to PADi4 is calculated. (C) H&E staining of gingival tissues from db/db mice with or without DNase I treatment. The black arrowhead depicts CEJ and the distance between black lines indicates mucosal attachment loss. AL, attachment loss; CEJ, cementoenamel junction; Epi, epithelium; S, stroma. Scale bar: 50 µm. (Right) Quantification of the mucosal attachment loss (n = 6, two‐tail Student t‐test). (D) Micro‐CT visualization of periodontal bone loss of mandibles. Yellow arrows and lines indicate the distance of ABC‐CEJ in the mandible. Scale bar: 1 mm. (Right) Bone loss measurement. (E,F) IF staining of E‐cadherin (E) and Claudin‐1 (F) in gingival tissue from db/db mice with or without DNase I treatment. Right: Quantification of the percentage of positive E‐cadherin and Claudin‐1 cells in epithelium (n = 6, one‐way ANOVA). Scale bars: 30 µm. Epi, epithelium; S, stroma. All data are presented as mean ± SD.
Figure 4
Figure 4
Hyperglycemia induces neutrophil extracellular traps in db/db mice. (A) Principal component analysis (PCA) plot in negative mode showing the distribution of differential metabolites in oral mucosa of control and db/db mice. (B) KEGG pathways on differential metabolites upregulated in db/db mice in ascending order of p‐value. The black stars indicate the pathways associated with carbohydrate metabolism. (C) Heatmap showing differential metabolites levels involved in carbohydrate metabolism in db/db gingival tissues. Red items indicate the intermediate products in carbohydrate metabolism process. (D) Schematic diagram showing the overall glucose‐associated metabolites measured in db/db oral mucosal tissues by LC‐MS analysis. (E) Flow cytometry analysis for glucose uptake capacity of neutrophils derived from control and db/db bone marrow with incorporation of glucose analog 2‐NBDG, in the presence or absence of LPS stimulation. Right: Quantification of neutrophils glucose uptake (normalized MFI of 2‐NBDG; n = 6; unpaired two‐tail Student t‐test). (F) Sytox Orange detected NETs production in vitro. The induction of NETosis is conducted on neutrophils derived from bone marrow and treated with normal glucose (5.5 mm, NG) and high glucose (25 mm, HG) concentrations for 3 h. Scale bar: 25 µm; higher magnification, scale bar: 10 µm. (G) Western blot showing the expression levels of PADi4 protein expression and citrullinated H3 in vitro. (H) CitH3 (red) and DAPI staining for NETs (purple) at 3‐h time point with 5.5 and 25 mm glucose conditions. Scale bars: 25 µm. (I) FACS analysis of glucose uptake ability in neutrophil after cultured with different glucose conditions. Neutrophils are respectively incubated with 5, 10, 15, 20, 25, and 30 mm glucose for 2.5 h and then incubated with FITC‐labelled 2‐NBDG for 30 min. Data pooled from three independent experiments, n ≥ 3.
Figure 5
Figure 5
GLUT1‐mediated glycolysis primes neutrophil to undergo NETosis in T2D. (A) Bubble chart visualization of solute carrier family (SLC) mRNA expression level in neutrophil subset of mouse gingival tissue. (B) Violin plots showing transcription levels of Slc2a1 (coding GLUT1) and Slc2a3 (coding GLUT3) in oral mucosal neutrophils of control and db/db mice. (C) Western blot analyses of glucose transporter (GLUT)‐1 and GLUT3 in control and db/db gingival mucosa (n = 6). (D) IF staining of GLUT1 (red) and Ly6G (green) in mouse gingival tissue section, where co‐localized cells are indicated by yellow triangles. (Left) Low magnification, scale bar, 50 µm; (right) higher magnification, scale bar: 20 µm. Epi, epithelium; S, stroma. (E) Western blot of GLUT1 and GLUT3 in neutrophils cultured with 5.5 mm (NG) and 25 mm (HG) of glucose stimulations. (F–H) Neutrophils are stimulated with 5.5 and 25 mm of glucose for 0.5 h (F) or 3 h (G). Surface localization of GLUT1 in neutrophils is visualized by IF confocal microscopy, scale bar: 10 µm. The membrane translocations of GLUT1 represent the percentage of surface‐expressed (Ly6G co‐localized) GLUT1 out of total GLUT1 protein (n = 5, two‐tail Student t‐test). Data pooled from 3 to 4 independent experiments, and representative images (F,G) and histogram plots (H) are shown. (I) BM neutrophils are stimulated with 5.5 and 25 mm of glucose for 3 h. Small interfering RNAs (siRNAs) target to deplete Glut1/Slc2a1 in BM neutrophils. Seahorse assay is performed to detect the ECAR (Basal extracellular acidification rate) after 5.5 and 25 mm glucose stimulations, in the presence or absence of siGlut1. Data pooled from three independent experiments; n = 5; statistical analysis by two‐way ANOVA.
Figure 6
Figure 6
Inhibition of GLUT1 ameliorates NETs‐driven chronic inflammation at oral mucosal sites. (A) Detection of glucose uptake in neutrophils by flow cytometry (left), and bar graph (right) showing the normalized MFI of 2‐NBDG (n = 6). (B) Western blot analyses of PADi4 and CitH3 in neutrophils stimulated with 5.5 (NG) and 25 mm (HG) of glucose in the presence and absence of WZB117. (C) ROS production measured by FACS in the presence and absence of WZB117. Right: bar graph showing the normalized MFI of ROS/DCF (n = 3, two‐tail Student t‐test). (D) NETs formation detected by FACS of Sytox orange staining. Right: frequency of NETosis score is blindly evaluated (n = 3; ns, not significant as determined by ANOVA). (E) Glucose uptake of neutrophils in db/db‐Ctrl, DNase I‐treated db/db, and WZB117‐treated db/db oral mucosal tissues are detected by 2‐NBDG incorporation, for 1 h in vivo after intravenous injection. (F) Percentages of neutrophils in total cells (left) and the normalized MFI of 2‐NBDG (right) in db/db‐Ctrl, db/db DNase I‐treated and db/db WZB117‐treated mouse gingiva. Data was analyzed using one‐way ANOVA, n = 6. (G) H&E staining of oral mucosal tissue sections from db/db and WZB117‐treated db/db mice. The black arrowhead depicts CEJ and the distance between black lines indicates mucosal attachment loss. AL, attachment loss; CEJ, cementoenamel junction; Epi, epithelium; S, stroma. Scale bar: 50 µm. Bar graph (right) showing quantification of mucosal attachment loss, n = 6, Student t‐test. (H) Micro‐CT visualization for periodontal bone loss of mandible in db/db and WZB117‐treated db/db mice. Scale bar: 1 mm. Yellow arrows and lines indicate the distance of ABC‐CEJ in mandible. Bar graph (right) showing bone loss measurement (n = 6, Student t‐test).
Figure 7
Figure 7
NETs potentiate oral mucosal injury and barrier disruption in T2D patients. (A) IF staining of Ly6G (purple), CitH3 (red), and PADi4 (green) in oral mucosal tissues from patients with type 2 diabetes and healthy controls. White triangles indicate NETs. (Left) Low magnification, scale bar, 50 µm; (right) higher magnification, scale bar: 25 µm. Epi, epithelium; S, stroma. (B) Left: graphs showing the number of neutrophils per 105 µm2 of stained tissue sections. Right: NETosis events are quantified by the MFI of CitH3 or PADi4 staining in oral mucosal lesions, and the ratio of CitH3 to PADi4 is calculated. Data was analyzed using one‐way ANOVA, n = 10. (C) IHC staining of MPO in oral mucosal tissues from patients and healthy controls (black triangles depict MPO+ cells). Scale bars, 50 µm. Right: Quantification of percentage of MPO stained positive cells (n = 10). (D‐i) Correlation analysis of CAL (in mm) with gingival levels of NETs measured in T2D patients and healthy donors. (D‐ii) Correlation between levels of fasting blood glucose and gingival NETs measured in patients and healthy donors. Results about gingival NETs complexes are expressed as normalized MFI of CitH3/PADi4 (Figure 7B). Data was analyzed using two‐way ANOVA test, n = 20. (E) IF staining of Claudin‐1 (red) in human gingival epithelial (HGE) cell lines. Scale bar, 10 µm. HGEs are cultured in the absence (Normal) or presence of high glucose‐induced NETs (HG‐NETs) for 24 h. NETs formation is incubated with 25 mmol L−1 glucose (HG) for 3 h. (F) Expressions of IL24 mRNA in HGEs are measured by qPCR, normalized to GAPDH. (G) Expressions of AHR mRNA in HGEs are measured by qPCR, normalized to GAPDH. Data are representative of three independent experiments. Graphs show the mean ± SD. Data was analyzed using unpaired two‐tailed Student t‐test, n = 3.

Similar articles

Cited by

References

    1. Thimmappa P. Y., Vasishta S., Ganesh K., Nair A. S., Joshi M. B., Hum. Cell 2023, 36, 1265. - PMC - PubMed
    1. Sawaya A. P., Stone R. C., Brooks S. R., Pastar I., Jozic I., Hasneen K., O'Neill K., Mehdizadeh S., Head C. R., Strbo N., Morasso M. I., Tomic‐Canic M., Nat. Commun. 2020, 11, 4678. - PMC - PubMed
    1. Davis T. M. E., Davis W. A., Diabetes Care 2020, 43, 2113. - PubMed
    1. de Souza Bastos A., Leite A. R. P., Spin‐Neto R., Nassar P. O., Massucato E. M. S., Orrico S. R. P., Diabetes Res. Clin. Pract. 2011, 92, 100. - PubMed
    1. Nibali L., Gkranias N., Mainas G., Di Pino A., Periodontol 2000 2022, 90, 88. - PMC - PubMed