. 2024 Nov 26;43(11):114891.
doi: 10.1016/j.celrep.2024.114891. Epub 2024 Nov 4.

A diet-dependent host metabolite shapes the gut microbiota to protect from autoimmunity

Affiliations

A diet-dependent host metabolite shapes the gut microbiota to protect from autoimmunity

Margaret Alexander et al. Cell Rep. .

Abstract

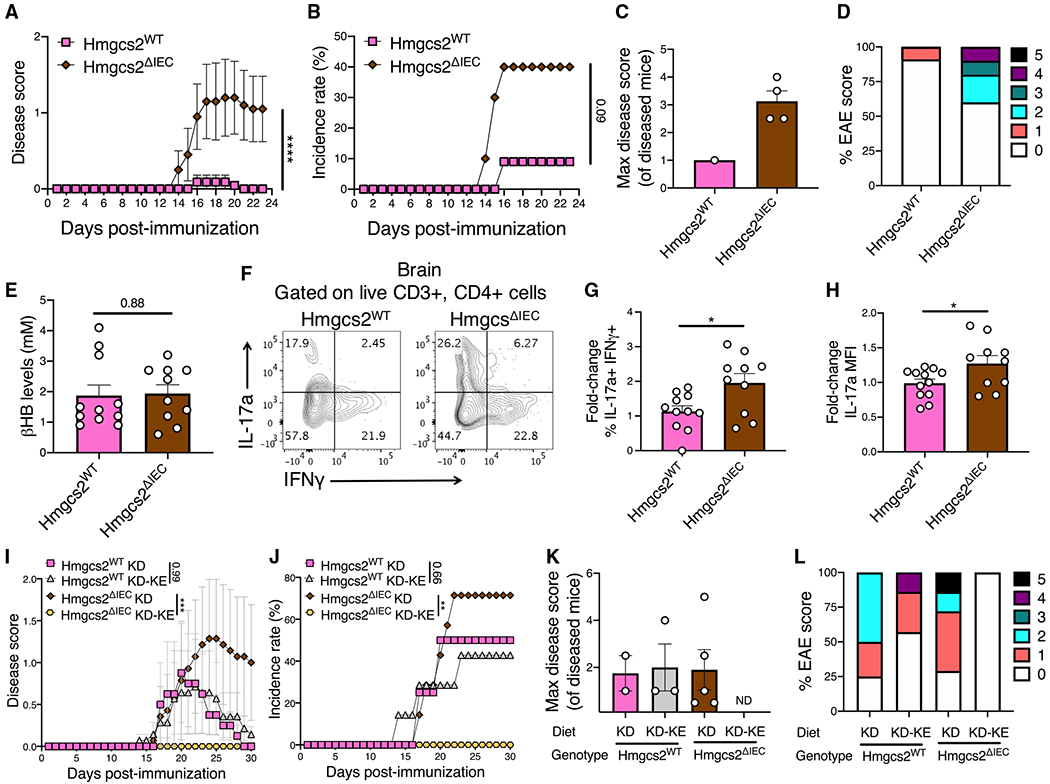
Diet can protect from autoimmune disease; however, whether diet acts via the host and/or microbiome remains unclear. Here, we use a ketogenic diet (KD) as a model to dissect these complex interactions. A KD rescued the experimental autoimmune encephalomyelitis (EAE) mouse model of multiple sclerosis in a microbiota-dependent fashion. Dietary supplementation with a single KD-dependent host metabolite (β-hydroxybutyrate [βHB]) rescued EAE, whereas transgenic mice unable to produce βHB in the intestine developed more severe disease. Transplantation of the βHB-shaped gut microbiota was protective. Lactobacillus sequence variants were associated with decreased T helper 17 cell activation in vitro. Finally, we isolated an L. murinus strain that protected from EAE, which was phenocopied by a Lactobacillus metabolite enriched by βHB supplementation, indole lactate. Thus, diet alters the immunomodulatory potential of the gut microbiota by shifting host metabolism, emphasizing the utility of taking a more integrative approach to study diet-host-microbiome interactions.

Keywords: CP: Immunology; CP: Microbiology; autoimmune disease; gut microbiome; immune activation; ketogenesis; ketogenic diet; lactobacillus; multiple sclerosis; neuroinflammation; nutrition; trytophan metabolism.


Conflict of interest statement

Declaration of interests P.J.T. is on the scientific advisory boards for Pendulum, Seed, and SNIPRbiome; there is no direct overlap between the current study and these consulting duties. P.A.C. has served as an external consultant for Pfizer, Inc., Abbott Laboratories, Janssen Research & Development, and Selah Therapeutics. J.C.N. is scientific co-founder and stockholder for BHB Therapeutics (which provided the ketone ester) and Selah Therapeutics.

Figures

Figure 1.
Figure 1.. A ketogenic diet rescues a mouse model of multiple sclerosis in a microbiota-dependent manner
(A–D) Conventionally raised (CONV-R), specific pathogen-free, female C57BL/6J mice were fed a high-fat diet (HFD) or a ketogenic diet (KD) (Table S1) for 10 days prior to induction of the experimental autoimmune encephalomyelitis (EAE) mouse model of multiple sclerosis (n = 14/group; two independent experiments). (A) Disease scores (two-way ANOVA; mean ± SEM) and (B) disease incidence (log-rank Mantel-Cox test; percentage) were tracked over 28 days. (C) Mean disease severity of mice that develop disease (mean ± SEM; each point represents an individual mouse). (D) The proportion of mice with maximum disease score after 28 days. (E–H) At day 16 post immunization, mice fed an HFD or KD for 4 days prior to EAE induction (n = 5/group) were sacrificed, and brain and splenic lymphocytes were profiled for T helper subsets. (E) Representative flow cytometry from brain lymphocytes of IL-17a and IFNγ cells within the live CD3+ CD4+ population. (F) Percentage of IL-17a+ IFNγ+ cells within the live CD3+ CD4+ population in the brain (Welch’s t test; mean ± SEM; each point represents an individual mouse). (G) Representative flow cytometry from splenocytes of IL-17a and IFNγ cells within the live CD3+ CD4+ population. (H) Percentage of IL-17a+ IFNγ+ cells within the live CD3+ CD4+ population in the spleen (Welch’s t test; mean ± SEM; each point represents an individual mouse). (I-L) Germ-free (GF) female C57BL/6J mice were fed an HFD or KD for 7 or 16 days before EAE was induced and (I) disease scores (p value listed; two-way ANOVA; mean ± SEM) and (J) incidence rates (p value listed; log-rank Mantel-Cox test; percentage) were tracked for 25 days post immunization (n = 11 HFD; n = 12 KD; two independent experiments). (K) Mean maximum disease severity of mice that developed disease (mean ± SEM; each point represents a diseased mouse). (L) The proportion of mice with maximum disease score after 25 days. p value listed; *p < 0.05; ****p < 0.0001.
Figure 2.
Figure 2.. Oral βHB is sufficient for protection from neurological disease
(A) Pathway for β-hydroxybutyrate (βHB) production where 3-hydroxy-3-methylglutaryl-CoA synthase 2 (Hmgcs2) is the rate-limiting enzyme (AcAc, acetoacetate). (B–F) Conventionally raised (CONV-R), specific pathogen-free, male and female C57BL/6J mice were fed a high-fat diet (HFD), an HFD supplemented with a βHB ketone ester (HFD-KE), or a ketogenic diet (KD) for 3 days prior to EAE disease induction (Table S1, n = 9 HFD; n = 10 HFD-KE and KD). (B) Circulating βHB levels 7 days post immunization. (C) Disease scores (two-way ANOVA; mean ± SEM) and (D) disease incidence (p value listed; log-rank Mantel-Cox test; percentage) was tracked over 21 days post immunization. (E) Mean maximum disease severity of mice that developed disease (mean ± SEM; each point represents a diseased mouse). (F) The proportion of mice with maximum disease score after 21 days. (G–J) Conventionally raised (CONV-R), specific pathogen-free, female SJL/J mice were fed an HFD, HFD-KE, or a KD for 5 days prior to EAE disease induction (n = 11 HFD; n = 12 HFD-KE and KD). (G) Disease scores (two-way ANOVA; mean ± SEM) and (H) disease incidence (log-rank Mantel-Cox test; percentage) was tracked over 21 days. (I) Mean maximum disease severity of mice that developed disease (mean ± SEM; each point represents a diseased mouse). (J) The proportion of mice with maximum disease score after 21 days. p value listed; ****p < 0.0001.
Figure 3.
Figure 3.. Intestinal βHB is necessary for protection from neurological disease
(A–H) Male Hmgcs2WT (Hmgcs2fl/fl VillinER/Cre−/−) and mice with Hmgcs2 specifically deleted from intestinal epithelial cells (IECs) (Hmgcs2ΔIECHmgcs2fl/fl VillinER/Cre+/−) were injected with tamoxifen daily for 5 days in induced Hmgcs2 deletion. Mice then had a washout period of 5 days before being given a ketogenic diet (KD) for 3 days before EAE was induced (n = 11 Hmgcs2WT; n = 10 Hmgcs2ΔIEC; two independent experiments). (A–E) (A) Disease scores (two-way ANOVA; mean ± SEM) and (B) disease incidence (p value listed; log-rank Mantel-Cox test; percentage) was tracked for 23 days. (C) Mean maximum disease severity of mice that developed disease (mean ± SEM; each point represents a diseased mouse). (D) The proportion of mice with maximum disease score after 23 days. (E) Circulating βHB levels 7 days post immunization. (F–H) Levels of Th17 cells in the brain were quantified with flow cytometry at day 23 post immunization. (F) Representative flow cytometry from brain lymphocytes of Th17 cells (IL-17a+ IFNγ+ cells within the live CD3+ CD4+ population). (G) Fold change relative to the Hmgcs2WT group in the IL-17a+ IFNγ+ cells within the live CD3+ CD4+ population and (H) IL-17a mean fluorescence intensity within the live TCRβ+ population (Welch’s t test; mean ± SEM; each point represents an individual mouse). (I–L) Male Hmgcs2WT (Hmgcs2fl/fl VillinER/Cre−/−) or Hmgcs2ΔIEC (Hmgcs2fl/fl VillinER/Cre+/−) were injected with tamoxifen daily for 5 days, after which the mice had a washout period of 5 days before being put on a KD or a KD supplemented with a βHB ketone ester (KD-KE) (Table S1) for 5 days before EAE was induced (n = 4 Hmgcs2WT KD; n = 7 Hmgcs2WT KD-KE, Hmgcs2ΔIEC KD, and Hmgcs2ΔIEC KD-KE). (I) Disease scores (two-way ANOVA; mean ± SEM) and (J) disease incidence rates (log-rank Mantel-Cox test; percentage) were tracked for 30 days. (K) Mean maximum disease severity of mice that developed disease (mean ± SEM; each point represents a diseased mouse; ND, not detected). (L) The proportion of mice with maximum disease score after 30 days. p value listed; *p < 0.05; **p < 0.01; ***p < 0.001; ****p < 0.0001.
Figure 4.
Figure 4.. The βHB-altered gut microbiota is sufficient to protect from disease
(A–I) Fecal microbiota transplantation (FMT) experiments between mice fed a high-fat diet (HFD) or HFD + βHD ketone ester (HFD-KE). HFD or HFD-KE donor fecal microbiota were transplanted into AVNM-treated HFD- or HFD-KE-fed recipients before EAE was induced (n = 15 HFD microbiota to HFD recipient, pink circles; n = 14 HFD microbiota to HFD-KE recipient, pink triangles; n = 16 HFD-KE microbiota to HFD recipient, blue circles; n = 15 HFD-KE microbiota to HFD-KE recipient, blue triangles; two independent experiments). Time points for fecal sample collection for 16S-seq are indicated on the timeline. (A–E) (A) Experimental design and timeline for diet FMT experiments. (B) Disease scores (two-way ANOVA; mean ± SEM) and (C) disease incidence rates (log-rank Mantel-Cox test; percentage) were tracked over 25 days post immunization. (D) Mean disease severity of mice that developed disease (mean ± SEM; each point represents a diseased mouse). (E) The proportion of mice with maximum disease score after 25 days. (F–I) Principal coordinate analysis of Euclidean distances (F) before, (G) during, and (H) after FMTs. (I) PERMANOVA testing of recipient (black) and donor (gray) diet before, during, or after FMTs. (J–N) Hmgcs2WT or Hmgcs2ΔIEC fecal microbiota was transplanted into KD-fed AVNM-treated Hmgcs2WT and Hmgcs2ΔIEC recipient mice before EAE was induced (n = 13 Hmgcs2WT microbiota to Hmgcs2WT recipient, purple circles; n = 13 Hmgcs2ΔIEC microbiota to Hmgcs2WT recipient, yellow circles; n = 19 Hmgcs2WT microbiota to Hmgcs2ΔIEC recipient, purple triangles; n = 17 Hmgcs2ΔIEC microbiota to Hmgcs2ΔIEC recipient, yellow triangles). (J) Experimental design and timeline. (K) Disease scores (two-way ANOVA; mean ± SEM) and (L) disease incidence rates (log-rank Mantel-Cox test; percentage) were tracked over 22 days. (M) Mean disease severity of mice that developed disease (mean ± SEM; each point represents a diseased mouse). (N) The proportion of mice with maximum disease score after 22 days. p value listed; *p < 0.05; ****p < 0.0001.
Figure 5.
Figure 5.. Lactobacillus sequence variants are associated with decreased Th17 activation
(A–C) Stool stable in vitro communities (SICs) were derived from high-fat diet (HFD), HFD supplemented with a βHB ketone ester (HFD-KE), or a ketogenic diet (KD) mouse stool 7 days post EAE induction (1 donor/group, 4–5 SIC replicates). SIC cell-free supernatants (CFSs) were tested in a Th17 skewing assay, and community structure was assessed with 16S rRNA gene sequencing. (A) (Top) IL-17a levels were measured via ELISA post restimulation of Th17 skewed splenic T cells treated with CFSs from HFD-, HFD-KE-, and KD EAE-derived SICs where cells were treated for 4 days (n = 3 for Th17 skewing biological replicates, one-way ANOVA with Dunnett’s multiple comparisons test compared to BHI medium control; fold change is relative to the BHI medium control, which is represented by the dotted line; mean ± SEM). (Bottom) Heatmap of the relative abundance (log2) of amplicon sequence variants (ASVs) in the SICs with assigned genus (SILVA v.138 database). White denotes the absence of an ASV. (Right) Spearman correlation Rho values of ASV relative abundance and IL-17a levels (Spearman correlation). (B and C) Significantly negatively correlated ASVs with IL-17a levels, (B) ASV24 and (C) ASV3, from the Spearman correlation of ASV relative abundance and IL-17a levels are plotted in individual scatterplots (Spearman correlation; mean ± SEM). p value listed; *p < 0.05; **p < 0.01; ***p < 0.001; ****p < 0.0001.
Figure 6.
Figure 6.. A Lactobacillus murinus isolate and metabolite decrease disease severity on an HFD
(A) Tryptophan (Trp) metabolism pathway where Trp is metabolized to indole-3-pyruvate (IPYA) via aromatic aminotransferase and is then metabolized to ILA via indolelactate dehydrogenase (fldH) or lactate dehydrogenase (LDH). ILA can inhibit Th17 cells. (B) Top hits in the L. murinus KD6 genome for ArAT and D-LDH with percent identity (listed) and compared to Clostridium sporogenes, L. reuteri, and L. murinus via BLASTP (E value <1e–51). See also Tables S4 and S5. (C) ILA was quantified via high-resolution liquid chromatography-mass spectrometry from L. murinus KD6 or L. reuteri strain ATCC23272 cultured in BHICHV. The area ratio of ILA to labeled Trp (15N2 Trp) is displayed (n = 3 biological replicates L. murinus KD6 and L. reuteri; n = 1 for BHI control; mean ± SEM). (D) IL-17a levels in Th17 skewed cells that were incubated for 4 days with no treatment (NT), a vehicle control (PBS), or 200 μM indole-3-lactate (ILA) post restimulation (n = 7–8; each point represents a Th17 biological replicate one-way ANOVA Kruskal-Wallis with Dunn’s test; mean ± SEM; values are relative to NT; two independent experiments). (E–I) CONV-R specific pathogen-free female C57BL/6J mice were fed a high-fat diet (HFD) for 3 days prior to the start of oral gavage every other day with PBS, L. murinus KD6, or indole-3-lactate (ILA). EAE was induced 4 days later (n = 18 vehicle [PBS]; n = 19 L. murinus; n = 19 ILA; mean ± SEM; two independent experiments). (E) Disease scores (two-way ANOVA; mean ± SEM), (F) disease incidence rates (log-rank Mantel-Cox test; percentage), and (G) survival (log-rank Mantel-Cox test; percentage) were tracked over 18 days post immunization. (H) Mean disease severity of mice that developed disease (mean ± SEM; each point represents a diseased mouse). (I) Proportion of mice with maximum disease score after 18 days. (J) Relative abundance of ASV24 L. reuteri in mice fed HFD, HFD-KE, or KD 7 days post EAE induction as quantified by 16S-seq (related to Figures 2 and S5; n = 9–10; Kruskal-Wallis with Dunn’s test; Tukey box-and-whisker plot). (K) Relative abundance of ASV24 L. reuteri in mice with no or mild disease (EAE score of <2.5; n = 32) and mice with severe disease (score of >2.5; n = 5; Welch’s t tests; Tukey box-and-whisker plot). (L) Relative abundance of ILA-producing bacteria in control (n = 576), treated (n = 367), and untreated (n = 209) MS subjects (unpaired Wilcoxon tests). (M) Relative abundance of ILA-producing bacteria in MS subjects with mild, moderate, and severe disease. Mild: EDSS 0–3.5, no severe disability/highly ambulatory (n = 414); moderate: EDSS 4–6.5, severe disability while still ambulatory (n = 140); severe: EDSS 7–9.5, wheelchair bound (n = 21, unpaired Wilcoxon tests). p value listed; *p < 0.05; **p < 0.01; ***p < 0.001; ****p < 0.0001.

Update of

References

    1. Sanchez JMS, DePaula-Silva AB, Libbey JE, and Fujinami RS (2022). Role of diet in regulating the gut microbiota and multiple sclerosis. Clin. Immunol 235, 108379. - PMC - PubMed
    1. Fitzpatrick JA, Melton SL, Yao CK, Gibson PR, and Halmos EP (2022). Dietary management of adults with IBD - the emerging role of dietary therapy. Nat. Rev. Gastroenterol. Hepatol 19, 652–669. - PubMed
    1. Zmora N, Suez J, and Elinav E (2019). You are what you eat: diet, health and the gut microbiota. Nat. Rev. Gastroenterol. Hepatol 16, 35–56. - PubMed
    1. Vieira SM, Pagovich OE, and Kriegel MA (2014). Diet, microbiota and autoimmune diseases. Lupus 23, 518–526. - PMC - PubMed
    1. Thorburn AN, Macia L, and Mackay CR (2014). Diet, metabolites, and “western-lifestyle” inflammatory diseases. Immunity 40, 833–842. - PubMed

Publication types

MeSH terms

Substances