. 2024 Nov 4;12(11):e009494.
doi: 10.1136/jitc-2024-009494.

Cancer-associated fibroblasts shape early myeloid cell response to chemotherapy-induced immunogenic signals in next generation tumor organoid cultures

Affiliations

Cancer-associated fibroblasts shape early myeloid cell response to chemotherapy-induced immunogenic signals in next generation tumor organoid cultures

Julijan Kabiljo et al. J Immunother Cancer. .

Abstract

Background: Patient-derived colorectal cancer (CRC) organoids (PDOs) solely consisting of malignant cells led to major advances in the understanding of cancer treatments. Yet, a major limitation is the absence of cells from the tumor microenvironment, thereby prohibiting potential investigation of treatment responses on immune and structural cells. Currently there are sparse reports describing the interaction of PDOs, cancer-associated fibroblasts (CAFs) and tumor-associated macrophages (TAMs) in complex primary co-culture assay systems.

Methods: Primary PDOs and patient matched CAF cultures were generated from surgical resections. Co-culture systems of PDOs, CAFs and monocytic myeloid cells were set up to recapitulate features seen in patient tumors. Single-cell transcriptomics and flow cytometry was used to show effects of culture systems on TAM populations in the co-culture assays under chemotherapeutic and oncolytic viral treatment.

Results: In contrast to co-cultures of tumor cells and monocytes, CAF/monocyte co-cultures and CAF/monocyte/tumor cell triple cultures resulted in a partial differentiation into macrophages and a phenotypic switch, characterized by the expression of major immunosuppressive markers comparable to TAMs in CRC. Oxaliplatin and 5-fluorouracil, the standard-of-care chemotherapy for CRC, induced polarization of macrophages to a pro-inflammatory phenotype comparable to the immunogenic effects of treatment with an oncolytic virus. Monitoring phagocytosis as a functional proxy to macrophage activation and subsequent onset of an immune response, revealed that chemotherapy-induced cell death, but not virus-mediated cell death, is necessary to induce phagocytosis of CRC cells. Moreover, CAFs enhanced the phagocytic activity in chemotherapy treated CRC triple cultures.

Conclusions: Primary CAF-containing triple cultures successfully model TAM-like phenotypes ex vivo and allow the assessment of their functional and phenotypic changes in response to treatments following a precision medicine approach.

Keywords: Cancer associated fibroblasts; Chemotherapy; Colorectal Cancer; Organoids; Tumor Associated Macrophages.


Conflict of interest statement

Competing interests: None declared.

Figures

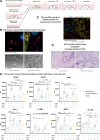
Figure 1
Figure 1. Single-cell transcriptomics of CAF co-cultures with monocytic myeloid cells reveal CAF-induced TAM-like phenotypes. (A) Schematic representation of the experimental set-up. Cultures were incubated in the basal medium. (B) Visualization of the data set (n=29,449 single cells) using Uniform Manifold Approximation and Projection based on the sample type and cell type features. Overlaid expression of the markers FCER1G and COL1A2 (inside the box). (C) Violin plots of monocytic differentiation and TAM markers expression. Data is represented based on the Z-score of expression, sorted by the sample type, each dot represents one cell. (D) Gene Set Enrichment Analysis using Enrichr (based on MSigDB 2020 Database) of the top 200 upregulated genes in monocytes co-cultured with CAFs for 24 hours. (E) Dot plots showing average expression of chosen pro-inflammatory chemokines upregulated in monocytes co-cultured with CAFs for 24 hours. (F) Dot plots showing average expression of iCAF and myCAF genes expressed in CAFs cultured alone and co-cultured with monocytes for 24 hours. CAF, cancer-associated fibroblast; DC, dendritic cell; iCAF, inflammatory cancer associated fibroblast; myCAF, myofibroblastic cancer associated fibroblast; NK, natural killer; TAM, tumor-associated macrophage.
Figure 2
Figure 2. Monocyte differentiation to TAM-like monocytic myeloid cells in three-dimensional co-cultures with CRC organoids depends on the physical presence of CAFs. (A) Schematic representation of the experimental set-up. (B) Immunofluorescence (IF) staining of FFPE sections of a CAF, monocyte and CRC organoid triple culture 72 hours after seeding and culture in basal medium, as well as imaging unstained cultures. Upper images depict IF (DAPI, blue; CD45, red; PanCK, green). Lower images depict the brightfield of live cultures. Monocytes in focus, depicting their morphology in the respective culture conditions. Culture conditions and scale bar are indicated below. (C) Immunofluorescence staining of FFPE sections of a co-culture set-up of monocytes, PDOs and CAFs cultured for 72 hours in basal medium (DAPI, blue; vimentin, yellow; CD45, red; PanCK, green). (D) H&E staining of FFPE sections of a co-culture set-up of monocytes, PDOs and CAFs cultured for 72 hours in basal medium as well as a representative CRC tumor. (E) Flow cytometry quantification of CD206, CD163, CD86, HLA-DR, PD-L1, SIRPα and 4-1BBL median fluorescence intensity (MFI) on macrophages on indicated co-cultures in various media for 3 days. ns p>0.05; *p≤0.05; **p≤0.01; ***p≤0.001; ****p≤0.0001. CAF, cancer-associated fibroblast; CRC, colorectal cancer; DAPI, 4',6-diamidino-2-phenylindole, dihydrochloride; ECM, extracellular matrix; FFPE, formaldehyde-fixed paraphin embedded; PDO, patient-derived organoid; TAM, tumor-associated macrophage.
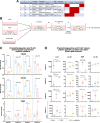
Figure 3
Figure 3. Single-cell transcriptomics of triple cultures enables the definition of distinct myeloid cell states and associated RNA expression profiles induced in response to treatment with chemotherapy or O-IAV. (A) Experimental set-up. Co-cultures were incubated in the basal medium. (B) Visualization of the data set (n=9,528 single cells) using UMAP projection based on the sample type and cell type features. (C) UMAP projection of re-clustered TAM. (D) Violin plots of monocytic differentiation and TAM marker expression. Data is represented based on the Z-score of expression, sorted by the sample type, each dot represents one cell. (E) Venn diagrams (visualized using Venny V.2.0) and Gene Set Enrichment Analysis (GSEA) using Enrichr (based on MsigDB 2020 database) of the common therapy response signatures based on a comparison of the top 100 (TAM) and top 100 (CAFs) upregulated genes. (F) Dot plots showing average expression of ligands and receptors upregulated by O-IAV and chemotherapy represented in all three cell types. CAF, cancer-associated fibroblast; CRC, colorectal cancer; O-IAV, oncolytic influenza A virus; PDO, patient-derived organoid; scRNA-seq, single-cell RNA sequencing; TAM, tumor-associated macrophage; UMAP, Uniform Manifold Approximation and Projection; 5-FU, 5-fluorouracil.
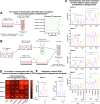
Figure 4
Figure 4. Chemotherapeutics and oncolytic influenza A viruses induce repolarization of tumor-associated macrophage-like cells in primary triple culture assays. (A) Table of patient characteristics. (B) Experimental set-up. Cultures incubated in basal medium. (C) Quantification of CD206, CD163 and CD86 median fluorescence intensity (MFI) normalized to the corresponding patient’s MFI from the untreated condition, measured on macrophages from treated triple cultures. (D) Quantification of cytokine concentrations (ng/mL) in the supernatants collected from C, determined via LEGENDplex assay. Upper detection limits are indicated by a dashed line. ns p>0.05; *p≤0.05; **p≤0.01; ***p≤0.001; ****p≤0.0001. All color-coded scatter-plot circles represent measurements from individual donors. CAF, cancer-associated fibroblast; IL, interleukin; O-IAV, oncolytic influenza A virus; PDO, patient-derived organoid; 5-FU, 5-fluorouracil; TNF, tumour necrosis factor.
Figure 5
Figure 5. Oncolytic viruses and chemotherapy induce varying, patient-dependent levels of CRC organoid phagocytosis via distinct mechanisms. (A) Flow cytometry analysis of phagocytosis assay using BioParticles. Monocytes were incubated alone or in the presence of patient with CRC-derived CAFs isolated from four patients for 3 days and subsequently co-cultured with BioParticles for 2.5 hours. (B) Scheme of experimental set-up of phagocytosis assay after treatments. Organoids were seeded simultaneously and subjected to medium changes introducing the indicated therapeutics or viral infections, leading to treatment durations of either 6 days or 1 day before CFSE stain and 2.5 hours culture with monocytes or a CAF/monocyte mixture. (C) Flow cytometry measurements of phagocytotic events detected as CD14/CD11b+CFSE+ cells. (D) Heat-map showing the change in phagocytosis after CAF introduction for each condition depicted in C. (E) Flow cytometry analysis of phagocytosis under viral treatment and oxaliplatin treatment in the presence or absence of inhibitors of cell death (10 µM zVAD, 2 µM GSK’872). ns p>0.05; *p≤0.05; **p≤0.01; ***p≤0.001; ****p≤0.0001. All color-coded scatter-plot circles represent measurements from individual donors. CAF, cancer-associated fibroblast; CFSE, carboxyfluorescein diacetate succinimidyl ester; CRC, colorectal cancer; O-IAV, oncolytic influenza A virus; PDO, patient-derived tumor organoid; 5-FU, 5-fluorouracil.

References

    1. Schouppe E, De Baetselier P, Van Ginderachter JA, et al. Instruction of myeloid cells by the tumor microenvironment: Open questions on the dynamics and plasticity of different tumor-associated myeloid cell populations. Oncoimmunology. 2012;1:1135–45. doi: 10.4161/onci.21566. - DOI - PMC - PubMed
    1. Bonavita E, Galdiero MR, Jaillon S, et al. Phagocytes as Corrupted Policemen in Cancer-Related Inflammation. Adv Cancer Res. 2015;128:141–71. doi: 10.1016/bs.acr.2015.04.013. - DOI - PubMed
    1. Yahaya MAF, Lila MAM, Ismail S, et al. Tumour-Associated Macrophages (TAMs) in Colon Cancer and How to Reeducate Them. J Immunol Res. 2019;2019:2368249. doi: 10.1155/2019/2368249. - DOI - PMC - PubMed
    1. Wang H, Tian T, Zhang J. Tumor-Associated Macrophages (TAMs) in Colorectal Cancer (CRC): From Mechanism to Therapy and Prognosis. Int J Mol Sci. 2021;22:8470. doi: 10.3390/ijms22168470. - DOI - PMC - PubMed
    1. Hourani T, Holden JA, Li W, et al. Tumor Associated Macrophages: Origin, Recruitment, Phenotypic Diversity, and Targeting. Front Oncol. 2021;11:788365. doi: 10.3389/fonc.2021.788365. - DOI - PMC - PubMed

MeSH terms