. 2024 Dec;46(2):2422435.
doi: 10.1080/0886022X.2024.2422435. Epub 2024 Nov 5.

Histone deacetylase 9 promotes osteogenic trans-differentiation of vascular smooth muscle cells via ferroptosis in chronic kidney disease vascular calcification

Affiliations

Histone deacetylase 9 promotes osteogenic trans-differentiation of vascular smooth muscle cells via ferroptosis in chronic kidney disease vascular calcification

Lin Xiong et al. Ren Fail. 2024 Dec.

Abstract

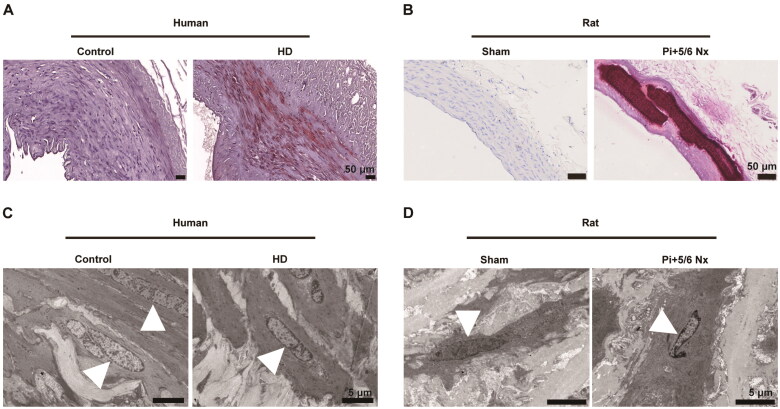
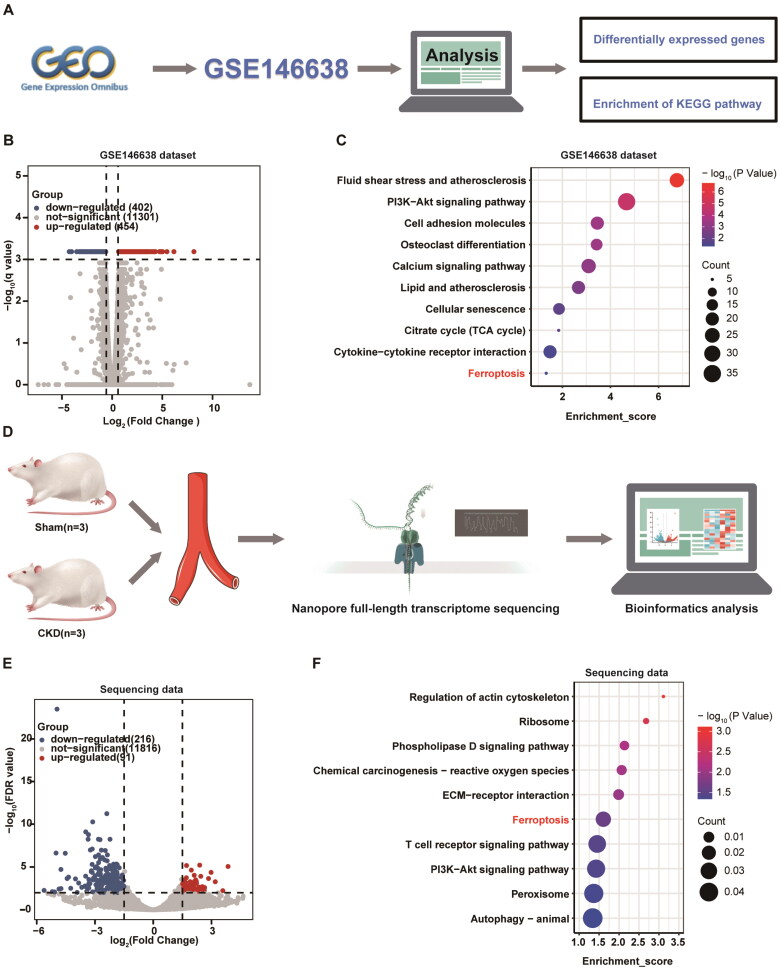
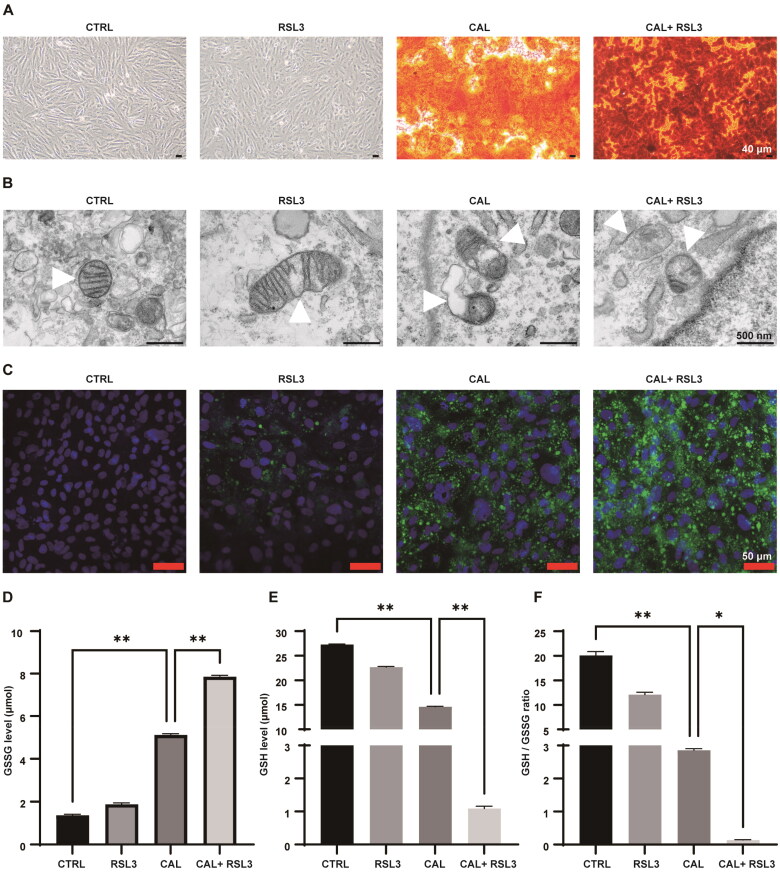
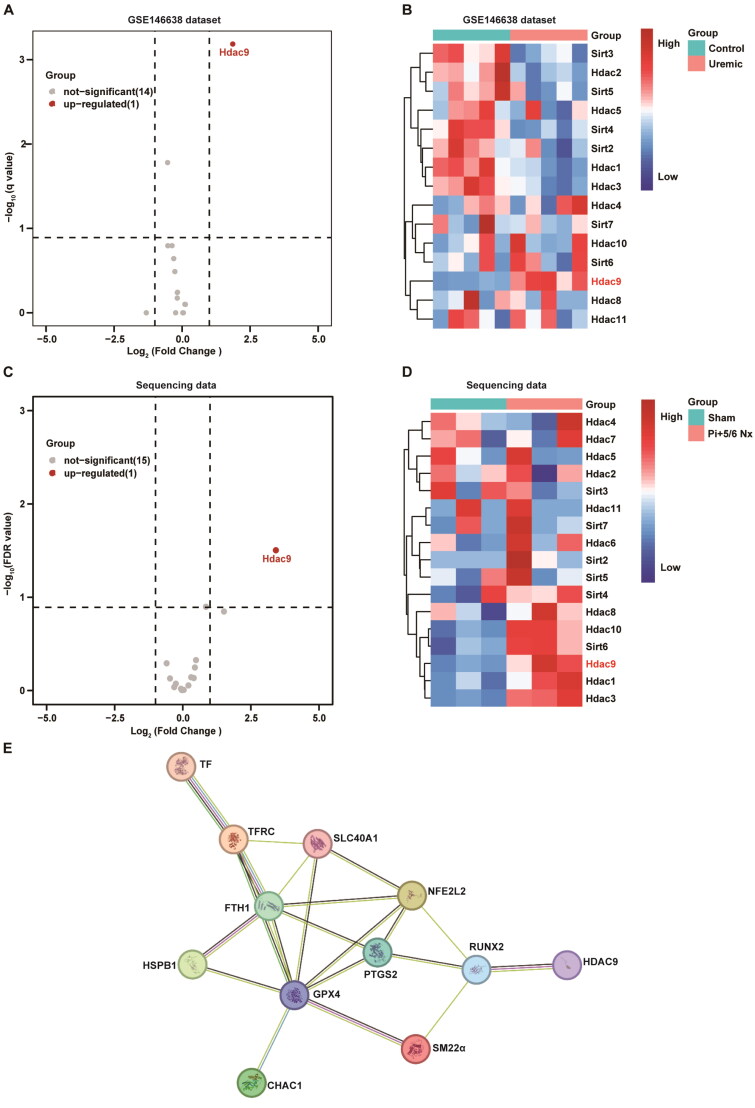
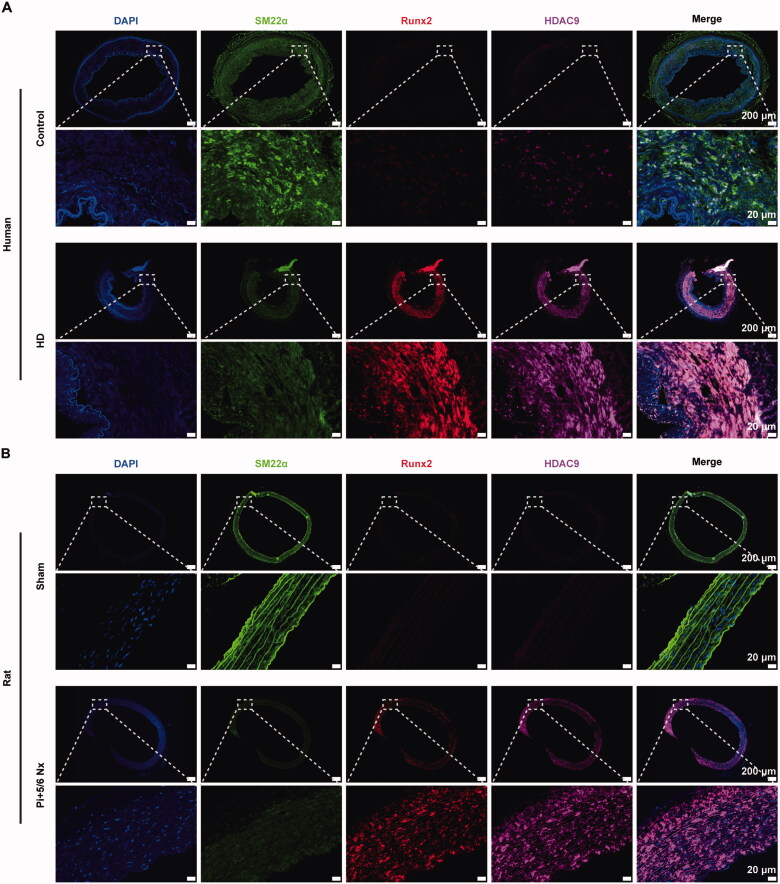
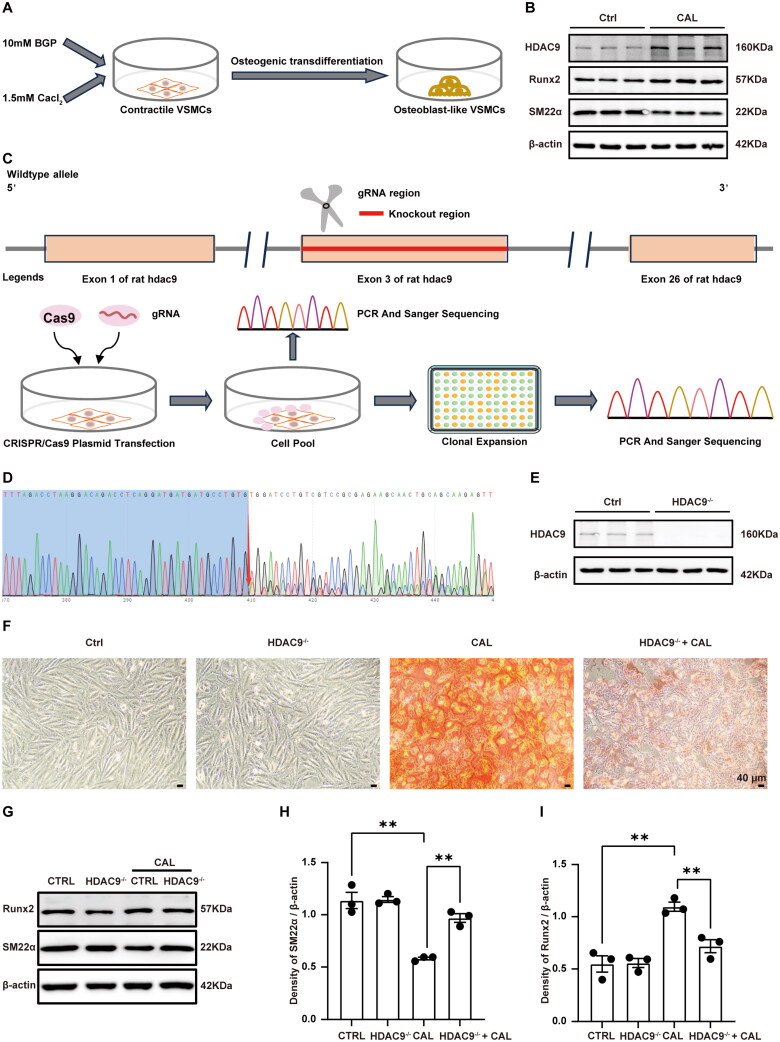
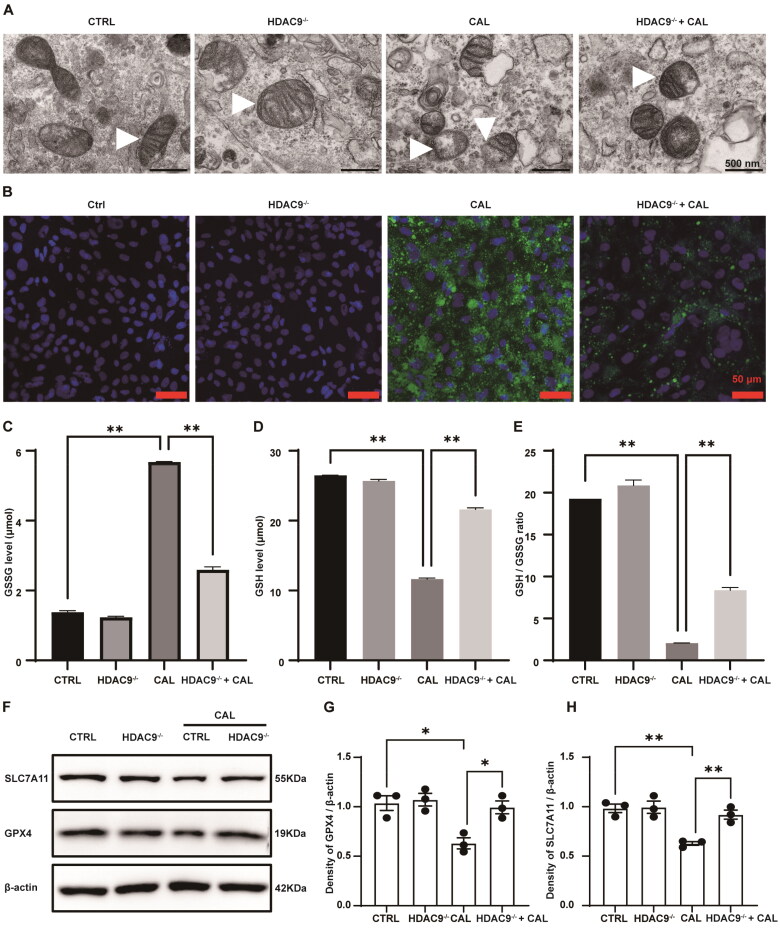
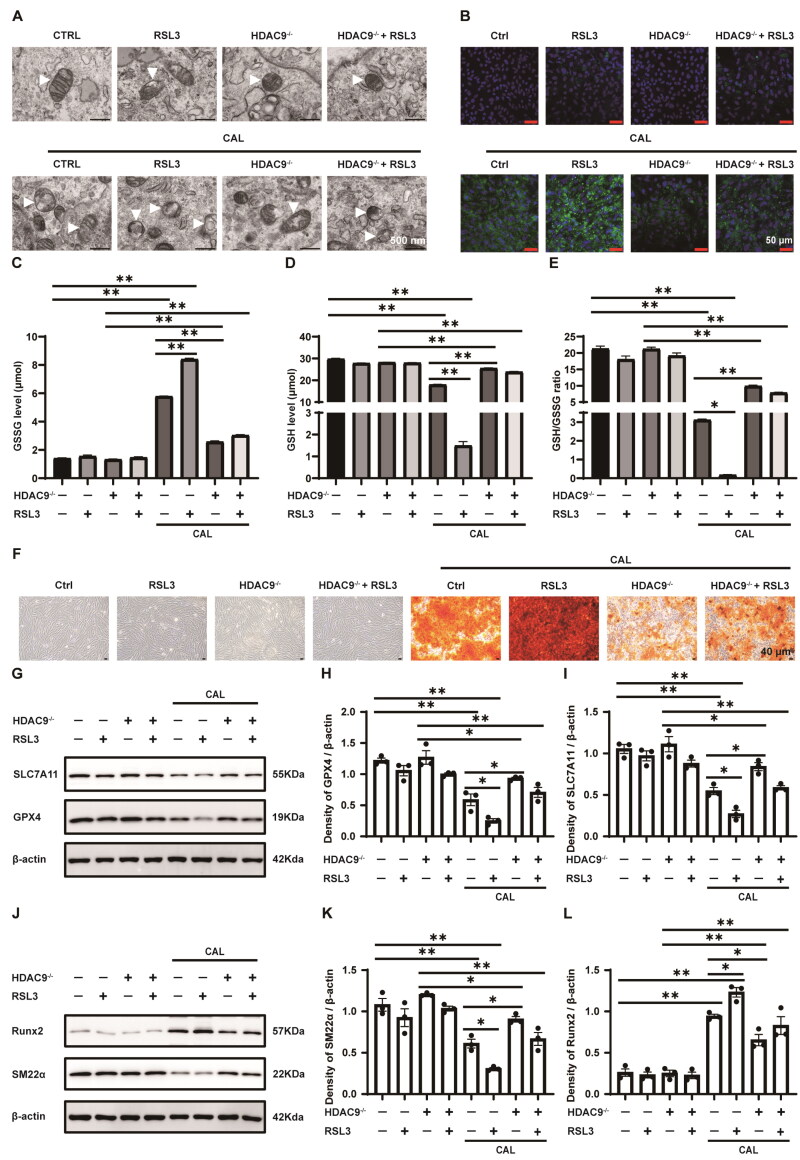
Vascular calcification, a common complication of chronic kidney disease (CKD), remains an unmet therapeutic challenge. The trans-differentiation of vascular smooth muscle cells (VSMCs) into osteoblast-like cells is crucial in the pathogenesis of vascular calcification in CKD. Despite ferroptosis promotes vascular calcification in CKD, the upstream or downstream regulatory mechanisms involved remains unclear. In this study, we aimed to investigate the regulatory mechanism involved in ferroptosis in CKD vascular calcification. Transcriptome sequencing revealed a potential relationship between HDAC9 and ferroptosis in CKD vascular calcification. Subsequently, we observed increased expression of HDAC9 in calcified arteries of patients undergoing hemodialysis and in a rat model of CKD. We further demonstrated that knockout of HDAC9 attenuates osteogenic trans-differentiation and ferroptosis in VSMCs stimulated by high calcium and phosphorus. In addition, RSL3 exacerbated ferroptosis and osteogenic trans-differentiation of VSMCs exposed to high levels of calcium and phosphorus, and these effects were suppressed to some extent by HDAC9 knockout. In summary, our findings suggest that HDAC9 promotes VSMCs osteogenic trans-differentiation involving ferroptosis, providing new insights for the therapy of CKD vascular calcification.

Keywords: HDAC9; ferroptosis; osteogenic trans-differentiation; vascular calcification; vascular smooth muscle cell.


Conflict of interest statement

No potential conflict of interest was reported by the author(s).

Figures

Figure 1.
Figure 1.
Ferroptosis occurs in the calcified arteries of patient with hemodialysis and rats subjected to 5/6 nephrectomy and a high-phosphorus diet. (A) Representative alizarin red staining of human arterial sections from control and patient with hemodialysis (HD). Calcified areas were visualized by red staining. Scale bars, 50 μm. (B) Representative alizarin red staining of the aorta in rats receiving a sham operation or 5/6 nephrectomy (5/6 Nx) and a high-phosphorus diet. Scale bars, 50 μm. (C–D) Ultrastructure of mitochondria in arterial sections of human (C) and rat (D) observed by transmission electron microscopy. White triangles indicate mitochondria. Scale bars, 5 μm
Figure 2.
Figure 2.
GSE146638 Dataset and nanopore full-length transcriptome sequencing indicated that ferroptosis is associated with CKD vascular calcification. (A) Overview of the analytical procedures for the GSE146638 dataset. (B) Volcano plot depicting differentially expressed genes (DEGs) in the arterial tissues of control (n = 5) and uremic groups (n = 5) from the GSE146638 dataset. The uremic group represents a model of vascular calcification in rats with CKD. (C) Bubble diagram of representative pathways for Kyoto Encyclopedia of genes and Genomes (KEGG) pathway analysis of DEGs in the GSE146638 dataset. The size of each bubble represents the number of genes enriched in a pathway, and the color indicates the level of significance, with deeper red indicating a more significant difference. (D) Overview of the analytical procedures for nanopore full-length transcriptome sequencing. (E) Volcano plot displaying the DEGs in the sham groups (n = 3) and Pi + 5/6 Nx groups (n = 3) from the nanopore full-length transcriptome sequencing data. Pi + 5/6 Nx rats represent a vascular calcification model of CKD. Nx, nephrectomy. (F) Bubble diagram of representative pathways for KEGG pathway analysis of DEGs in the nanopore full-length transcriptome sequencing data. The size of each bubble represents the number of genes enriched in a pathway, and the color indicates the level of significance, with deeper red indicating a more significant difference
Figure 3.
Figure 3.
Ferroptosis facilitates calcium deposition and lipid peroxidation in VSMCs following treatment with high concentrations of calcium and phosphorus. VSMCs were treated with growth medium or calcifying medium supplemented with or without RSL3 (0.5 μM) for 5 d. (A) Representative images of Alizarin Red staining of VSMCs. Red color indicates calcium deposition. Scale bar, 40 μm. (B) The mitochondrial ultrastructure of VSMCs was examined using transmission electron microscopy. White triangles indicate mitochondria. Scale bar, 500 nm. (C) Detection of lipid peroxidation in VSMCs using a commercial liperidluo kit. Green indicates lipid peroxides, and blue indicates nuclei stained with 4′,6-diamidino-2-phenylindole (DAPI). (D–E) The oxidized glutathione (GSSG) and reduced glutathione (GSH) contents in VSMCs were assessed using commercially available GSSG and GSH kits. (F) The GSH-to-GSSG ratio was calculated for each group. ‘CAL’ indicates the cells were treated with a calcifying medium containing high concentrations of calcium and phosphorus for 5 days. *p < .05 and **p < .01
Figure 4.
Figure 4.
Bioinformatics analysis suggested that HDAC9 is involved in ferroptosis in CKD vascular calcification. (A–B) Volcano plot (A) and heatmap (B) displaying differentially expressed genes (DEGs) within the histone deacetylation family in the arteries of the control (n = 5) and uremic groups (n = 5) from the GSE146638 dataset. The uremic group represents a model of vascular calcification in CKD rats. (C–D) Volcano plot (C) and heatmap (D) of DEGs within the histone deacetylation family in the aorta of the sham group (n = 3) and Pi + 5/6 Nx group (n = 3) from nanopore full-length transcriptome sequencing data. Nx, nephrectomy. (E) The string database predicts protein interactions of HDAC9 with ferroptosis-associated proteins via Runx2 and SM22α
Figure 5.
Figure 5.
Increased expression of HDAC9 in calcified arteries of human and CKD rat models. (A–B) Representative images of immunofluorescence staining for SM22α (green), Runx2 (red), and HDAC9 (purple) in human (A) or rat aortas sections (B). The control group represents a normal artery from a patient who underwent amputation surgery. The HD group represents a calcified artery from a patient who underwent maintenance hemodialysis with vascular calcification. Nuclei were counterstained with DAPI (blue). Nx: nephrectomy. Scale bar: 200 µm (low power). Scale bar: 20 µm (high power)
Figure 6.
Figure 6.
Effect of HDAC9 on the osteogenic trans-differentiation of VSMCs upon stimulation with high levels of calcium and phosphorus. (A) a schematic protocol for inducing osteogenic trans-differentiation in VSMCs. (B) Western blot analysis of SM22α and Runx2 and HDAC9 expression in VSMCs. (C) Overview of the CRISPR/Cas9 technology-mediated knockout of HDAC9 in VSMCs. (D) Sanger sequencing was conducted on clonal cell lines following HDAC9 knockout in VSMCs. (E) Western blot analysis of HDAC9 expression in VSMCs. (F) Representative images of Alizarin Red staining of normal VSMCs and HDAC9 knockout VSMCs. Scale bars, 50 μm. (G–I) The protein expression levels and semiquantitative analysis of SM22α and Runx2 expression in VSMCs. ‘HDAC9-/-’ indicates knockout of HDAC9 in VSMCs. ‘CAL’ indicates the cells were treated with a calcifying medium containing high concentrations of calcium and phosphorus for 5 d. N = 3 independent experiments. **p < .01
Figure 7.
Figure 7.
Effect of HDAC9 on ferroptosis in VSMCs under conditions of elevated calcium and phosphorus levels. (A) Representative images of the mitochondrial ultrastructure in VSMCs using transmission electron microscopy. White triangles indicate mitochondria. Scale bars, 500 nm. (B) Lipid peroxidation in VSMCs was detected using the Liperfluo kit. Green indicates lipid peroxidation, with nuclei counterstained with DAPI (blue). Scale bar, 50 μm. (C,D) The concentrations of GSSG and reduced GSH (GSH) in VSMCs. (E) The ratio of reduced GSH (GSH) to GSSG was calculated for each group. (F–H) The protein levels of GPX4 and SLC7A11 in VSMCs. ‘HDAC9−/−’ indicates the knockout of HDAC9 in VSMCs. ‘CAL’ indicates the cells were treated with a calcifying medium containing high concentrations of calcium and phosphorus for 5 days. N = 3 independent experiments. *p < .05 and **p < .01
Figure 8.
Figure 8.
The role of HDAC9 in RSL3-mediated ferroptosis and osteogenic trans-differentiation of VSMCs under high calcium and phosphorus conditions. VSMCs with and without HDAC9 were cultured in growth or calcifying medium, with or without RSL3 (0.5 uM), for 5 d. (A) Representative transmission electron microscopy images of the ultrastructure of mitochondria in VSMCs. White triangles indicate mitochondria. Scale bar, 500 nm. (B) Lipid peroxidation in VSMCs was assessed using the Liperfluo kit. Green indicates lipid peroxidation. Nuclei were counterstained with DAPI (blue). Scale bar, 50 μm. (C,D) The levels of oxidized glutathione (GSSG) and reduced glutathione (GSH). (E) The ratio of GSH/GSSG for each group was calculated. (F) Calcium deposition was visualized with Alizarin Red S staining. Scale bar, 40 μm. (G–I) The protein expression levels and semiquantitative analysis of GPX4 and SLC7A11 in VSMCs. (J–L) The protein expression levels and semiquantitative analysis of SM22α and Runx2 in VSMCs. ‘HDAC9−/−’ indicates knockout of HDAC9 in VSMCs. ‘CAL’ indicates the cells were treated with a calcifying medium containing high concentrations of calcium and phosphorus for 5 days. N = 3 independent experiments. *p < .05 and **p < .01.

Similar articles

References

    1. GBD Chronic Kidney Disease Collaboration . Global, regional, and national burden of chronic kidney disease, 1990-2017: a systematic analysis for the Global Burden of Disease Study 2017. Lancet. 2020;10225(395):709–733. doi:10.1016/s0140-6736(20)30045-3. - DOI - PMC - PubMed
    1. Swartling O, Rydell H, Stendahl M, et al. . CKD progression and mortality among men and women: a Nationwide study in Sweden. Am J Kidney Dis. 2021;78(2):190–199.e1. doi:10.1053/j.ajkd.2020.11.026. - DOI - PubMed
    1. Johansen KL, Chertow GM, Gilbertson DT, et al. . US renal data system 2022 annual data report: epidemiology of kidney disease in the United States. Am J Kidney Dis. 2023;81(3 Suppl1):A8–A11. doi:10.1053/j.ajkd.2022.12.001. - DOI - PMC - PubMed
    1. Cozzolino M, Mangano M, Stucchi A, et al. . Cardiovascular disease in dialysis patients. Nephrol Dial Transplant. 2018;33(suppl_3):iii28–iii34. doi:10.1093/ndt/gfy174. - DOI - PMC - PubMed
    1. Chen J, Budoff MJ, Reilly MP, et al. . Coronary artery calcification and risk of cardiovascular disease and death among patients with chronic kidney disease. JAMA Cardiol. 2017;2(6):635–643. doi:10.1001/jamacardio.2017.0363. - DOI - PMC - PubMed

MeSH terms