

In-Stent Restenosis in Peripheral Arterial Disease: Ultra-High-Resolution Photon-Counting Versus Third-Generation Dual-Source Energy-Integrating Detector CT Phantom Study in Seven Different Stent Types
- PMID: 39500749
- PMCID: PMC11706893
- DOI: 10.1007/s00270-024-03874-y
In-Stent Restenosis in Peripheral Arterial Disease: Ultra-High-Resolution Photon-Counting Versus Third-Generation Dual-Source Energy-Integrating Detector CT Phantom Study in Seven Different Stent Types
Abstract
Purpose: The visualization of peripheral in-stent restenosis using energy-integrating detector CT is challenging due to deficient spatial resolution and artifact formation. This study compares the first clinically available photon-counting detector CT to third-generation dual-source energy-integrating detector CT.
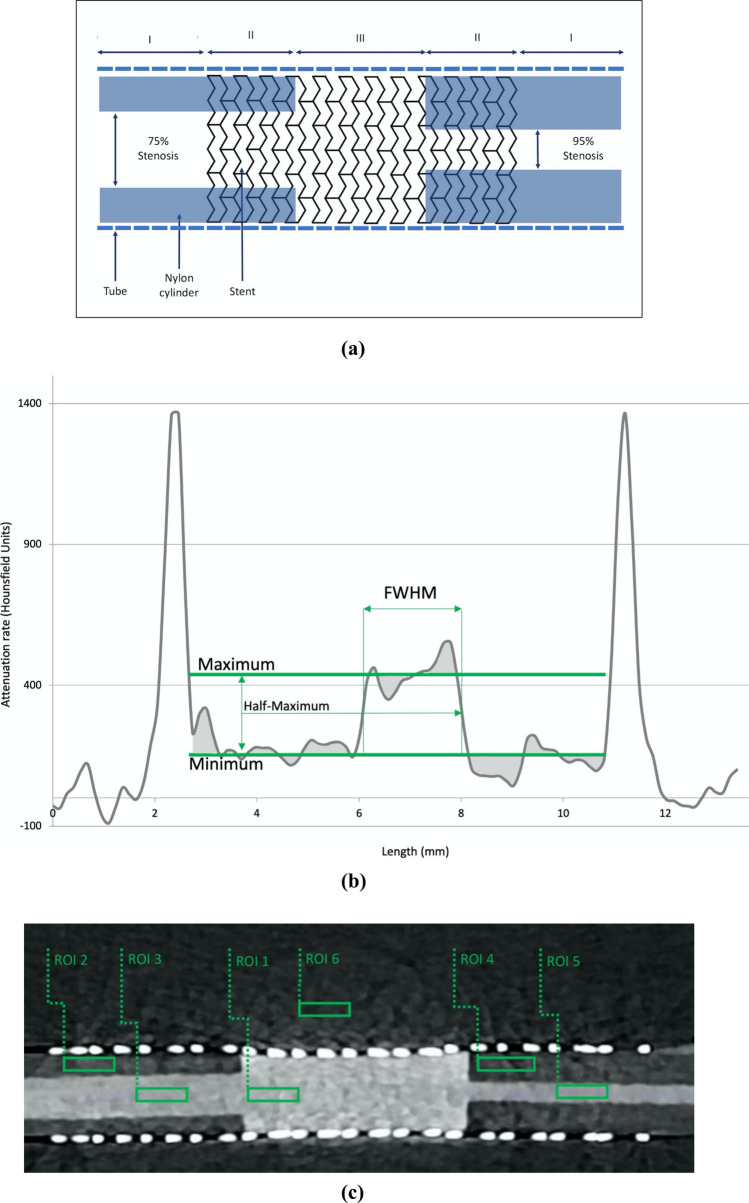
Materials and methods: Nylon cylinders with central bores (4 mm, 2 mm), mimicking 75% and 95% stenoses, were placed inside seven different 8-mm diameter stents and filled with diluted contrast medium. Phantoms were scanned with photon-counting detector CT at slice thicknesses of 0.2 mm (available only in this scanner type), 0.5 mm, and 1.0 mm versus 0.5 mm and 1.0 mm in energy-integrating detector CT at matched CT dose indices. Contrast-to-noise ratios were calculated from attenuation rates. Residual lumen size was measured as full width at half-maximum. Subjective image quality was assessed by two independent blinded raters.
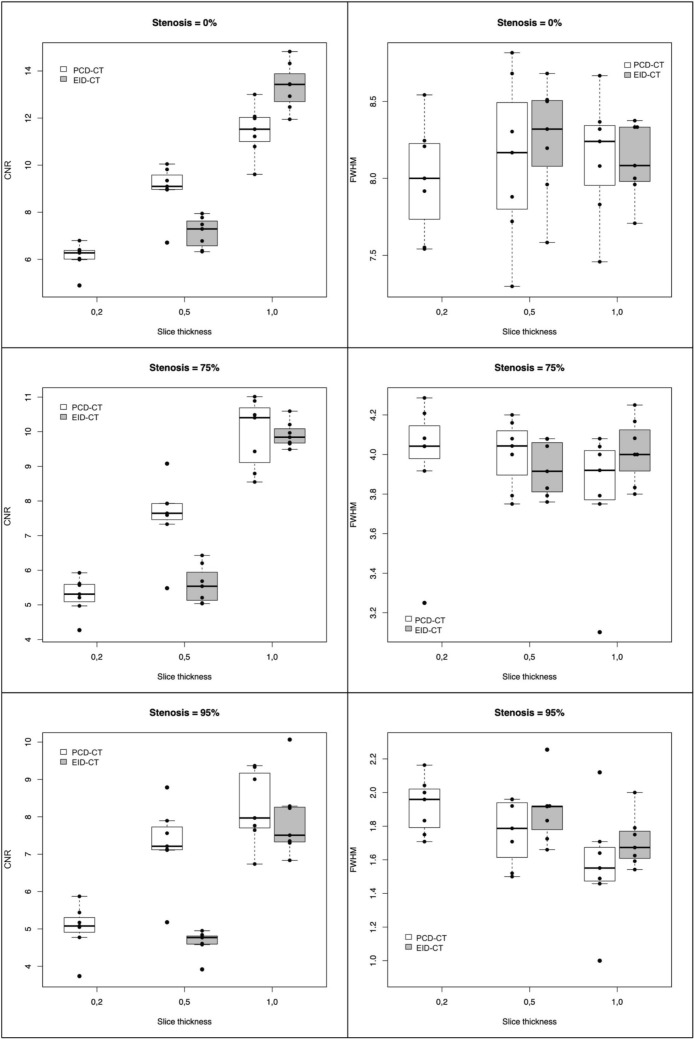
Results: Mean contrast-to-noise ratio was lowest in photon-counting detector CT at 0.2 mm slice thickness (0%, 75%, and 95% in-stent restenosis: 6.11 ± 0.6, 5.27 ± 0.54, and 5.02 ± 0.66) and highest at 1.0 mm slice thicknesses with similar measurements in photon-counting detector CT and energy-integrating detector CT (11.46 ± 1.08, 9.94 ± 1.01, 8.26 ± 1.0 vs. 3.34 ± 1.0, 9.92 ± 0.38, 7.94 ± 1.07). Mean full width at half-maximum measurements in photon-counting detector CT at 0.2 mm slice thickness for 0%, 75%, and 95% in-stent restenosis were 8.00 ± 0.37, 3.98 ± 0.34, and 1.92 ± 0.16 mm. Full width at half-maximum was least precise in 95% in-stent restenosis at 1.0 mm slice thickness with similar measurements between scanners (1.57 ± 0.33 vs. 1.71 ± 0.15 mm). Interrater correlation coefficient was 0.75 [95% CI: [0.53; 0.86]; subjective scores were best at 0.2 mm slice thickness in photon-counting detector CT (19.43 ± 0.51 and 19.00 ± 0.68).
Conclusion: In phantom in-stent restenosis in 8 mm stents, we observed similar full width at half-maximum for photon-counting detector CT and energy-integrating detector CT in 0% and 75% in-stent restenosis, but at 95% in-stent restenosis, FWHM tended to be more accurate in smaller slice thicknesses in both scanners. Subjective image assessment yielded best results at 0.2 mm slice thickness in photon-counting detector CT despite lower contrast-to-noise ratio.
Keywords: Energy-integrating detector CT; In-stent restenosis; Phantom study; Ultra-high-resolution photon-counting detector CT.
© 2024. The Author(s).
Conflict of interest statement
Declarations. Conflict of interest: The authors declare that they have no conflict of interest. Consent for publication: For this type of study, consent for publication is not required. Ethical approval: This article does not contain any studies with human participants or animals performed by any of the authors. Informed consent: For this type of study, informed consent is not required.
Figures

References
-
- Siemens Healthineers launches world’s first CT scanner with photon-counting technology. [Online]. Available: https://www.siemens-healthineers.com/press/releases/naeotomalpha. [Accessed: 28-Aug-2024].
-
- Willemink MJ, Persson M, Pourmorteza A, Pelc NJ, Fleischmann D. Photon-counting CT: technical principles and clinical prospects. Radiology. 2018;289(2):293–312. - PubMed
-
- Flohr T, Petersilka M, Henning A, Ulzheimer S, Ferda J, Schmidt B. Photon-counting CT review. Physica Med. 2020;79:126–36. - PubMed
-
- Leiner T. A new era in atherosclerotic plaque characterization with photon-counting CT. Radiology. 2021;300(1):108–9. - PubMed
Publication types
MeSH terms
Substances
LinkOut - more resources
Full Text Sources
Medical
