. 2024 Nov 6;15(1):9568.
doi: 10.1038/s41467-024-53634-2.

High incidence and geographic distribution of cleft palate in Finland are associated with the IRF6 gene

Affiliations

High incidence and geographic distribution of cleft palate in Finland are associated with the IRF6 gene

Fedik Rahimov et al. Nat Commun. .

Abstract

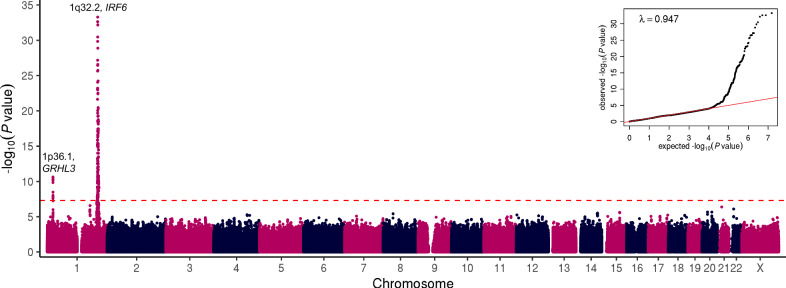
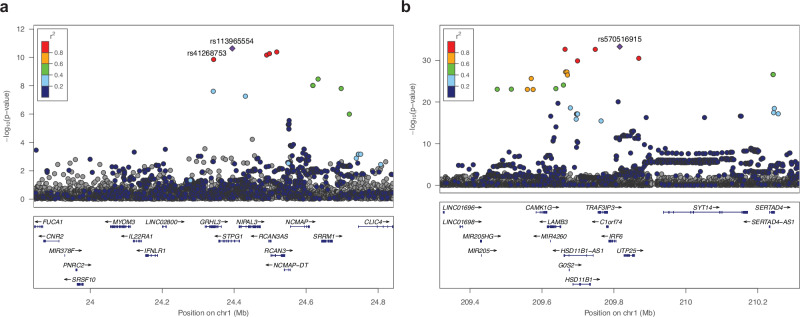
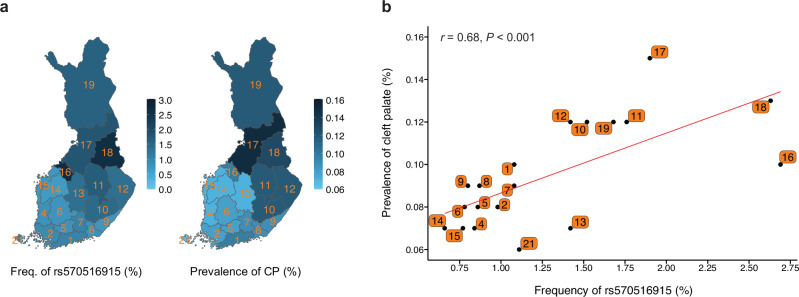
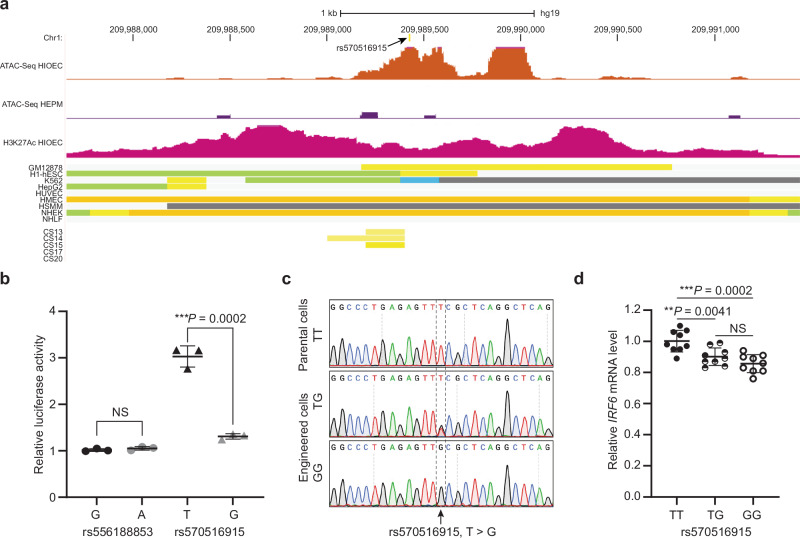
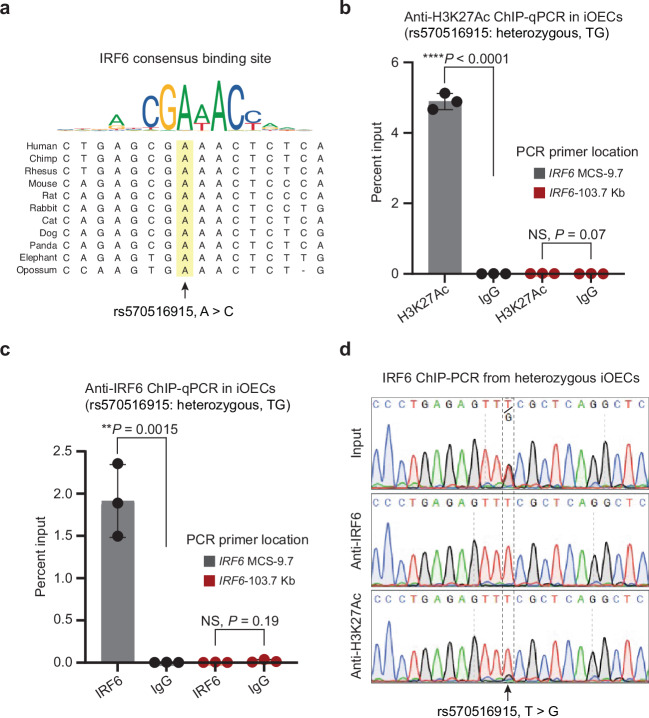
In Finland, the frequency of isolated cleft palate (CP) is higher than that of isolated cleft lip with or without cleft palate (CL/P). This trend contrasts to that in other European countries but its genetic underpinnings are unknown. We conducted a genome-wide association study in the Finnish population and identified rs570516915, a single nucleotide polymorphism highly enriched in Finns, as strongly associated with CP (P = 5.25 × 10⁻³⁴, OR = 8.65, 95% CI 6.11-12.25), but not with CL/P (P = 7.2 × 10⁻⁵), with genome-wide significance. The risk allele frequency of rs570516915 parallels the regional variation of CP prevalence in Finland, and the association was replicated in independent cohorts of CP cases from Finland (P = 8.82 × 10⁻²⁸) and Estonia (P = 1.25 × 10⁻⁵). The risk allele of rs570516915 alters a conserved binding site for the transcription factor IRF6 within an enhancer (MCS-9.7) upstream of the IRF6 gene and diminishes the enhancer activity. Oral epithelial cells derived from CRISPR-Cas9 edited induced pluripotent stem cells demonstrate that the CP-associated allele of rs570516915 concomitantly decreases the binding of IRF6 and the expression level of IRF6, suggesting impaired IRF6 autoregulation as a molecular mechanism underlying the risk for CP.


Conflict of interest statement

F.R. is a current employee and stockholder of AbbVie, Inc. K.B. is co-founder of Matchstick Technologies, Inc and a co-inventor of PIXUL (US Patents 10809166, 11592366). Andrea Ganna is founder of Real World Genetics Oy. The remaining authors declare no competing interests.

Figures

Fig. 1
Fig. 1. Manhattan and quantile-quantile plots showing GWAS results of 228 cases affected with non-syndromic CP and 308,799 population controls in the FinnGen discovery cohort.
Negative log10 P values (y axis) are plotted for each tested variant against their chromosomal coordinates (x axis) provided in the human genome build GRCh38/hg38. Two-sided P values are obtained from a likelihood ratio test in regression analysis and are not corrected for multiple comparisons. Red dashed line represents the threshold for genome-wide statistical significance (P = 5 × 10–8 or log10(P) = 7.3) after Bonferroni correction for multiple hypothesis testing. A quantile-quantile plot is shown in the inset panel, where the observed ( y axis) negative log10 P values are plotted against the expected (x axis) negative log10 P values under null distribution (red line).
Fig. 2
Fig. 2. Regional association plots of the chromosome 1 risk loci for non-syndromic CP.
Data are shown for association on chromosome (a) 1p36.1 (GRHL3) and (b) 1q32.2 (IRF6). Negative log10 P values ( y axis) are shown for variants (x axis) within a 1 Mb region centered at the reference SNP. Two-sided P values are obtained from a likelihood ratio test in regression analysis and are not corrected for multiple comparisons. The reference SNP is marked with a purple diamond, and pairwise LD (r2) between the reference SNP and other variants are indicated by color. The r2 values were estimated from high-coverage whole-genome sequences of 3775 Finns. Both directly genotyped and imputed SNPs are plotted. Genomic coordinates are shown according to the human genome build GRCh38/hg38.
Fig. 3
Fig. 3. Geographic distribution and correlation of the rs570516915 variant allele frequency with regional prevalence of non-syndromic CP in Finland.
a Distribution of the rs570516915 G allele frequency and CP prevalence in 19 administrative regions of Finland. The variation in allele frequency and CP prevalence across distinct regions are illustrated by the intensity of the blue shading. Regions are labeled by their corresponding codes from Statistics Finland and shown in Supplementary Data 8. b Correlation between the regional allele frequency of rs570516915 and prevalence of CP. Allele frequency was estimated using birthplace data of 306,678 FinnGen study participants. Regional CP prevalences were estimated using nationwide data on the first recorded addresses and CP related diagnosis codes of 5,216,731 individuals (5162 with CP). Red line represents the ordinary least squares regression line. Pearson’s r and P value (two-sided) shown at the top of the plot indicate the strength and statistical significance of correlation. See Supplementary Data 8 for raw numbers.
Fig. 4
Fig. 4. The rs570516915 variant reduces enhancer activity of MCS-9.7.
a Browser view of the human genome, GRCh37/hg19, focused on the rs570516915 variant. Top two tracks represent open chromatin peaks detected by ATAC-Seq in HIOEC and HEPM cells, respectively. Next track shows H3K27Ac marks illustrating rs570516915 as a part of enhancer element. Following color coded bars represent chromatin status revealed by ChIP-Seq to various chromatin marks from the ENCODE Project cell lines and facial explants from human embryos at Carnegie stage (CS) 13–20 where orange and yellow bars represent the active and weak enhancer element, respectively; blue, insulator; light green, weak transcribed; gray, Polycomb repressed; light gray, heterochromatin/repetitive; GM12878, B-cell derived cell line; ESC, embryonic stem cells; K562, myelogenous leukemia; HepG2, liver cancer; HUVEC, human umbilical vein endothelial cells; HMEC, human mammary epithelial cells; HSMM, human skeletal muscle myoblasts; NHEK, normal human epidermal keratinocytes; NHLF, normal human lung fibroblasts, CS13-CS20 are facial explants from human embryos. b Scattered dot plot of relative luciferase activity for non-risk and risk alleles of rs556188853 and rs570516915 in HEKn cells. Data are represented as mean values +/−  s.d. from three independent experiments. Statistical significance is determined by Student’s t test. P value (two-tailed) is indicated on the plot and NS represents non-significant (P = 0.2452). c Chromatograms illustrating the three genotypes (TT, TG and GG) of rs570516915 in iPSCs generated by CRISPR-Cas9 mediated homology-directed repair. d Scattered dot plot of relative levels of IRF6 mRNA in edited vs parental iOECs assessed by qRT-PCR. Expression levels of IRF6 are normalized against ACTB, GAPDH, HPRT, UBC and CDH1. Data are represented as mean values +/− s.d. from nine replicates of cells harboring each genotype, as indicated in the plot. Statistical significance is determined by Student’s t test (two-tailed). NS represents non-significant (P = 0.1212).
Fig. 5
Fig. 5. rs570516915 alters an IRF6 binding site and perturbs positive autoregulation of IRF6 expression via the MCS-9.7 enhancer.
a Consensus IRF6 binding motif from the JASPAR database of transcription factor DNA-binding preferences (Matrix ID: PB0036.1) and alignment of the variant site in different species, which shows that the ancestral allele A is completely conserved in mammals and is critical for binding of IRF6. Note that this A corresponds to the T allele of rs570516915 on the opposite DNA strand. Percent input identified by ChIP-qPCR for (b) anti-H3K27Ac and (c) anti-IRF6, respectively, in iOECs heterozygous for rs570516915 using primers specific to the MCS-9.7 enhancer site or, as a negative control, to a region 103.7 kb upstream IRF6 transcription start site that did not harbor active elements identified from ATAC-Seq and H3K27Ac ChIP-Seq in HIOEC or NHEK cells and devoid of predicted IRF6 binding sites. Error bars refer to three ChIP replicates and expressed as mean values +/− s.d. Statistical significance is determined by Student’s t test. P value (two-tailed) is indicated on the plot and NS represents non-significant. d Sequencing chromatograms of anti-IRF6 and anti-H3K27Ac ChIP-PCR products of cells heterozygous for rs570516915.

Update of

References

    1. Mossey, P. A., Little, J., Munger, R. G., Dixon, M. J. & Shaw, W. C. Cleft lip and palate. Lancet374, 1773–1785 (2009). - PubMed
    1. Kinsner-Ovaskainen, A. et al. A sustainable solution for the activities of the European network for surveillance of congenital anomalies: EUROCAT as part of the EU Platform on Rare Diseases Registration. Eur. J. Med. Genet.61, 513–517 (2018). - PubMed
    1. European Surveillance of Congenital Anomalies. European Platform on Rare Disease Registration. URL: https://eu-rd-platform.jrc.ec.europa.eu/eurocat/eurocat-data/prevalence_en (accessed on December 21, 2023).
    1. Rintala, A. E. Epidemiology of orofacial clefts in Finland: A review. Ann. Plast. Surg.17, 456–459 (1986). - PubMed
    1. Finnish Institute for Health and Welfare. Congenital anomalies 2014. URL: https://urn.fi/URN:NBN:fi-fe2018062626441 Statistical Report 27, (2018).

Publication types

Substances