. 2024 Nov 6;15(1):9570.
doi: 10.1038/s41467-024-53776-3.

Neuroblastoma plasticity during metastatic progression stems from the dynamics of an early sympathetic transcriptomic trajectory

Affiliations

Neuroblastoma plasticity during metastatic progression stems from the dynamics of an early sympathetic transcriptomic trajectory

Benjamin Villalard et al. Nat Commun. .

Abstract

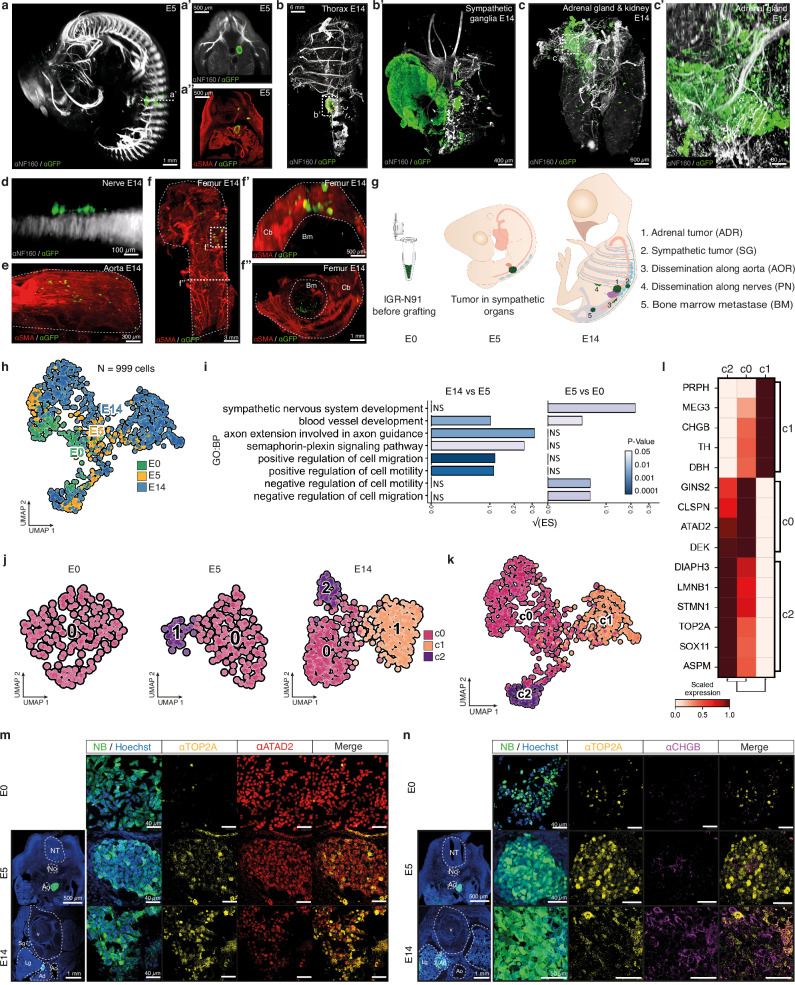
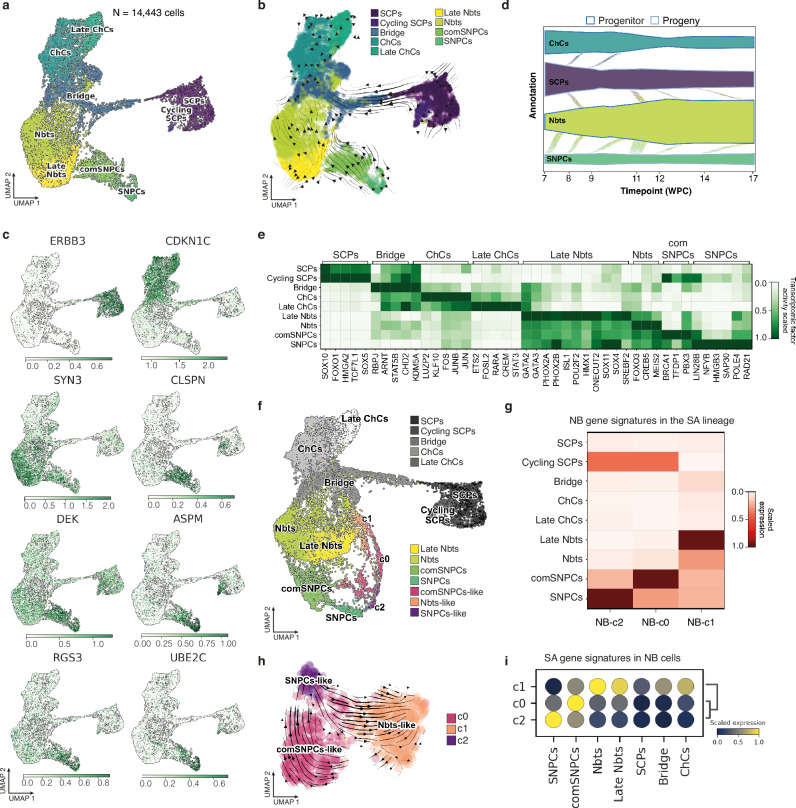
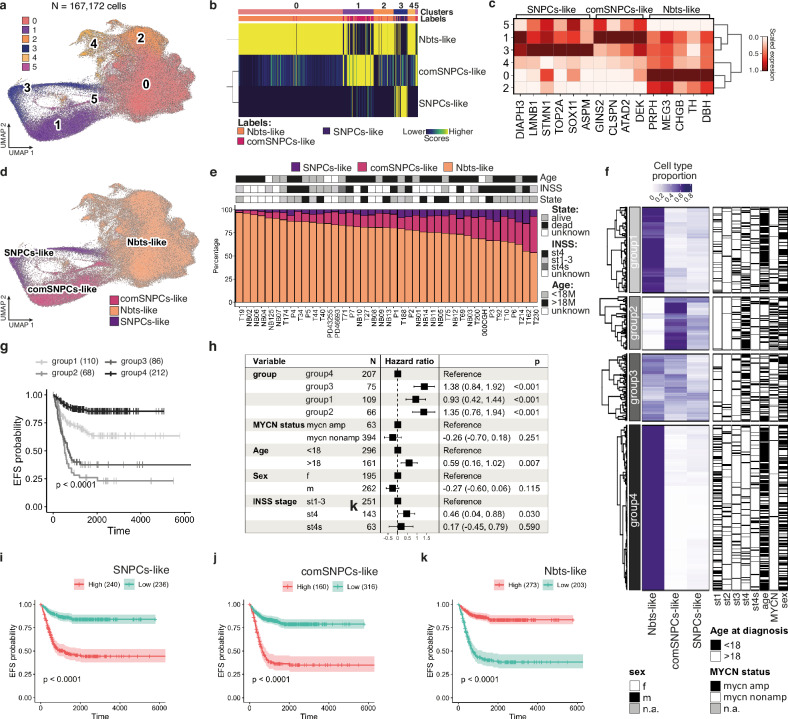
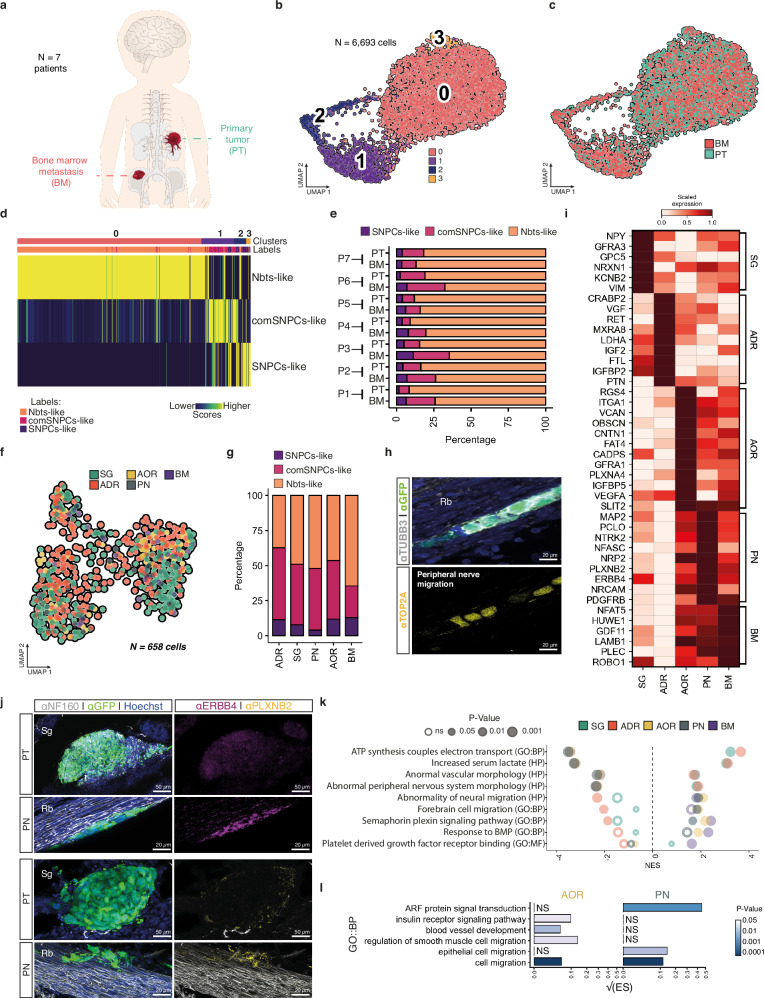
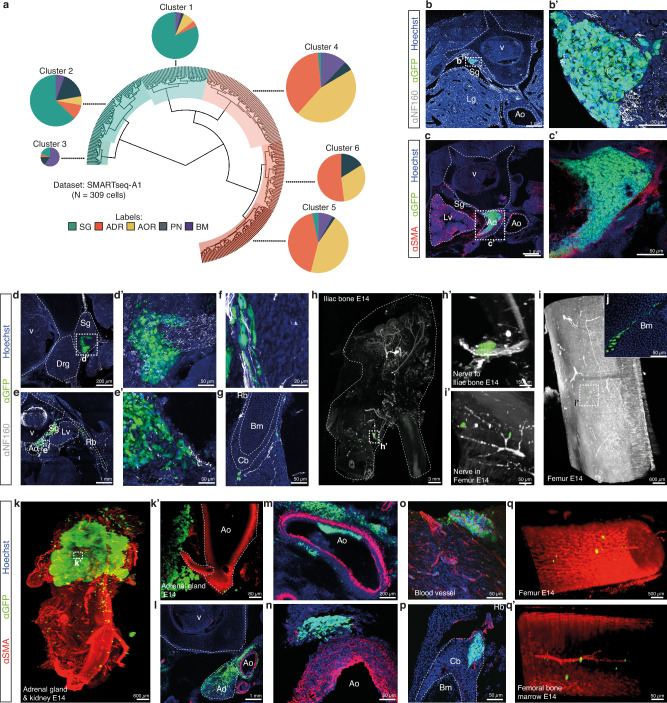
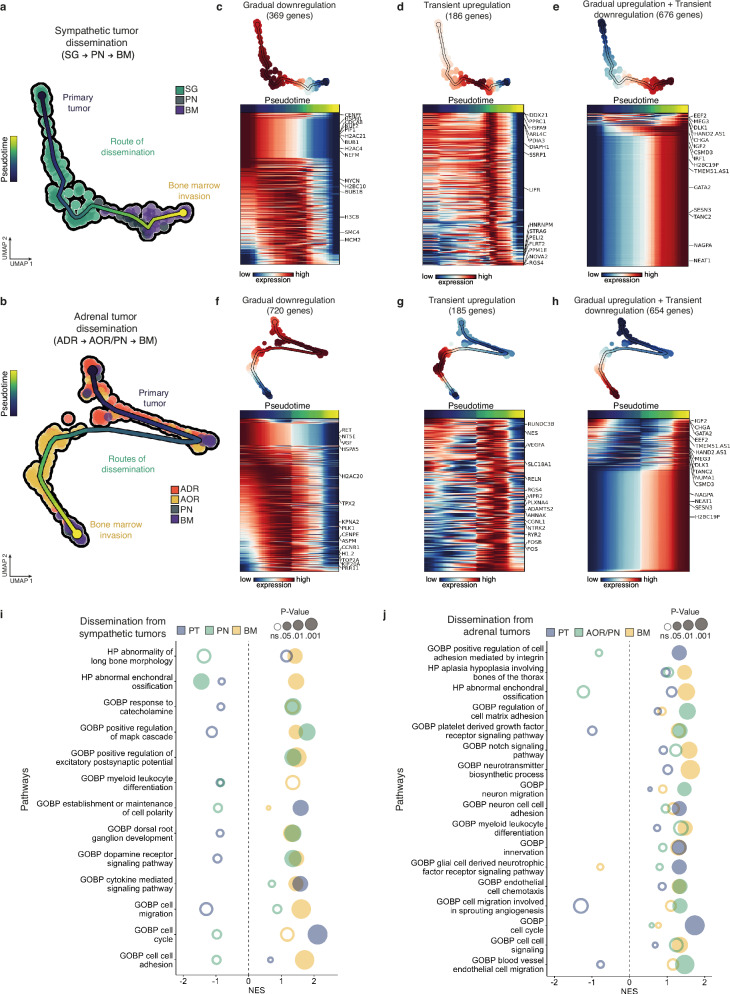
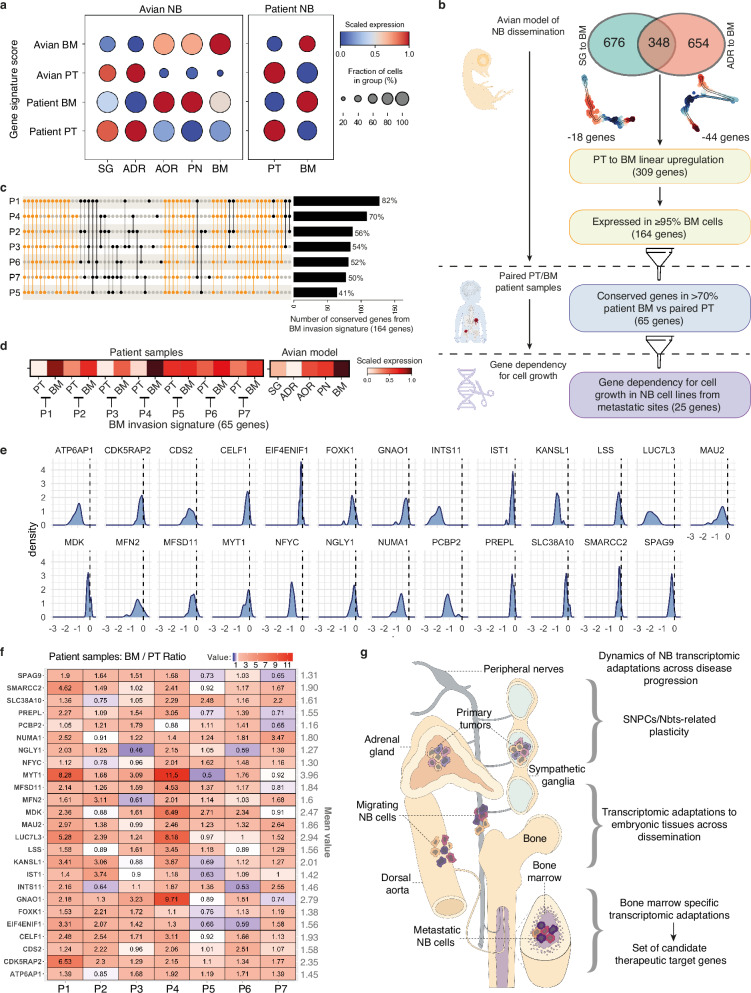
Despite their indisputable importance in neuroblastoma (NB) pathology, knowledge of the bases of NB plasticity and heterogeneity remains incomplete. They may be rooted in developmental trajectories of their lineage of origin, the sympatho-adrenal neural crest. We find that implanting human NB cells in the neural crest of the avian embryo allows recapitulating the metastatic sequence until bone marrow involvement. Using deep single cell RNA sequencing, we characterize transcriptome states of NB cells and their dynamics over time and space, and compare them to those of fetal sympatho-adrenal tissues and patient tumors and bone marrow samples. Here we report remarkable transcriptomic proximities restricted to an early sympathetic neuroblast branch that co-exist with phenotypical adaptations over disease progression and recapitulate intratumor and interpatient heterogeneity. Combining avian and patient datasets, we identify a list of genes upregulated during bone marrow involvement and associated with growth dependency, validating the relevance of our multimodal approach.


Conflict of interest statement

V.C. and C.D.B. declare the following competing interest: both are scientific advisors for the European Research Biological Center (ERBC) group. G.A. is employed by Cellenion, a BICO company. B.V., F.R., A.B., O.I., K.T., E.T., I.T., S.C., J.L., J.J.M., and G.T. declare no competing interests.

Figures

Fig. 1
Fig. 1. l NB transcriptomic plasticity across disease progression in an avian embryonic microenvironment.
af Representative lightsheet imaging of chick embryos grafted with IGR-N91::GFP cells at E2 and harvested at E5 (N = 11) (a) or E14 (N = 7) from 3 independent experiments (bf) and labelled with α-NF160, or α-SMA, and α-GFP antibodies. E: Embryonic day. Optical sections at E5 in a’ and a”. b, c illustrate E14 rib cage with sympathetic ganglia tumor (in N = 5/7 embryos, enlargement in b’) and/or adrenal tumor (in N = 7/7, optical section c’). d, e show NB cells on nerves (in N = 4/7 embryos) (d), and on the aorta (in N = 7/7 embryos) (e). f illustrates bone invasion (in N = 7/7 embryos) with optical sections highlighting cortical (f’) and marrow (f”) metastases. Scale bars are indicated. g Overview of IGR-N91::GFP cell location harvested for scRNAseq. h Integration of 998 IGR-N91::GFP cells (E0 cells in culture, and from N = 22 E5 and N = 15 E14 embryos from 5 independent experiments) in a UMAP colored by timepoint. i Bar plot showing pathway enrichment score (ES) (Gene Ontology biological processes, p-value < 0.05) based on gene differential expression in E5 vs E0 and in E14 vs E5 (two-sided Wilcoxon rank sum test; p-value < 0.05, log fold change > 0.1, min.pct > 0.1). Square root of the ES is shown. j UMAP of NB cells colored by transcriptomic state (c0, c1, c2) with Louvain clustering annotation, at the same resolution (res = 0.3) for E0 (162 cells), E5 (178 cells) and E14 (658 cells) stages. k UMAP of IGR-N91::GFP cells integrated overtime colored by transcriptomic clusters (c0, c1, c2). l Heatmap of scaled expression values of genes markers for clusters shown in k (two-sided Wilcoxon rank sum test; p-value < 0.05, log fold change > 0.25, min.pct > 0.1) grouped by phenotype. m, n Representative images of IGR-N91::GFP cells in culture and in sections of E5 (N = 10 embryos from 4 independent experiments) and E14 (N = 8 embryos from 5 independent experiments) embryos labeled with α-ATAD2 (c0), α-TOP2A (c2) and α-CHGB (c1) antibodies. Source data are provided as a source data file. Adr Adrenal gland, Ao Aorta, Bm Bone marrow, Cb Cortical bone, Lg Lung, No Notochord, NT Neural Tube, Sg Sympathetic ganglia, V Vertebrae.
Fig. 2
Fig. 2. NB cell plasticity in avian embryonic tissues relies on the adoption of features of the human SNPCs-to-neuroblasts differentiation program.
a UMAP embedding of 14,443 single cells of human physiological sympatho-adrenal cells colored by phenotypic state. The UMAP results from the integration of Jansky et al., 2021 and Kameneva et al., 2021 datasets. b UMAP embedding of human SA atlas with arrows highlighting the directions of state-to-state transitions. c Expression of key marker genes in UMAP embedding of the human SA atlas; color scales indicate log-normalized gene expression. d Probability mass flow as a function of time post-conception from either SCP or SNPC progenitor state using cellular growth and death score, combined with cell transcriptomic similarity to compute differentiation directions. e Heatmap of the scaled transcription factor activity for key genes in each physiological SA phenotypical state. Gene lists were extracted using differential expression with two-sided Wilcoxon rank sum test (p-value < 0.05, log fold change > 0.25, min.pct > 0.1). f Unimodal projection UMAP of NB cells -colored by transcriptomic states- mapped onto the human SA lineage atlas. g Heatmap of scaled expression values for NB-c0, NB-c1 and NB-c2 gene signature scores into cell populations of the SA lineage. NB-c0, NB-c1 and NB-c2 gene signatures were built from the intersection of NB gene markers grouped by phenotype (two-sided Wilcoxon rank sum test; p-value < 0.05, log fold change > 0.25, min.pct > 0.1) with anchor genes used for the unimodal projection UMAP shown in (f). h RNA velocity estimates for NB cells harvested at E14 on a UMAP embedding using dynamical modeling. i Dot plot illustrating SCPs-related or SNPCs-related differentiation dynamic gene signature scores into NB cell transcriptomic states. Cell cycle-related genes (listed in gene ontology GO:0007049 biological process) were removed from all signatures. Source data are provided as a source data file. ChCs Chromaffin Cells, Nbts Neuroblasts, SCPs Schwann Cell Precursors, SNPCs, Sympathetic Neuron Progenitor Cells, comSNPCs committed SNPCs.
Fig. 3
Fig. 3. Patient intra-tumor heterogeneity reflects SA lineage-related transcriptome plasticity.
a UMAP plot of 167,172 NB cells from patient samples colored by unsupervised clustering. Only NB cells were kept for the analysis. b Comparison of transcriptomic states in NB patient single cell data with annotated clusters of NB cells exposed to embryonic microenvironments in the avian model. Similarity score was computed based on Spearman correlation across reference markers. c Heatmap of the scaled expression values for marker genes of human SNPCs/Nbt-like clusters of NB cells exposed to the embryonic microenvironment in NB patient sample transcriptomic clusters. d UMAP plot of NB cells from patient samples colored and labeled by SA lineage-related transcriptome states. e Bar plot of fractions of NB cells assigned to SA-related transcriptomic states per patient sample with associated clinical information. f Heatmap with hierarchical clustering of 649 RNA-seq patient samples from Kocak’s cohort with associated clinical information based on deconvolution, using patient NB scRNA-seq atlas as a reference to assess proportion of NB transcriptomic states. g Kaplan–Meier analysis of EFS in NB patients according to SA lineage-related hierarchical clustering (group1 to 4). Log-rank test with Bonferroni adjustment was performed to compare survival curves. h Forest plot of hazard ratio depending on SA lineage-related NB profiles (group 1 to 4) from Cox regression EFS analyses in multivariable analyses adjusted for age, sex, MYCN status and INSS classification. Error bars represent the 95% confidence interval of the likelihood test performed on the calculated hazard ratio (two-sided test). ik Kaplan–Meier analysis of EFS in NB patients according to the relative proportion of SNPCs-like (i), comSNPCs-like (j) or Nbts-like states (k). Log-rank test was performed. Error bands show the 95% confidence interval. Source data are provided as a source data file.
Fig. 4
Fig. 4. SA-lineage-related NB states are maintained across the metastatic dissemination.
a Illustration of patient samples from paired primary tumor (PT) and bone marrow (BM). b, c UMAP of 6,693 NB cells sub-sampled from 7 integrated paired PT/BM colored by transcriptomic clusters (b) and by tissue location (c). d Transcriptomic comparison of PT/BM clusters (in b) with NB SA-related clusters exposed to avian embryonic microenvironments. Similarity scores were computed with Spearman correlation across reference markers. e Bar plot of fractions of NB cells assigned to SA-related states per patient and per sample type. f UMAP of IGR-N91::GFP cells colored by cell location in E14 embryos -257 cells from SG tumors, 261 cells from ADR tumors, respectively 25 and 84 cells on PN and AOR, and 31 cells in the BM. g Bar plot with fractions of cells shown in (f) and assigned to SA-related states for each NB cell location. h Representative image of IGR-N91::GFP cells on PN showing heterogeneous expression of the c2 marker TOP2A in E14 embryos (observed in N = 3/3 embryos from 2 independent experiments). Sections were labeled with α-GFP, α-TUBB3, and α-TOP2A antibodies. i Heatmap of scaled expression values of marker genes extracted from genes differentially expressed between locations (two-sided Wilcoxon rank sum test; p-value < 0.05, log fold change > 0.1 min.pct > 0.1). j Representative images of IGR-N91::GFP cells in E14 embryos, in primary tumors or in contact with PN labeled with α-GFP, α-NF160 and α-PLXNB2 or α-ERBB4 antibodies. k, Gene set enrichment analysis from differentially expressed genes for each location. Pathways were extracted from ontology gene sets of molecular signature database (nperm = 1000, ranked by log fold change, abs(NES) > 1.3, Fischer’s exact test). l Bar plot showing pathway enrichment score (ES) (GO biological processes, p-value < 0.05) in NB cells migrating on PN or AOR based on differential gene expression (two-sided Wilcoxon rank sum test; p-value < 0.05, log fold change > 0.1, min.pct > 0.1). Square root of the ES is shown. Scale bars are indicated. Source data are provided as a source data file. Rb Rib, Sg Sympathetic ganglia.
Fig. 5
Fig. 5. Genetic tracing of NB cells across the dissemination process allows mapping their physical trajectories in avian tissues.
a Parsimony tree showing the genetic relationships between NB cells located in adrenal tumors (orange arm) or sympathetic tumors (blue arm) and subclones located in the dissemination paths (AOR, PN) and in the bone marrow (BM). Genetic information was extracted from SMART-Seq2 single cell data obtained from E14 avian embryos grafted at E2 with IGR-N91::GFP cells (SMARTseq-A1 dataset, N = 9 embryos). Genetic proximity between cells was computed using single nucleotide polymorphisms and indel alterations of transcriptomic regions to build a cell-to-cell genetic divergence matrix based on variant allele frequency. bq Representative images of the physical paths taken by IGR-N91::GFP cells in E14 embryos (8 embryos from 5 independent experiments analyzed). Tissue sections or whole embryos were labeled with α-GFP and α-NF160 or α-SMA antibodies. E: Embryonic day. b, c show IGR-N91 primary tumors located in the SG (observed in N = 6/8 embryos) (b, enlargement in b’) and in the ADR (observed in N = 6/8 embryos) (c, enlargement in c’). d, e show NB cells transiting to the PN (observed in N = 8/8 embryos) from a sympathetic tumor (d, enlargement in d’) and from an adrenal tumor (e, enlargement in e’). fi show NB cell migration along nerves at distance from primary tumor sites (f) and reaching innervated bones (gi) and the BM (observed in N = 4/8 embryos) (j). kn show adrenal tumors transiting via the AOR (observed in N = 6/8 embryos). k (enlarged optical section in k’) illustrates the proximity of adrenal tumors with the AOR and l-n are transverse sections of the adrenal/aorta region. oq show NB cells migration along blood vessels (o) at distance from adrenal tumors and reaching the bones (p) and the BM (q, optical section in q’). bj, lp are sections of embryos imaged with confocal microscopy. hk, q were imaged with lightsheet microscopy. Scale bars are indicated. Source data are provided as a source data file. Adr Adrenal gland, Ao Aorta, Bm Bone marrow, Drg Dorsal root ganglia, Lg Lung, Lv Liver, Sg Sympathetic ganglia, V Vertebrae.
Fig. 6
Fig. 6. Dynamic transcriptomic adaptations of NB cells across their dissemination in avian embryonic tissues.
a, b UMAP plots based on the integration of both variant allele frequency and transcriptomic single cell data to map the trajectory of NB cells disseminating from a sympathetic ganglia (a,122 cells) or an adrenal (b, 200 cells) primary tumor site to the bone marrow (BM) via the peripheral nerves (PN) and/or the aorta (AOR). Each trajectory was determined using parsimony tree extracted from cell-to-cell genetic divergence clustering. ch Sets of genes -and corresponding heatmaps- which expression significantly changes along linear pseudotime of NB cell trajectories using Moran’s I test. Genes following the same type of dynamics (gradual downregulation, transient upregulation, gradual upregulation and transient downregulation) were grouped in independent heatmaps. i, j Gene set enrichment analysis (GSEA) from genes listed to be dynamically regulated in NB cell trajectories from the primary tumor sites to the bone marrow. Pathways were generated with ontology gene sets of molecular signature database (nperm = 1000, ranked by dispersions, abs(NES) > 1.3). Fischer’s exact test was performed. Source data are provided as a source data file.
Fig. 7
Fig. 7. NB metastasis to the BM is featured by a functional and dynamic gene set having potential clinical interest.
a Dot plot showing the level of expression of NB gene signatures built from the avian model (avian-PT, avian-BM) and from patient data (patient-PT and patient-BM) in NB cells located in primary tumors or in the bone marrow in each context (avian model and patients) (two-sided Wilcoxon rank sum test; p-value < 0.05, log fold change > 0.1, min.pct > 0.1). b Decision tree to extract a list of candidate genes functionally involved in BM invasion by NB cells. c Upset plot of the 164 genes enriched during BM invasion in the embryonic model of NB dissemination (and expressed in patient samples) in the 7 patient BM compared to paired PT. Yellow bars indicate pools of genes which expression profile is shared by at least 5 out of the 7 patients. Bar plot of the fraction of genes from signature conserved in each patient is shown on the right. d Heatmap of the expression of BM invasion signature refined from patient samples data (65 genes) in paired PT/BM patient samples and in NB cells at each step of dissemination. e Distribution of effect scores of the 65 BM-genes calculated using Chronos algorithms on CRISPR/Cas9 data from DepMap portal on 18 NB cell lines obtained from metastatic sites. Graphs are shown for the 25 genes associated with significant NB dependency for cell growth as detailed in the methods section. Data are normalized using annotated sets of common-essential and non-essential genes. No effect on cell growth has a score of 0, and a negative score is indicative of gene dependency for cell growth. f Heatmap of gene expression ratios (BM over PT) of the 25 genes extracted in (e). Values of BM/PT ratio for each gene and for each patient are indicated on the heatmap. g Scheme summarizing the types of dynamic transcriptomic adaptations occurring in NB cells across disease progression in an entire growing organism. Source data are provided as a source data file.

References

    1. Filbin, M. & Monje, M. Developmental origins and emerging therapeutic opportunities for childhood cancer. Nat. Med.25, 367–376 (2019). - PMC - PubMed
    1. Kattner, P. et al. Compare and contrast: pediatric cancer versus adult malignancies. Cancer Metastasis Rev.38, 673–682 (2019). - PubMed
    1. Jiang, M., Stanke, J. & Lahti, J. M. The connections between neural crest development and neuroblastoma. Curr. Top. Dev. Biol.94, 77–127 (2011). - PMC - PubMed
    1. Maris, J. M. Recent advances in neuroblastoma. N. Engl. J. Med.362, 2202–2211 (2010). - PMC - PubMed
    1. Körber, V. et al. Neuroblastoma arises in early fetal development and its evolutionary duration predicts outcome. Nat. Genet.55, 619–630 (2023). - PMC - PubMed

Publication types

Associated data