. 2024 Nov 5;15(11):794.
doi: 10.1038/s41419-024-07109-3.

Hypermethylation of CDKN2A CpG island drives resistance to PRC2 inhibitors in SWI/SNF loss-of-function tumors

Affiliations

Hypermethylation of CDKN2A CpG island drives resistance to PRC2 inhibitors in SWI/SNF loss-of-function tumors

Xinghao Wang et al. Cell Death Dis. .

Abstract

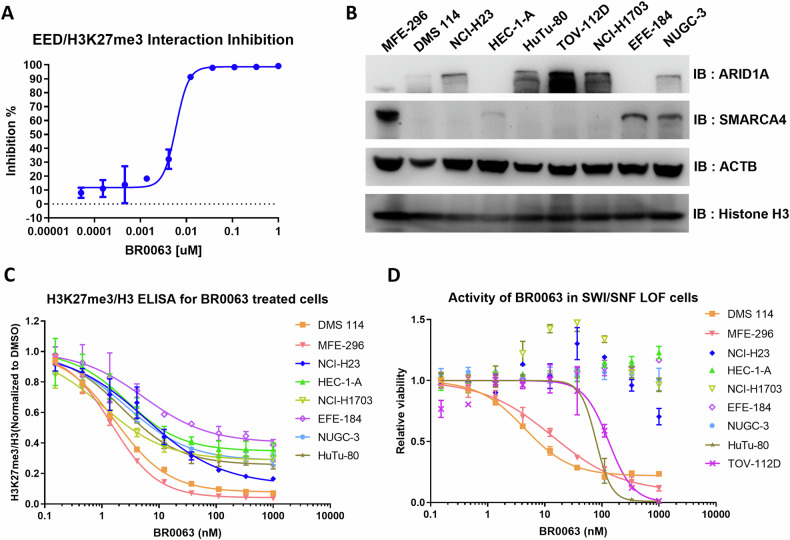
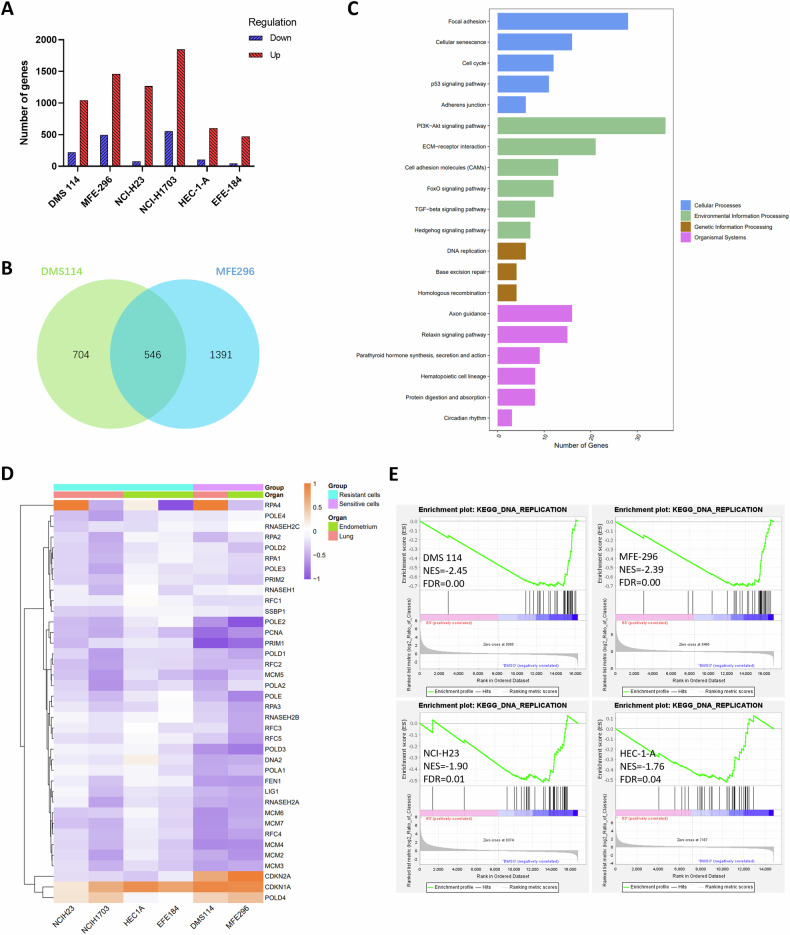
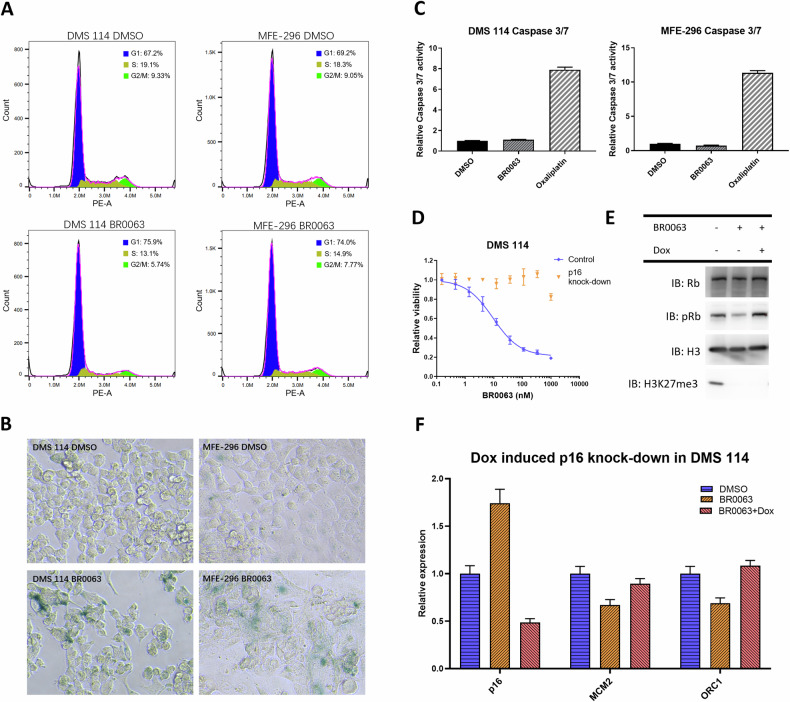
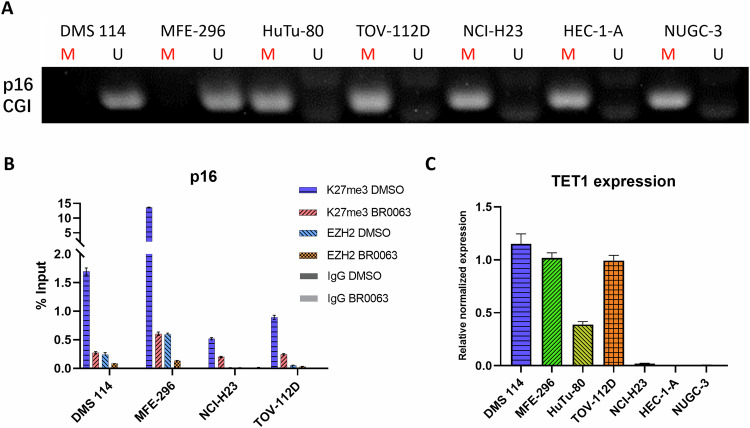
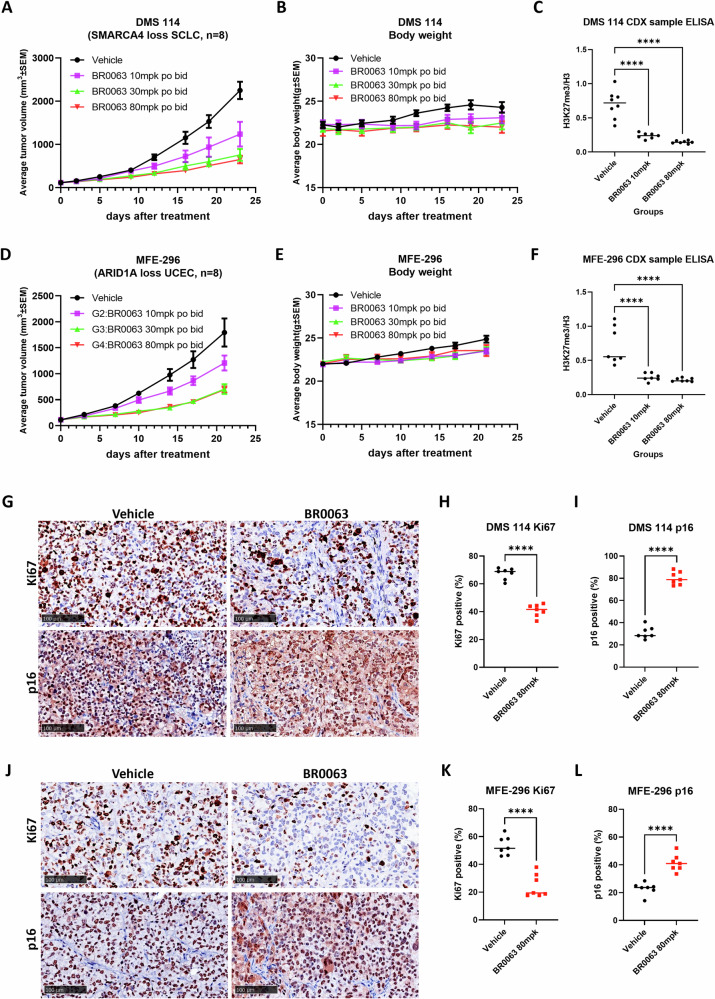
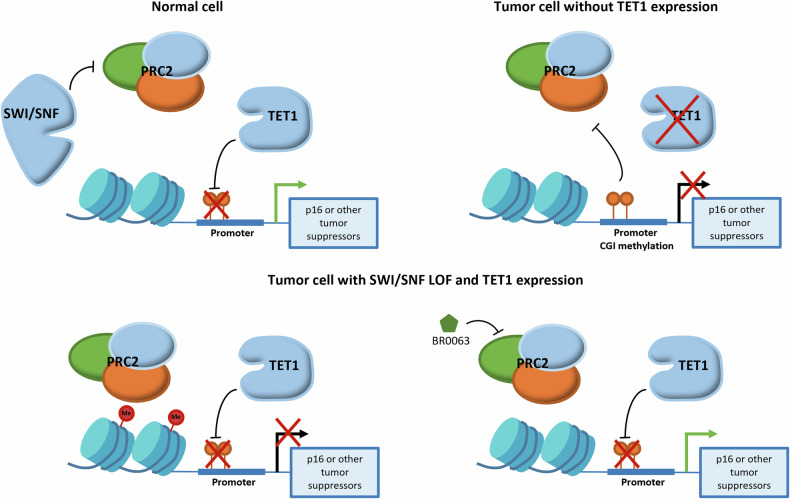
Polycomb repressive complex 2 (PRC2) catalyzes the writing of the tri-methylated histone H3 at Lys27 (H3K27me3) epigenetic marker and suppresses the expression of genes, including tumor suppressors. The function of the complex can be partially antagonized by the SWI/SNF chromatin-remodeling complex. Previous studies have suggested that PRC2 is important for the proliferation of tumors with SWI/SNF loss-of-function mutations. In the present study, we have developed an EED-directed allosteric inhibitor of PRC2 termed BR0063, which exhibits anti-proliferative properties in a subset of solid tumor cell lines harboring mutations of the SWI/SNF subunits, SMARCA4 or ARID1A. Tumor cells sensitive to BR0063 exhibited several distinct phenotypes, including cell senescence, which was mediated by the up-regulation of CDKN2A/p16. Further experiments revealed that the expression of p16 was suppressed in the BR0063-resistant cells via DNA hypermethylation in the CpG island (CGI) promoter region, rather than via PRC2 occupancy. The expression of TET1, which is required for DNA demethylation, was found to be inversely correlated with p16 CGI methylation, and this may serve as a biomarker for the prediction of resistance to PRC2 inhibitors in SWI/SNF LOF tumors.


Conflict of interest statement

The authors declare no competing interests.

Figures

Fig. 1
Fig. 1. BR0063 demonstrates good in vitro activity, and efficiently inhibits PRC2 in SWI/SNF LOF mutation cell lines.
A AlphaScreen assay detection of the inhibitory effect of BR0063 on the interaction of EED with the H3K27me3 peptide. Each experimental condition was performed in duplicate, and error bars are presented as the mean ± SD. B Western blotting (WB) detection of the SWI/SNF subunits ARID1A and SMARCA4 in selected SWI/SNF mutated cell lines. C ELISA detection of H3K27me3 and Histone H3 in cells incubated with serial dilution of BR0063 for 3 days, normalized with DMSO control. Each experiment was performed in duplicate, and error bars are shown as the mean ± SD. D CellTiter-Glo® detection of cell viability of cells incubated with serial dilution of BR0063 for 14 days, normalized with DMSO control. The calculated EC50 values for DMS 114, MFE-296, HuTu-80, and TOV-112D cells are 4.4, 13.7, 79.3, and 132 nM, respectively. Each experiment was performed in triplicate, and the error bars represented the mean ± SD.
Fig. 2
Fig. 2. Summary of RNA-Seq data for DMSO and BR0063-treated SWI/SNF LOF tumor cells.
A The number of genes significantly down- or up-regulated (fold change >1.5 and FDR < 0.05) in BR0063-treated SWI/SNF LOF cell lines compared with the DMSO group for 6 days of treatment are shown. B A Venn diagram showing the 564 commonly up- or down-regulated genes identified upon incubation of the sensitive cell lines DMS 114 and MFE-296 with BR0063. C KEGG analysis of the 564 commonly up-and down-regulated genes in the DMS 114 and MFE-296 cells demonstrates that cellular senescence, cell cycle, and DNA replication pathways are commonly regulated via PRC2/EED inhibition. D Heatmap analysis for Log2 fold changes (BR0063-treated vs. DMSO-treated) of differentially expressed genes in the KEGG DNA replication pathway and of selected genes in the KEGG cell cycle pathway, with purple implying decreased expression while orange implies increased expression. E GSEA analysis of Log2 fold changes (BR0063-treated vs. DMSO-treated) of differentially expressed genes in the KEGG DNA replication pathway in DMS 114, MFE-296, HuTu-80, and TOV-112D cells. NES means normalized enrichment score.
Fig. 3
Fig. 3. BR0063 inhibits proliferation in DMS 114 and MFE-296 cells by p16-induced cell senescence.
A Flow cytometry analysis for cell cycle distribution of control and BR0063-treated DMS 114 and MFE-296 cells by PI staining. The result of one representative assay from two similar independent experiments is shown, with x- and y axes denote PI signal and cell number count, respectively. Only intact and single cells are included in the analysis. Cell population fitted in G1 phase are marked as blue, S phase as yellow, G2/M phase as green. The distribution of the sum of the fitted cell population shown as magenta overlaps with the original distribution shown as black. B β-galactosidase staining of DMSO- or BR0063-treated DMS 114 and MFE-296 cells (at ×200 magnification). C Caspase-3/7 assay detection of apoptosis in control and BR0063-treated DMS 114 and MFE-296 cells, with the addition of positive control, oxaliplatin, which is known to induce cellular apoptosis. Each experiment was performed in triplicate, and error bars are shown as the mean ± SD. D CellTiter-Glo® detection of cell viability of DMS 114 (with or without Dox-induced p16 knockdown) incubated with serial dilution of BR0063 for 14 days, normalized with DMSO control. Each experiment was performed in triplicate, and error bars are shown as the mean ± SD. E, F WB and qPCR analyses of DMS 114 cells treated with control or BR0063, with or without Dox-induced p16 knockdown. For the qPCR analyses, each sample was run in triplicate, and error bars represent the mean ± SD.
Fig. 4
Fig. 4. DNA methylation on the p16 CGI promoter is reversely correlated with PRC2 occupancy.
A Methylation-specific PCR analysis on the p16 CGI promoter region. M means PCR product for methylated CGI region, U means PCR product for unmethylated CGI region. B ChIP-qPCR analysis on the occupancy of H3K27me3 and EZH2 at the p16 CGI region of DMS 114, MFE-296, NCI-H23, and TOV-112D cells with or without BR0063 incubation. C The expression level of TET1 in the tested SWI/SNF LOF tumor cells analyzed by qPCR, each sample was run in triplicate, and the error bars represent the mean ± SD.
Fig. 5
Fig. 5. BR0063 demonstrated good in vivo efficacy against cell-derived xenograft model of SWI/SNF LOF mutation solid tumors.
A, D Tumor growth curves of the vehicle and BR0063-treated DMS 114 (A) and MFE-296 (D) xenograft models. The tumor volume was measured twice a week, calculated by the formula: 0.5×(length × width2). BR0063 reduces tumor growth in both models in a dose-dependent manner. B, E Recorded animal body weights in DMS 114 (B) and MFE-296 (E) xenograft models. No significant body weight loss was observed at the highest administered dose (80 mpk bid). C, F ELISA detection on the H3K27me3 marker in the tumor samples from vehicle (n = 8) and BR0063 10/80 mpk po bid (n = 7, one sample excluded due to limited space of ELISA plate) group of DMS 114 (C) and MFE-296 (F) xenograft models. The tumor inhibition efficacy was found to correlate with the BR0063-induced depletion of the H3K27me3 marker in tumor samples. GL Representative image of IHC staining for the proliferation marker Ki67 (shown as brown chromogen staining of nuclear), and the senescence marker p16 (shown as brown chromogen staining of both nuclear and cytoplasm), in tumor samples of the DMS 114 (G) and MFE-296 (J) xenograft models. The scale bar represents 100 μm. The relative positive area was calculated, and subsequent statistical analysis was shown in (HI) for DMS 114, and (K, L) for MFE-296. Statistical significance is shown in the figure as follows: *p < 0.05; **p < 0.01; ***p < 0.001; or ****p < 0.0001. Data are presented as scatterplots, with the bars indicating the median value.
Fig. 6
Fig. 6. Proposed mechanism of correlation between TET1 expression, CGI methylation, and PRC2 regulation on tumor suppressors, including p16.
In normal cells, the function of PRC2 is regulated by the SWI/SNF complex, whereas in tumor cells featuring SWI/SNF LOF mutations in addition to TET1 expression, the recruitment of PRC2 on the p16 promoter is allowed to occur, and suppression of its expression by the H3K27me3 marker is mediated.

Similar articles

References

    1. Deevy O, Bracken AP. PRC2 functions in development and congenital disorders. Development. 2019;146:dev181354. - PMC - PubMed
    1. Shi Y, Wang XX, Zhuang YW, Jiang Y, Melcher K, Xu HE. Structure of the PRC2 complex and application to drug discovery. Acta Pharm Sin. 2017;38:963–76. - PMC - PubMed
    1. Margueron R, Justin N, Ohno K, Sharpe ML, Son J, Drury WJ, et al. Role of the polycomb protein EED in the propagation of repressive histone marks. Nature. 2009;461:762–7. - PMC - PubMed
    1. Laugesen A, Hojfeldt JW, Helin K. Molecular mechanisms directing PRC2 recruitment and H3K27 methylation. Mol Cell. 2019;74:8–18. - PMC - PubMed
    1. Kim KH, Roberts CW. Targeting EZH2 in cancer. Nat Med. 2016;22:128–34. - PMC - PubMed

MeSH terms

LinkOut - more resources