. 2024 Nov 5;10(1):213.
doi: 10.1038/s41531-024-00824-w.

Systemic inflammation accelerates neurodegeneration in a rat model of Parkinson's disease overexpressing human alpha synuclein

Affiliations

Systemic inflammation accelerates neurodegeneration in a rat model of Parkinson's disease overexpressing human alpha synuclein

Mariangela Massaro Cenere et al. NPJ Parkinsons Dis. .

Abstract

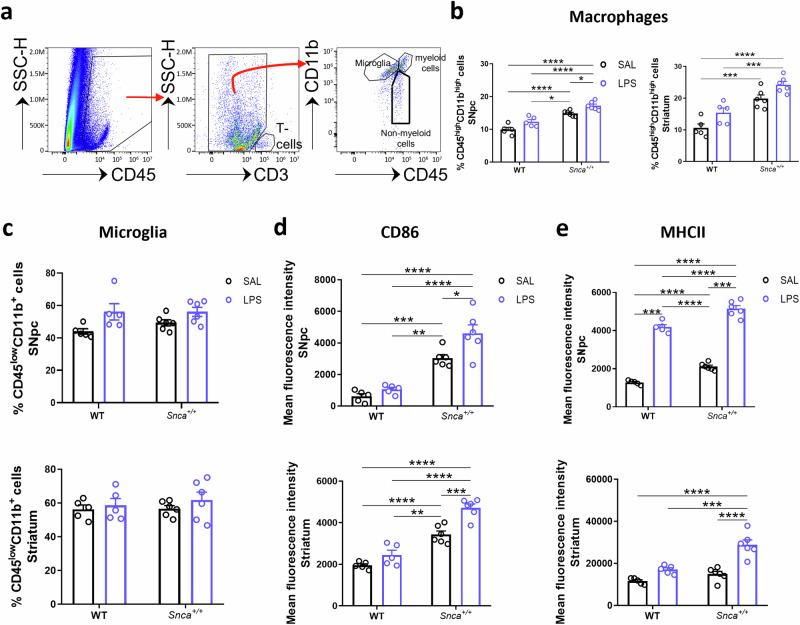
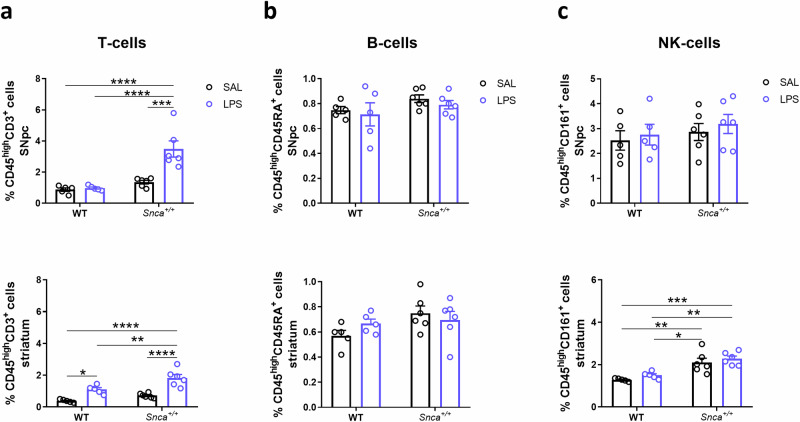
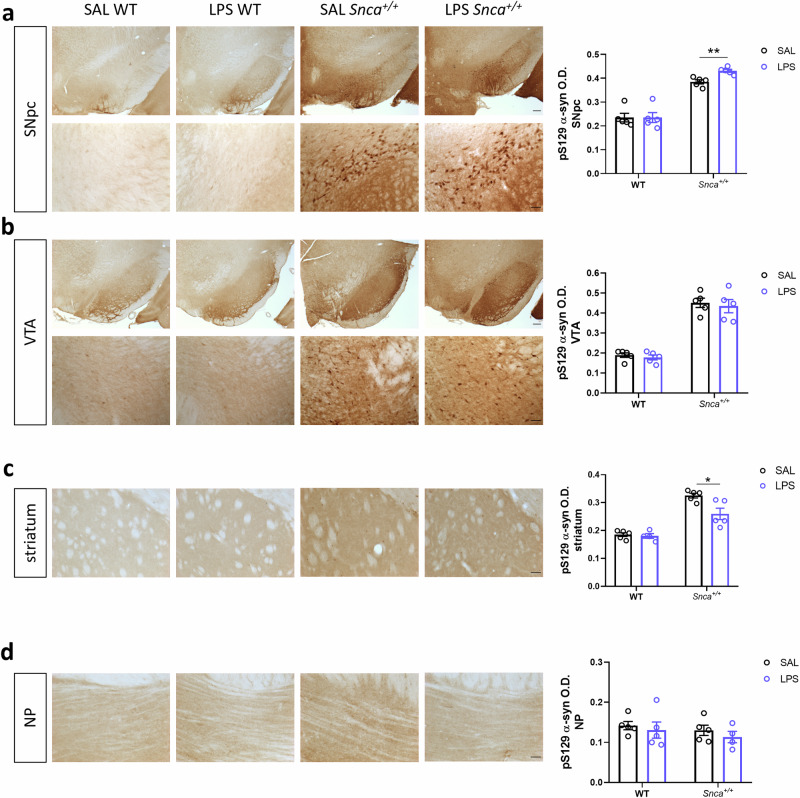
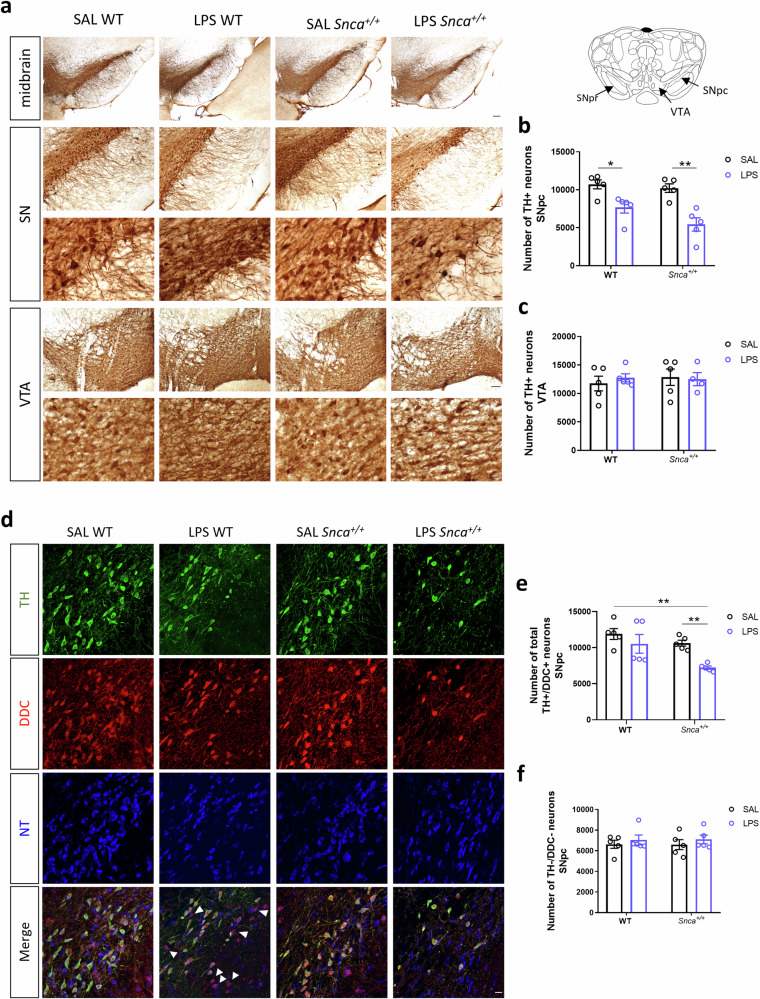
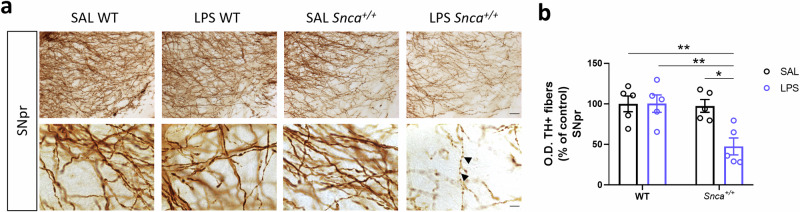
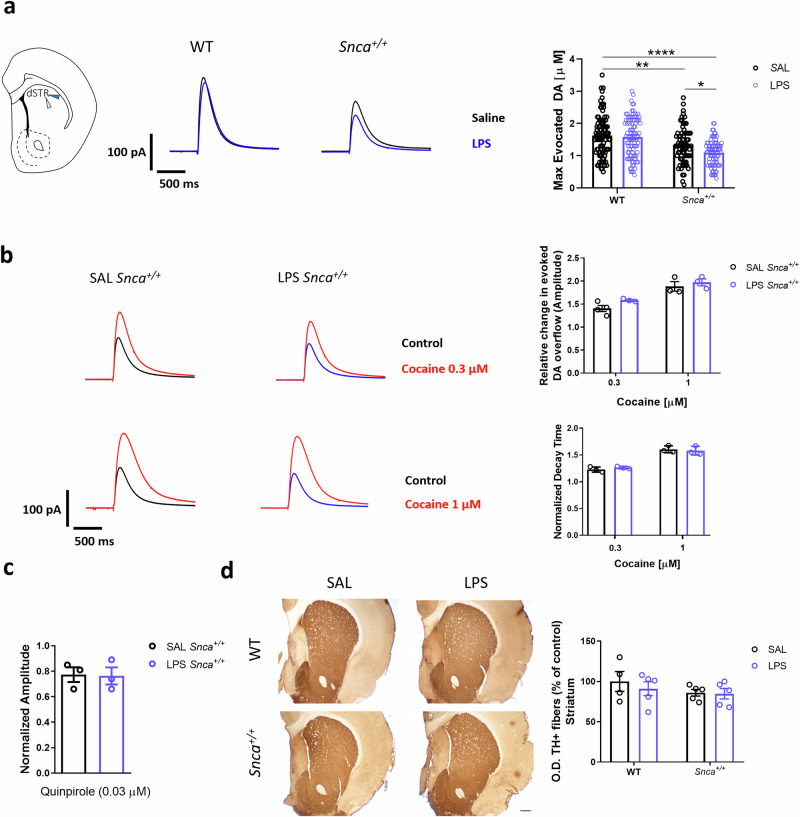
Increasing efforts have been made to elucidate how genetic and environmental factors interact in Parkinson's disease (PD). In the present study, we assessed the development of symptoms on a genetic PD rat model that overexpresses human α-synuclein (Snca+/+) at a presymptomatic age, exposed to a pro-inflammatory insult by intraperitoneal injection of lipopolysaccharide (LPS), using immunohistology, high-dimensional flow cytometry, constant potential amperometry, and behavioral analyses. A single injection of LPS into WT and Snca+/+ rats triggered long-lasting increase in the activation of pro-inflammatory microglial markers, monocytes, and T lymphocytes. However, only LPS Snca+/+ rats showed dopaminergic neuronal loss in the substantia nigra pars compacta (SNpc), associated with a reduction in the release of evoked dopamine in the striatum. No significant changes were observed in the behavioral domain. We propose our double-hit animal as a reliable model to investigate the mechanisms whereby α-synuclein and inflammation interact to promote neurodegeneration in PD.


Conflict of interest statement

The authors declare no competing interests.

Figures

Fig. 1
Fig. 1. Monocyte and microglial activation in CNS 3 months after LPS administration.
a Representative flow cytometry dot plots of isolated cells illustrating the gating strategy to determine profiles based on CD45lowCD11b+ for microglia, CD45highCD11bhigh macrophages for the central nervous system (CNS)-associated phagocytes, and CD45highCD11b− cells. b Percentage of CD45highCD11bhigh cells in the SNpc (left) and in the striatum (right). Error bars represent ±SEM. (n = 5 SAL WT, n = 5 LPS WT, n = 6 SAL Snca+/+, n = 6 LPS Snca+/+; Ordinary two-way ANOVA for Genotype vs Treatment; SNpc: Interaction, F (1, 18) = 0.003483; Genotype, F (1, 18) = 79.06, p < 0.001; Treatment, F (1, 18) = 18.48, p = 0.0004; *p < 0.05, ****p < 0.0001, with Bonferroni’s post hoc multiple comparisons test; striatum: Interaction, F (1, 18) = 0.02436; Genotype, F (1, 18) = 52.37, p < 0.0001; Treatment, F (1, 18) = 13.76, p = 0.0016; ***p < 0.001, ****p < 0.0001, with Bonferroni’s post hoc multiple comparisons test). c Percentage of CD45lowCD11b+ microglia in the SNpc (top) and in the striatum (bottom). Error bars represent ±SEM. (n = 5 SAL WT, n = 5 LPS WT, n = 6 SAL Snca+/+, n = 6 LPS Snca+/+; Ordinary two-way ANOVA for Genotype vs Treatment; SNpc: Interaction, F (1, 18) = 0.7841; Genotype, F (1, 18) = 0.7550; Treatment, F (1, 18) = 9.796, p = 0.0058; striatum: Interaction, F (1, 18) = 0.1473). d Mean fluorescence of CD86 both in the SNpc (top) and striatum (bottom). (n = 5 SAL WT, n = 5 LPS WT, n = 6 SAL Snca+/+, n = 6 LPS Snca+/+; Ordinary two-way ANOVA for Genotype vs Treatment; SNpc: Interaction, F (1, 18) = 2.858; Genotype, F (1, 18) = 79.88, p < 0.0001; Treatment, F (1, 18) = 9.063, p = 0.0075; *p < 0.05, **p < 0.01, ***p < 0.001, ****p < 0.0001, with Bonferroni’s post hoc multiple comparisons test; striatum: Interaction, F (1, 18) = 4.848, p = 0.0410; Genotype, F (1, 18) = 111.9, p < 0.0001; Treatment, F (1, 18) = 25.47, p < 0.0001; **p < 0.01, ***p < 0.001, ****p < 0.0001, with Bonferroni’s post hoc multiple comparisons test). e Mean fluorescence of MHC-II both in the SNpc (top) and striatum (bottom). (n = 5 SAL WT, n = 5 LPS WT, n = 6 SAL Snca+/+, n = 6 LPS Snca+/+; Ordinary two-way ANOVA for Genotype vs Treatment; SNpc: Interaction, F (1, 18) = 0.2921; Genotype, F (1, 18) = 56.27, p < 0.0001; Treatment, F (1, 18) = 623.2, p < 0.0001; ***p < 0.001, ****p < 0.0001, with Bonferroni’s post hoc multiple comparisons test; striatum: Interaction, F (1, 18) = 7.674, p = 0.0126; Genotype, F (1, 18) = 24.36, p = 0.0001; Treatment, F (1, 18) = 40.04, p < 0.0001; ***p < 0.001, ****p < 0.0001, with Bonferroni’s post hoc multiple comparisons test).
Fig. 2
Fig. 2. Peripheral immune cells into the SN and the striatum 3 months after LPS administration.
a Bar plots of the percentage of CD45highCD3+ T cells in the SNpc (top) and the striatum (bottom). (n = 5 SAL WT, n = 5 LPS WT, n = 6 SAL Snca+/+, n = 6 LPS Snca+/+; Ordinary two-way ANOVA for Genotype vs Treatment; SNpc: Interaction, F (1, 18) = 11.58, p = 0.0032; Genotype, F (1, 18) = 25.14, p < 0.0001; Treatment, F (1, 18) = 14.07, p = 0.0015; ***p < 0.001, ****p < 0.0001, with Bonferroni’s post hoc multiple comparisons test; striatum: Interaction, F (1, 18) = 2.041; Genotype, F (1, 18) = 15.05, p = 0.0011; Treatment, F (1, 18) = 44.63, p < 0.0001; *p < 0.05, **p < 0.01, ****p < 0.0001, with Bonferroni’s post hoc multiple comparisons test). b Bar plots of the percentage of CD45highCD45RA+ B cells in the SNpc (top) and the striatum (bottom). (n = 5 SAL WT, n = 5 LPS WT, n=6 SAL Snca+/+, n = 6 LPS Snca+/+; Ordinary two-way ANOVA for Genotype vs Treatment; SNpc: Interaction, F (1, 18) = 0.02012; striatum: Interaction, F (1, 18) = 1.916). c Bar plots of the percentage of CD45highCD161+NK cells in the SNpc (top), while, in the striatum (bottom), a significant genotype effect in Snca+/+ compared to WT groups is shown, independent from treatment. (n = 5 SAL WT, n = 5 LPS WT, n = 6 SAL Snca+/+, n = 6 LPS Snca+/+; Ordinary wo-way ANOVA for Genotype vs. Treatment; SNpc: Interaction F (1, 18) = 0.01421; striatum: Interaction, F (1, 18) = 0.01596; Genotype, F (1, 18) = 33.17, p < 0.0001; Treatment, F (1, 18) = 2.033; *p < 0.05, **p < 0.01, ***p < 0.001, with Bonferroni’s post hoc multiple comparisons test).
Fig. 3
Fig. 3. LPS accelerates alpha synuclein accumulation in the SN of Snca+/+ rats.
a Left, representative immunostaining of pSyn (S129) in the SNpc (top, scale: 200 µm) and related micrograph (bottom, scale: 50 μm). Right, densitometric quantification of pSyn (S129) in SNpc. Each point represents mean O.D. values per animal ±S.E.M. (n = 5 rats/group; Kruskal-Wallis test: p = 0.0011 (approximate), **p = 0.0079, with Mann Whitney test). b Left, representative immunostaining of pSyn (S129) in the VTA (top, scale: 200 µm) and micrograph (bottom, scale: 50μm). Right, densitometric quantification of pSyn (S129) in VTA. Each point represents mean O.D. values per animal ±S.E.M. (n = 5 rats/group; Ordinary Two-way ANOVA for Genotype vs Treatment: Interaction, F (1, 16) = 0.01289; Genotype, F (1, 16) = 138.5, ****p < 0.0001; Treatment, F (1, 16) = 0.3907). c Left, representative immunostaining of pSyn (S129) in the striatum (scale: 50μm) and densitometric quantification, right. Each point represents mean O.D. values per animal ±S.E.M. (n = 5 rats/group; Ordinary Two-way ANOVA for Genotype vs. Treatment: Interaction, F (1, 15) = 5.632, p = 0.0314; Genotype, F (1, 15) = 73.16, p < 0.0001; Treatment, F (1, 15) = 7.504, p = 0.0152; *p = 0.122, with Bonferroni’s post hoc multiple comparisons test). d Left, representative immunostaining of pSyn (S129) in the NP (scale: 50 μm) and densitometric quantification, right. Each point represents mean O.D. values per animal ±S.E.M. (n = 5 rats/group; Ordinary Two-way ANOVA for Genotype vs Treatment: Interaction, F (1, 15) = 0.03596).
Fig. 4
Fig. 4. Morphological alterations in SNpc induced by LPS.
a Representative coronal images midbrain, SN, and VTA slices from 3,3’-diaminobenzidine (DAB)-stained TH+ neurons in WT and Snca+/+ rats treated with saline (SAL) or Lipopolysaccharide (LPS) at 3 months after injection (scale: 200 µm, 100 µm, 20 µm). b Unbiased stereological TH+ cell count plot in the SNpc. Each point represents actual values ± SEM. (n = 5 rats/group; Kruskal-Wallis test: p = 0.0031 (approximate); *p = 0,0159, **p = 0,0079, with Mann Whitney test). c Unbiased stereological TH+ cell count plot in the VTA. Each point represents actual values ± SEM. (n = 5 rats/group; (n = 5 rats/group; Ordinary two-way ANOVA for Genotype vs Treatment: Interaction, F (1, 15) = 0.3154). d Representative confocal images of stained SNpc sections for TH (green) and DDC (red) dopaminergic markers and NeuroTrace (NT, blue) in WT and Snca+/+ rats treated with saline (SAL) or Lipopolysaccharide (LPS) at 3 months after injection (scale: 20 µm). White arrowheads show TH-/DDC+/NT+ neurons (magenta). e Unbiased stereological count of total TH+/DDC+ neurons in SNpc. Each point represents actual values ± SEM. (n = 5 rats/group; Kruskal-Wallis test: p = 0.0082 (approximate); **p < 0.01, with Mann Whitney test). f Unbiased stereological count of total TH-/DDC- neurons in SNpc. Each point represents actual values ± SEM (n = 5 rats/group; Kruskal-Wallis test: p = 0.9016 (approximate)).
Fig. 5
Fig. 5. Morphological alterations in SNpr induced by LPS in Snca+/+ rats.
a Representative image of coronal midbrain slice from DAB-stained SNpr TH+ fibers in WT and Snca+/+ rats treated with SAL or LPS (scale: 50 µm) and related micrographs (scale: 10 µm). Black arrowheads show swollen TH+ dendrites morphology. b SNpr TH+ fibers densitometric analysis. Values are expressed as means of each animal normalized to the total mean value of SAL WT group ± SEM. (n = 5 rats/group; Ordinary two-way ANOVA for Genotype vs Treatment: Interaction, F (1, 16) = 6.614, p = 0.0205; Genotype, F (1, 16) = 8.053, p = 0.0119; Treatment, F (1, 16) = 6.497, p = 0.0214; *p < 0.05, **p < 0.01, with Bonferroni’s post hoc multiple comparisons test).
Fig. 6
Fig. 6. LPS induced functional and morphological alterations in the striatum.
a Left, schematic representation showing the placement of the stimulating (blue arrowhead) and carbon fiber (white arrowhead) used for the recordings in the dorsal striatum. Middle, representative traces (scale: 100 pA; 500 ms) and evoked DA concentration in the dorsal striatum at 3 months after treatment in WT and Snca+/+ rats recorded with constant potential amperometry. Right, bar plot showing max evoked DA outflow in Snca+/+ rats. (Ordinary two-way ANOVA Genotype vs Treatment; Interaction, F (1, 343) = 2.395; Genotype, F (1, 343) = 41.03, p < 0.0001; Treatment, F (1, 343) = 5.763, p = 0.0169; *p < 0.05, **p < 0.01, ****p < 0.0001, with Tukey’s post hoc multiple comparisons test). b Left, representative traces showing the effects of cocaine at different concentrations (top: 0.3 μM; Bottom: 1 μM) in SAL (left) and LPS (right) Snca+/+ rats. At the top right, the bar plot indicates the effect of cocaine on DA overflow (n = 4 SAL Snca+/+ cocaine [0.3 μM], n = 3 LPS Snca+/+ cocaine [0.3 μM], n = 3 SAL Snca+/+ cocaine [1 μM], n = 3 LPS Snca+/+ cocaine [1 μM]; Ordinary two-way ANOVA Treatment vs Cocaine concentrations; Interaction, F (1, 9) = 0.3939). On the right bottom, the bar plot indicates the effect of cocaine on the decay phase of the DAergic signal. Data are presented as mean ± SEM. (n = 4 SAL Snca+/+ cocaine [0.3 μM], n = 3 LPS Snca+/+ cocaine [0.3 μM], n = 3 SAL Snca+/+ cocaine [1 μM], n = 3 LPS Snca+/+ cocaine [1 μM]; Ordinary two-way ANOVA Treatment vs Cocaine concentrations; Interaction, F (1, 9) = 0.1171). c The bar plot shows the change in striatal DA release upon 5 min superfusion of quinpirole. Data are presented as mean ± SEM. (n= 3 rats/group; t-test, t = 0.1126). d Representative images of TH immunoreactivity of striatal coronal sections in WT and Snca+/+ rats treated with SAL or LPS 3 months after treatment (scale bar: 500 μm). The values are expressed as means of each animal normalized to the total mean value of SAL WT group ± SEM. (n = 5 rats/group; Ordinary two-way ANOVA for Genotype vs Treatment; Interaction, F (1, 15) = 0.2409).

References

    1. Dorsey, E. R. et al. Global, regional, and national burden of Parkinson’s disease, 1990–2016: a systematic analysis for the Global Burden of Disease Study 2016. Lancet Neurol.17, 939–953 (2018). - PMC - PubMed
    1. Hoehn, M. M. Parkinsonism: onset, progression, and mortality. - PubMed
    1. Jellinger, K. A. Neuropathobiology of non-motor symptoms in Parkinson disease. J. Neural Transm.122, 1429–1440 (2015). - PubMed
    1. Bernheimer, H., Birkmayer, W., Hornykiewicz, O., Jellinger, K. & Seitelberger, F. Brain dopamine and the syndromes of Parkinson and Huntington Clinical, morphological and neurochemical correlations. J. Neurol. Sci.20, 415–455 (1973). - PubMed
    1. Spillantini, M. G. et al. α-Synuclein in Lewy bodies. Nature388, 839–840 (1997). - PubMed

LinkOut - more resources