. 2024 Nov 5;15(1):9542.
doi: 10.1038/s41467-024-53839-5.

A bispecific CD40 agonistic antibody allowing for antibody-peptide conjugate formation to enable cancer-specific peptide delivery, resulting in improved T proliferation and anti-tumor immunity in mice

Affiliations

A bispecific CD40 agonistic antibody allowing for antibody-peptide conjugate formation to enable cancer-specific peptide delivery, resulting in improved T proliferation and anti-tumor immunity in mice

Aman Mebrahtu et al. Nat Commun. .

Abstract

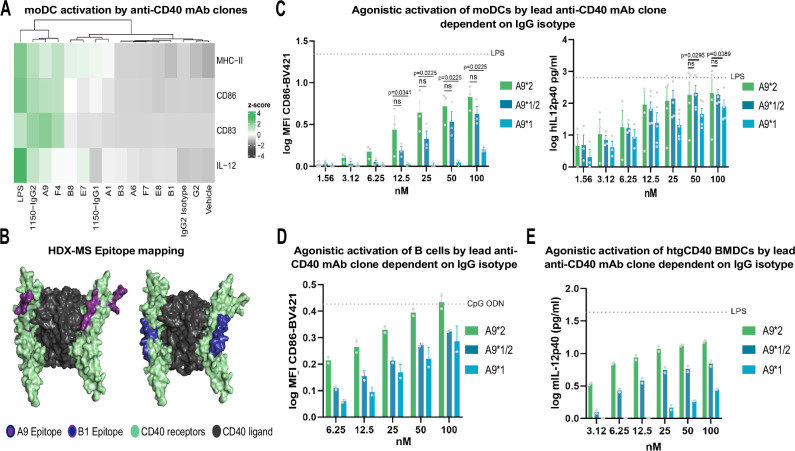
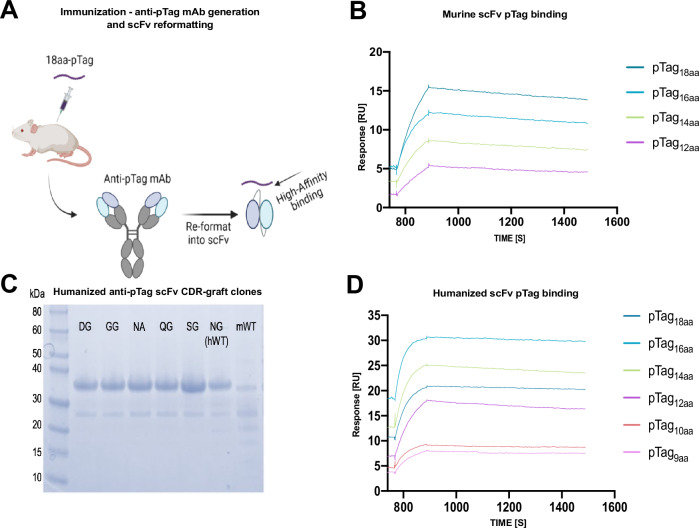
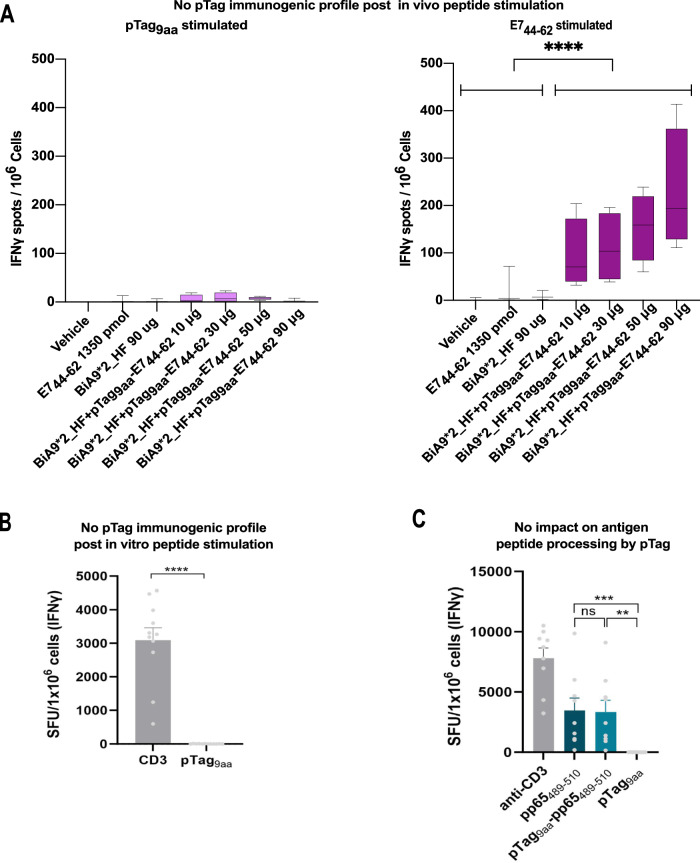
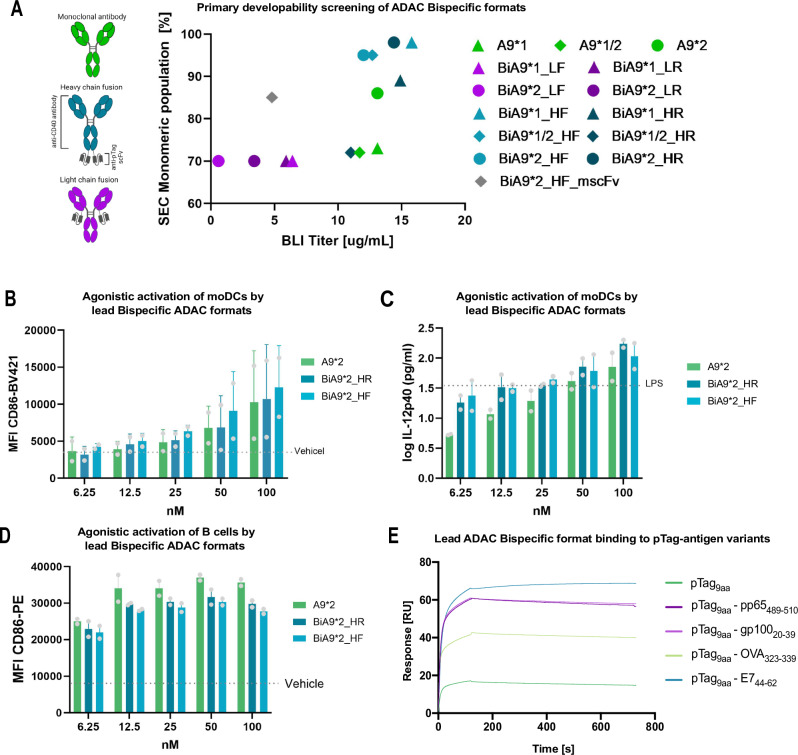
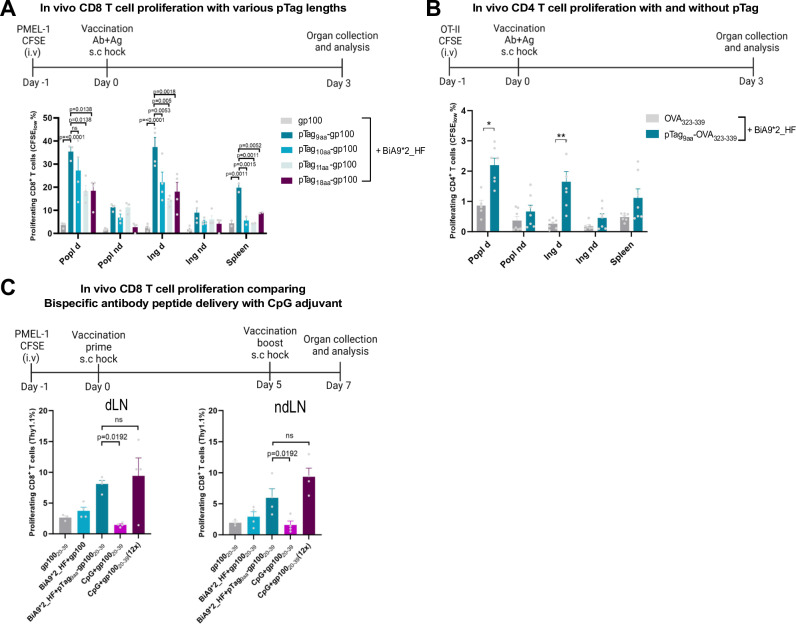
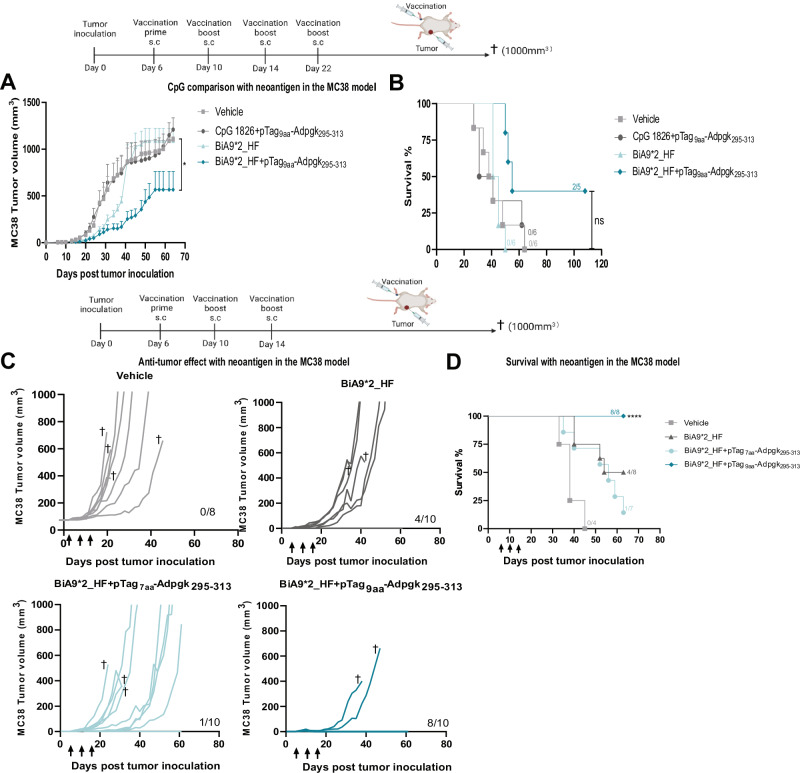
Current antibody-based immunotherapy depends on tumor antigen shedding for proper T cell priming. Here we select a novel human CD40 agonistic drug candidate and generate a bispecific antibody, herein named BiA9*2_HF, that allows for rapid antibody-peptide conjugate formation. The format is designed to facilitate peptide antigen delivery to CD40 expressing cells combined with simultaneous CD40 agonistic activity. In vivo, the selected bispecific antibody BiA9*2_HF loaded with peptide cargos induces improved antigen-specific proliferation of CD8+ (10-15 fold) and CD4+ T cells (2-7 fold) over control in draining lymph nodes. In both virus-induced and neoantigen-based mouse tumor models, BiA9*2_HF demonstrates therapeutic efficacy and elevated safety profile, with complete tumor clearance, as well as measured abscopal impact on tumor growth. The BiA9*2_HF drug candidate can thus be utilized to tailor immunotherapeutics for cancer patients.


Conflict of interest statement

The authors declare the following competing interests: The presented study has been partly funded by Strike Pharma AB, whose long-term value can be influenced by the publication of the paper. S.M., J.R., A.M., I.L., M.L., and P.D. hold private stakes in Strike Pharma AB, whose long-term value can be influenced by the publication of the paper. R.V. is a current employee, and G.G.A. was an employee at Strike Pharma AB when the presented work was carried out. The rest of the authors declare no competing interest.

Figures

Fig. 1
Fig. 1. Overview of the principal workflow and advantages of the Adaptable Drug Affinity Conjugate (ADAC) technology.
A Overview of precision immunotherapy using patient-specific identification of tumor neoantigens by sequencing. Patient tumor samples are sequenced for neoantigen determination by in silico prediction. Patient-specific neoantigens are synthesized as peptides for personalized immunotherapy eliciting tumor-specific responses. B A modular bispecific antibody, adaptable-drug-affinity-conjugate based antigenic peptide delivery, and subsequent peptide-specific T cell anti-tumor response, compared to other therapeutic immunostimulatory/vaccination modalities and delivery strategies. The bispecific CD40 targeting agonistic antibody drives DC activation, simultaneously allowing for modular delivery of antigenic peptides via a static peptide stretch, the pTag, interacting through a high-affinity interaction with an anti-pTag scFv recombinantly fused to the parental antibody. Illustrations created with Biorender.com.
Fig. 2
Fig. 2. Agonistic activity of novel clones driven by the interplay between epitope, affinity, and IgG subclass.
A The agonistic activity of the anti-CD40 mAbs clones incubated for 48 h with immature moDCs evaluated for upregulation of markers MHC-II, CD86, and CD83 clustered in heatmap together with IL-12 secretion. B Epitope mapping of the top agonistic clone A9 and non-agonistic clone B1 determined by HDX-MS illustrated in a CD40L-CD40 crystal structure (PDB 3QD6). C Agonistic activity of the mAbs was performed by incubation with immature moDCs for 48 h and evaluated by flow cytometry of CD86 MFI levels (illustrated as background-subtracted log-transformed values) n = 3 (independent donors) and IL-12p40 levels n = 5 (independent donors pooled from two individual experiments) in the supernatant were quantified by ELISA. P-values are shown in the graph (ns = non-significant) and calculated with Kruskal-Wallis with Dunn´s multiple (CD86) and one-way ANOVA with Dunnett´s multiple comparisons test (hIL12p40). D Agonistic activity of mAbs evaluated by upregulation of CD86 on isolated CD19+ B cells via flow cytometry 24 h post-stimulation. n = 2 (independent donors, illustrated as the mean of two technical replicates). E Immature htgCD40 BMDCs were stimulated for 48 h with the mAbs thereafter, IL-12p40 was quantified by ELISA in the supernatant. n = 1 (mean value from two technical replicates). Data is shown as mean ± SEM.
Fig. 3
Fig. 3. Optimization of anti-pTag scFv and pTag peptide length.
A A 18aa-long unstructured peptide was used to generate a murine-derived scFv. The generated hybridoma from immunization was sequenced and reformatted to a humanized format. B SPR sensorgram showing no significant effect on affinity towards the peptide sequence by scFv when trimmed sequence from original 18aa to pTag12aa. C SDS-PAGE post expression in E. coli and subsequent Ni-NTA purification of humanized anti-pTag scFv clones with deamidation site removed. Molecular reference size markers stated in KDa. The gel was repeated twice with similar results. D SPR sensogram shows retained binding by humanized single chain clone SG to pTag peptide trimmed variants ranging from the original pTag18aa sequence down to pTag9aa. Illustration created with Biorender.com.
Fig. 4
Fig. 4. Evaluation of pTag immunogenicity and impact on antigen processing.
A ELISpot analysis of spots of background subtracted IFNγ secretion post-stimulation of isolated lymphocytes from vaccinated mice, with 5 µM of peptides for 22 h. n = 16 individual mice with 4 mice in each group. The whiskers show min and max values, and the box extends from 25 to 75 percentiles, with the middle line representing the median. ****p = < 0.0001 calculated with unpaired Mann-Whitney t test. B ELISpot analysis of spots of background subtracted IFNγ secretion post-co-culture of T cells and moDCs treated with 10 µM pTag9aa-pp65495-503 for 10 days and restimulated with 2 µM pTag9aa or αCD3 for 20 h. CD3 n = 11 and pTag9aa n = 12 (individual donors pooled from three independent experiments) ****p = <0.0001 calculated with unpaired two-tailed t test). C ELISpot analysis of spot forming units (SFU) of background subtracted IFNγ secretion post-stimulation with 10 uM of peptides for 24 h n = 9 (individual donors pooled from two individual experiments). **p = 0.0011, ***p = 0.0008 ns = non-significant calculated with Kruskal-Wallis with Dunn´s multiple comparison test. All data are illustrated as mean with ± SEM.
Fig. 5
Fig. 5. ADAC-adapted Bispecific antibodies based on the novel A9 CD40 agonistic mAb and humanized anti-pTag scFv.
A Developability profile of the generated bispecific constructs adapted for the ADAC platform based on expression titers quantified by BLI and SEC profile post purification. Constructs grouped and colored by fusion point, linker type, and IgG isotype (B) MFI of activation marker CD86 evaluated by flow cytometry and (C) IL-12p40 levels in supernatant quantified by ELISA on moDCs 48 h post incubation. n = 2 (individual donors, illustrated as the mean of two technical replicates). D MFI of activation marker CD86 on CD19+ B cells evaluated by flow cytometry 24 h post incubation with lead BiAb candidates show agonistic activity on par with the parental antibody. n = 1 (individual donors, illustrated as two technical replicates). E SPR sensogram demonstrating the retained binding and modularity of the ADAC platform when anti-pTag scFv fused to the novel anti-CD40 mAb. Binding to pTag9aa synthesized with four different antigen cargos; pp65489-510, gp10020-39, OVA323-339, E744-62, and non-cargo attached free pTag9aa (A) BLI data are based on the mean from triplicate measurements. B n = 2 (individual donors, illustrated as the mean of two background-subtracted log-transformed technical replicates). BD the data are illustrated as mean ± SEM. Illustration created with Biorender.com.
Fig. 6
Fig. 6. The lead drug candidate BiA9*2_HF induces both CD8+ and CD4+ peptide antigen-specific T cell expansion in vivo.
A PMEL-1 T cells 72 h post vaccination with BiA9*2_HF (15 pmol = 3 µg) co-injected with a 2.5 molar ratio of the pTag-gp10020-39 peptide (37.5 pmol = 0.12 µg) or gp10020-39 peptide (37.5 pmol = 0.08 µg) and with length variants of the pTag in the draining popliteal (Popl d), non-draining popliteal (Popl nd), draining inguinal (Ing d), non-draining inguinal (Ing nd) lymph nodes and spleen were quantified by flow cytometry, defined as percentage of CD3+, CD8+, Thy1.1+ and CFSElow (proliferating cells). n = 20 (4 mice/group) tgCD40 from Biocytogen. P -values are shown in the graph and calculated with one-way ANOVA with Dunnett’s multiple comparisons test. B OT-II T cell proliferation 72 h post vaccination with the BiA9*2_HF (15 pmol = 3 µg) co-injected with the pTag9aa-OVA323-339 peptide (37.5 pmol = 0.1 µg) or OVA323-339 (37.5 pmol = 0.07 µg) quantified by flow cytometry as percentage CFSElow of the CD3+ and CD4+ T cells. n = 14 (7 mice in each group), tgCD40 from Southampton, data pooled from two independent experiments. *p = 0.0476 and **p = 0.0016 calculated with unpaired two-tailed t test, (C) Proliferating PMEL-1 CD8+ T cells post two-time vaccination with the BiA9*2_HF (250 pmol = 50 µg followed by 150 pmol = 30 µg) or CpG (20 µg) combined with the pTag-gp10020-39 peptide (375 pmol=1.2 µg) or gp10020-39 (375 pmol = 0.83 µg or 4510 pmol = 10 µg) quantified by flow cytometry as percentage of the transferred Thy1.1+ cells of the CD3+ and CD8+ T cells.. gp10020-39 group n = 3, remaining groups n = 4, tgCD40 from Biocytogen. P-values are shown in the graph (ns = non-significant) and calculated with one-way ANOVA with Dunnett´s multiple comparisons test. All data is shown as mean with ± SEM.
Fig. 7
Fig. 7. Low dose BiA9*2_HF loaded with tagged E7 derived tumor antigen induces anti-tumor responses on distant growing TC-1 tumor with minimal toxicity effects.
A Tumor volume over time and survival analysis in mice treated with indicating groups using 30 µg (150pmol) of BiA9*2_HF and 3 µg (925 pmol) of E744-62 peptide with and without pTag in the TC-1 model. Tumor growth: E744-62 n = 6, BiA9*2_HF n = 6, BiA9*2_HF + E744-62 n = 6, BiA9*2_HF + pTag9aa-E744-62 n = 8, tgCD40 from Biocytogen. *p = 0.0112, calculated with the Kruskal-Wallis test with Dunn’s multiple comparisons test. Survival analysis: E744-62 n = 6, BiA9*2_HF n = 5, BiA9*2_HF + E744-62 n = 5, BiA9*2_HF + pTag9aa-E744-62 n = 7, tgCD40 from Biocytogen. **p = 0.0018 calculated with Kaplan-Meier survival analysis with log-rank test. B Survival analysis of mice over time treated in the indicating groups using 30 µg of BiA9*2_HF and 1.5 µg (450 pmol) of E744-62 peptide linked to the pTag injected s.c or 100 µg intravenously infused selicrelumab. Vehicle n = 4, selicrelumab n = 3, BiA9*2_HF + pTag9aa-E744-62 n = 7, tgCD40 from Biocytogen. *p = 0.0296 calculated with Kaplan-Meier survival analysis with log-rank test. C Tetramer positive antigen-specific CD8+ T cells in circulating blood of treated mice performed at day 17. Vehicle n = 5, selicrelumab n = 3, BiA9*2_HF + pTag9aa-E744-62 n = 4. The whiskers show min and max values, and the box extends from 25 to 75 percentiles, with the middle line representing the median. *p = 0.0488 and calculated with one-way ANOVA with Dunnett’s multiple comparison test. D AST levels in plasma 24 h post first treatment with indicated groups, same mol ratio between the i.v doses. D Vehicle n = 5, selicrelumab n = 5, BiA9*2_HF i.v n = 5, BiA9*2_HF + pTag9aa-E744-62 s.c n = 5, tgCD40 from Biocytogen. P-values are shown in the graph and calculated with the Kruskal-Wallis test with Dunn’s multiple comparison test. E Platelet counts after 4 h in ID. Flow. Graph shows fold change of platelets (PLTs), presented as percentage change as compared to test buffer alone. BiA9*2_HF+pTag9aa-KRASG12D n = 10 and selicrelumab n = 10. **p = 0.0021 calculated with unpaired Mann-Whitney t test. F, G Quantified levels of ALT and ALP in plasma of immunized NHPs with BiA9*2_HF and pTag9aa-KRASG12V at indicated time-points. Arrows indicate the time of vaccination, and * indicates that only NHP-II got the third treatment.
Fig. 8
Fig. 8. BiA9*2_HF loaded with tagged neoantigen from an experimental colorectal model leads to superior anti-tumor responses compared to CpG as adjuvant and displays complete tumor regression upon dose elevation.
A, B Tumor volumes over time and survival analysis in mice treated with indicating groups using 30 µg of BiA9*2_HF and 1.44 µg (450pmol) of pTag9aa-Apgk295-313 peptide or 20 µg of CpG with 6.4ug (2000pmol) of pTag9aa-Adpgk295-313. A Vehicle n = 8, CpG + pTag9aa-Adpgk295-313 n = 8, BiA9*2_HF n = 8 and BiA9*2_HF + pTag9aa- Adpgk295-313 n = 8, in Biocytogen mice. *p = 0.0397 calculated with the Kruskal-Wallis test with Dunn’s multiple comparison test. B Vehicle n = 6, CpG + pTag9aa-Adpgk295-313 n = 6, BiA9*2_HF n = 6 and BiA9*2_HF + pTag9aa- Adpgk295-313 n = 5. ns = non-significant calculated with Kaplan-Meier survival analysis with log-rank test. C Individual tumor growth over time in the MC38 model with arrows indicating therapy administration. Vehicle n = 8, BiA9*2_HF n = 8, BiA9*2_HF + pTag7aa- Adpgk295-313 n = 10 and BiA9*2_HF + pTag9aa- Adpgk295-313 n = 10, tgCD40 from Biocytogen. D Survival analysis of mice treated with 30 µg BiA9*2_HF at the first and third injection and 90 µg at the second injection, either alone or in combination with 1.44 µg (450pmol) pTag9aa-Adpgk295-313 or 1.32 µg (450pmol) pTag7aa-Adpgk295-313. At day 14, the vehicle group received 30 µg BiA9*2_HF with 1.44 µg (450pmol) pTag9aa-Adpgk295-313. Vehicle n = 4, BiA9*2_HF n = 8, BiA9*2_HF + pTag7aa- Adpgk295-313 n = 7 and BiA9*2_HF + pTag9aa- Adpgk295-313 n = 8. ****p = < 0.0001 calculated with Kaplan-Meier survival analysis with log-rank test. Data is shown as mean with ± SEM (A).

Similar articles

References

    1. Cuzzubbo, S. et al. Cancer Vaccines: Adjuvant Potency, Importance of Age, Lifestyle, and Treatments. Front. Immunol.11, 10.3389/fimmu.2020.615240 (2021). - PMC - PubMed
    1. Alameh, M. G. et al. Lipid nanoparticles enhance the efficacy of mRNA and protein subunit vaccines by inducing robust T follicular helper cell and humoral responses. Immunity54, 2877–2892 (2021). - PMC - PubMed
    1. Paston, S. J., Brentville, V. A., Symonds, P. & Durrant, L. G. Cancer vaccines, adjuvants, and delivery systems. Front. Immunol. 12, 10.3389/FIMMU.2021.627932 (2021). - PMC - PubMed
    1. Xiang, S. D., Wilson, K. L., Goubier, A., Heyerick, A. & Plebanski, M. Design of peptide-based nano vaccines targeting leading antigens from gynecological cancers to induce HLA-A2.1 restricted CD8+ T cell responses. Front. Immunol.9, 10.3389/FIMMU.2018.02968 (2018). - PMC - PubMed
    1. Rosa, S. S., Prazeres, D. M. F., Azevedo, A. M. & Marques, M. P. C. mRNA vaccines manufacturing: Challenges and bottlenecks. Vaccine39, 2190 (2021). - PMC - PubMed

Publication types

MeSH terms

LinkOut - more resources