. 2024 Nov 5;15(1):9567.
doi: 10.1038/s41467-024-53992-x.

Plasmid-encoded phosphatase RapP enhances cell growth in non-domesticated Bacillus subtilis strains

Affiliations

Plasmid-encoded phosphatase RapP enhances cell growth in non-domesticated Bacillus subtilis strains

Manlu Zhu et al. Nat Commun. .

Abstract

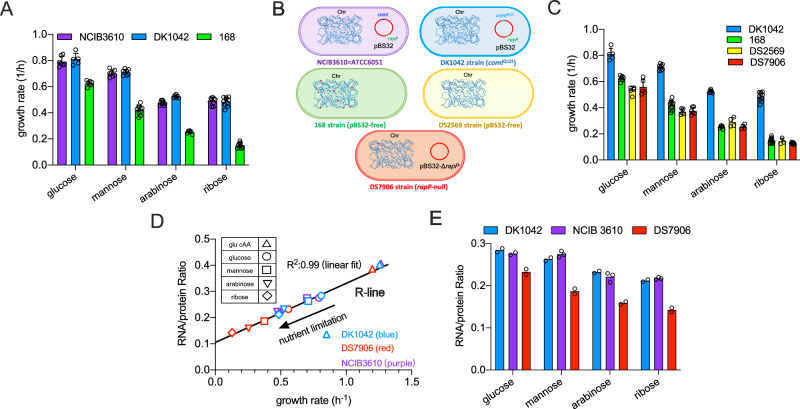
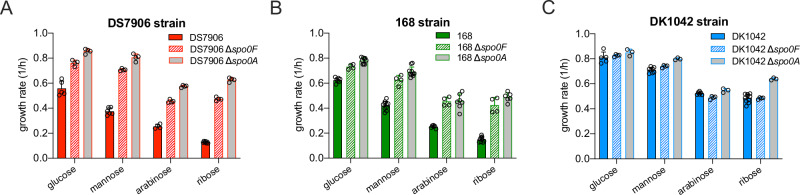
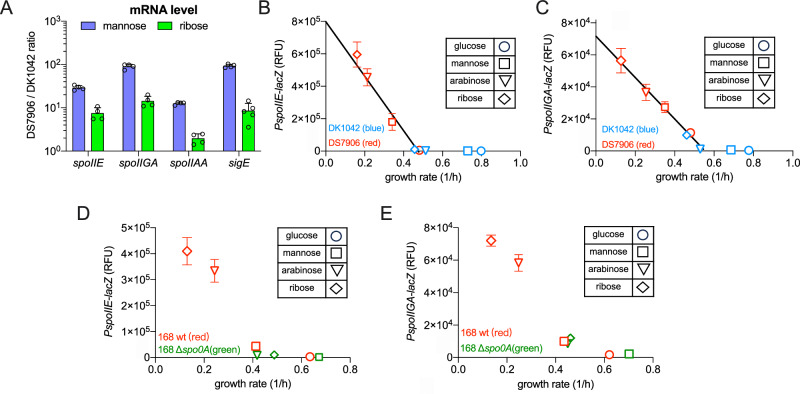
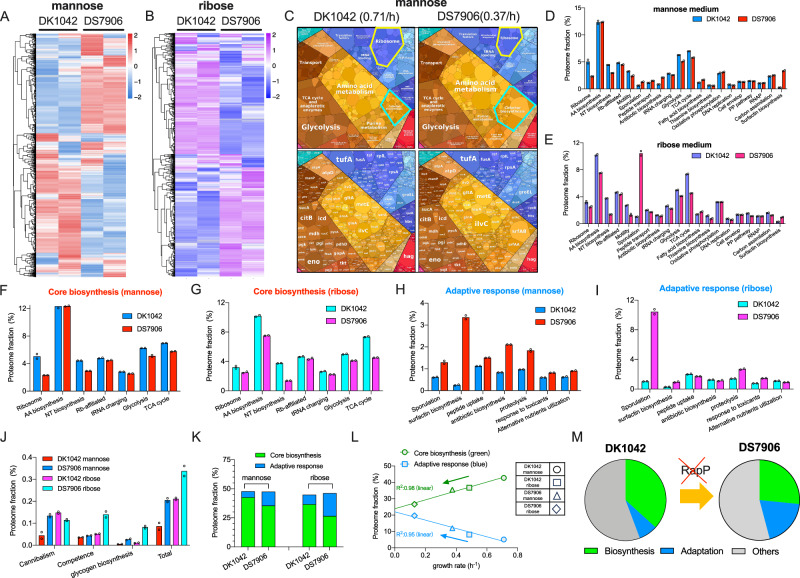
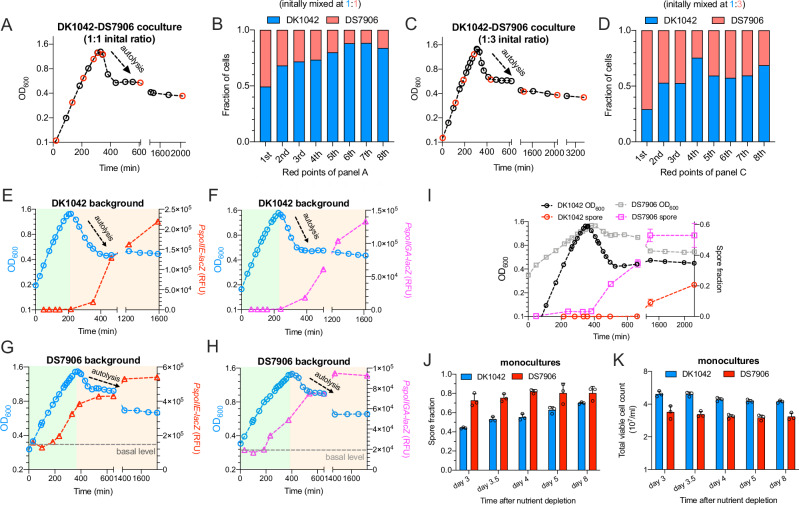
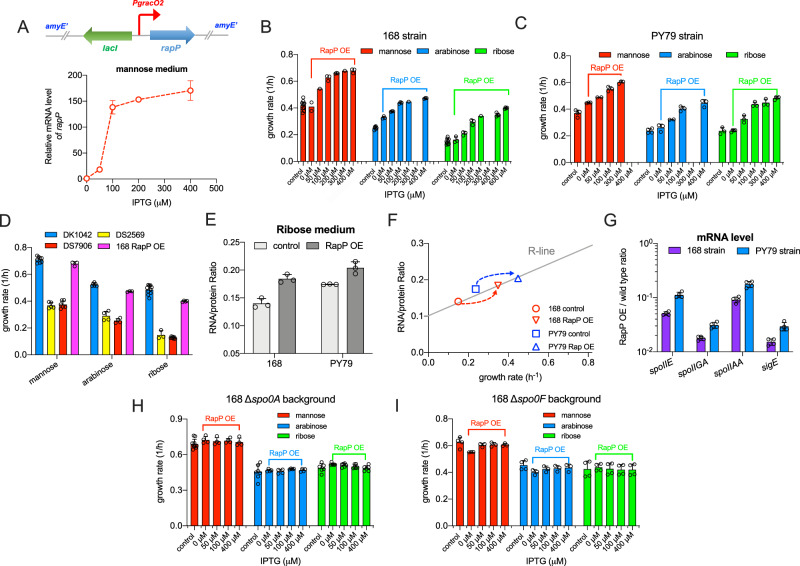
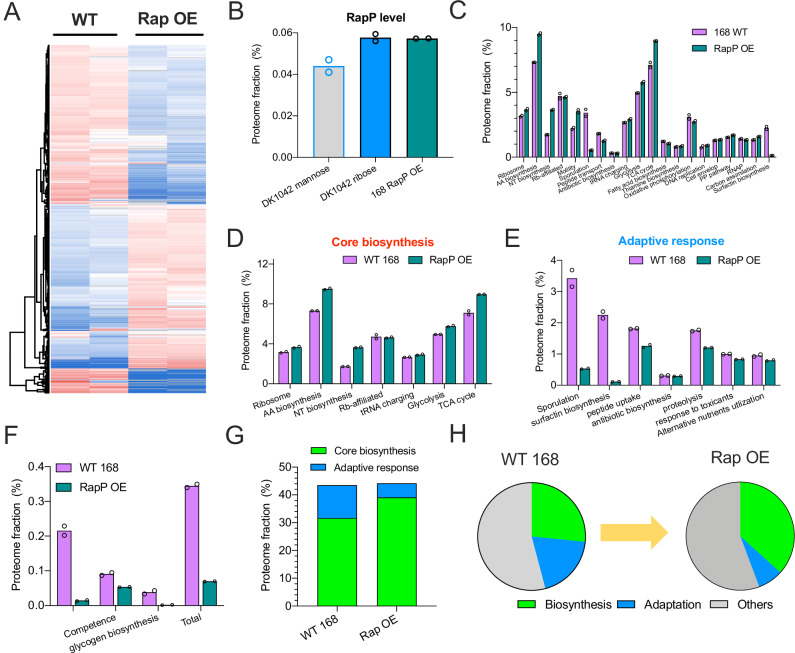
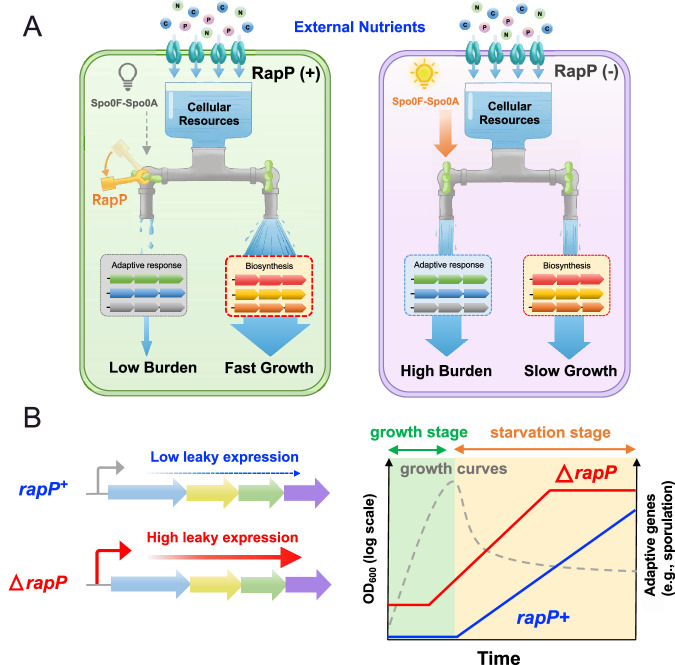
The trade-off between rapid growth and other important physiological traits (e.g., survival and adaptability) poses a fundamental challenge for microbes to achieve fitness maximization. Studies on Bacillus subtilis biology often use strains derived after a process of lab 'domestication' from an ancestral strain known as Marburg strain. The domestication process led to loss of a large plasmid (pBS32) encoding a phosphatase (RapP) that dephosphorylates the Spo0F protein and thus regulates biofilm formation and sporulation. Here, we show that plasmid pBS32, and more specifically rapP, enhance growth rates by preventing premature expression of the Spo0F-Spo0A-mediated adaptive response during exponential phase. This results in reallocation of proteome resources towards biosynthetic, growth-promoting pathways without compromising long-term fitness during stationary phase. Thus, RapP helps B. subtilis to constrain physiological trade-offs and economize cellular resources for fitness improvement.


Conflict of interest statement

The authors declare no competing interests.

Figures

Fig. 1
Fig. 1. The growth physiology of undomesticated and domesticated B. subtilis strains.
A The growth rates of NCIB 3610, DK1042, and 168 strains on various carbon sources. Data are presented as the mean values ± standard deviations (SD) of several biological replicates (for NCIB 3610 strain: n = 7 for glucose and mannose; n = 9 for arabinose and ribose; for DK1042 strain: n = 5, 8, 6, 10 for glucose, mannose, arabinose and ribose, respectively; for 168 strain: n = 7, 10, 6, 9 for glucose, mannose, arabinose and ribose, respectively). B Schematics of several B. subtilis strains used in this study. “Chr” is short for chromosome. NCIB 3610, DK1042, DS2569, and DS7906 share the same sequence of chromosomes while the domestical 168 strain carries additional mutations (represented by red points) in some chromosomal positions such as sfp, swrA, trpC, and gudB. C The growth rates of DK1042, 168, DS2569, and DS7906 strains on various carbon sources. Data of DK1042 and 168 are the same as (A). Data are presented as the mean values ± standard deviations (SD) of several biological replicates (for DS2569: n = 5, 5, 4, 3 for glucose, mannose, arabinose and ribose, respectively; for DS7906 strain: n = 5, 6, 4, 7 for glucose, mannose, arabinose and ribose, respectively). D Correlation of RNA/protein ratios versus growth rates for DK1042, NCIB 3610, and DS7906 strains under various nutrient conditions. Data of DK1042 and NCIB 3610 strains almost completely overlap with each other. E Comparison of RNA/protein ratios of DK1042, NCIB 3610, and DS7906 strains on different carbon sources. Individual data points are from different biological replicates. (n = 3 for NCIB 3610 on arabinose and ribose and n = 2 for all the rest conditions). Source data are provided as a Source Data file.
Fig. 2
Fig. 2. The effect of spo0F or spo0A knockout on the growth of DS7906, 168, and DK1042 strains.
A The effect of spo0F or spo0A knockout on the growth rates of DS7906 strain on different carbon sources. Data are presented as the mean values ± standard deviations (SD) of several biological replicates. n = 5, 6, 4, 7 on glucose, mannose, arabinose and ribose, respectively for DS7906 strain; n = 4 for all the conditions of spo0F-null and spo0A-null strains. B The effect of spo0F or spo0A knockout on the growth rates of 168 strain on different carbon sources. Data are presented as the mean values ± standard deviations (SD) of several biological replicates. n = 7, 10, 6, 9 on glucose, mannose, arabinose and ribose, respectively for wild type 168 strain. n = 4 for all the conditions of spo0F-null strain. n = 9, 10, 7, 6 on glucose, mannose, arabinose and ribose for spo0A-null strain. C The effect of spo0F or spo0A knockout on the growth rates of DK1042 strain on different carbon sources. Data are presented as the mean values ± standard deviations (SD) of several biological replicates. n = 5, 8, 6, 10 on glucose, mannose, arabinose and ribose, respectively for DK1042 strain. n = 4 and 3 for spo0F-null strain and spo0A-null strain, respectively. Source data are provided as a Source Data file.
Fig. 3
Fig. 3. The effect of RapP on the expressions of sporulation genes.
A Relative mRNA levels of four sporulation genes in DS7906 strain compared with DK1042 strain growing in mannose and ribose media, respectively. Data are presented as the mean values ± standard deviations (SD) of several biological replicates. n = 4 for all the conditions except in the case of sigE data on ribose, for which n = 5. B Growth-rate dependent promoter activities of spoIIE gene in DK1042 and DS7906 strains. Data are presented as the mean values ± standard deviations (SD) of several biological replicates. n = 3 and n = 4 for DK1042 and DS7906 strain, respectively. C Growth-rate dependent promoter activities of spoIIGA in DK1042 and DS7906 strains. Data are presented as the mean values ± standard deviations (SD) of four biological replicates (n = 4). D Growth-rate dependent promoter activities of spoIIE gene in wild type 168 and its spo0A-null strains. Data are presented as the mean values ± standard deviations (SD) of three  biological replicates (n = 3). E Growth-rate dependent promoter activities of spoIIGA gene in wild type 168 and its spo0A-null strains. Data are presented as the mean values ± standard deviations (SD) of several biological replicates. n = 3 for all the data points. The LacZ reporter activities were measured by a fluorescent MUG substrate (see “Methods”) and expressed as relative fluorescence units (RFU). Source data are provided as a Source Data file.
Fig. 4
Fig. 4. The effect of RapP on proteome allocation of B. subtilis.
A, B Heatmaps of the proteomes of DK1042 and DS7906 strains growing in mannose and ribose media, respectively. C Proteome allocation of DK1042 and DS7906 strains visualized by the proteomaps website. Note that the term “mitochondrial biogenesis” inside of the large category “translation” was based on KEGG categorization consisting of both prokaryotes and eukaryotes. The readers should thus treat these proteins here as translation factors. Moreover, genes involved in biosynthesis of surfactin and some other lipopeptide antibiotics should be more properly treated as biosynthesis sector of secondary metabolites instead of cofactor biosynthesis. D, E The mass fractions of various functional proteome sectors of B. subtilis growing in mannose and ribose media. F, G The mass fractions of several core biosynthetic sectors of B. subtilis growing in mannose and ribose media. H, I The mass fractions of various adaptive response pathways of B. subtilis growing in mannose and ribose media. J The mass fractions of several low-abundant adaptive response pathways of B. subtilis. K The proteome fractions of total core biosynthetic pathways and total adaptive response pathways in mannose and ribose media. Total core biosynthetic sector refers to the sum of various sectors in (F) and (G) while total adaptive response sector refers to the sum of various sectors in (HJ). L The correlation of the proteome fractions of core biosynthetic category and adaptive response category with growth rates for the four conditions of B. subtilis. M Schematic illustration showing that the absence of RapP triggers the resource allocation from biosynthetic pathways to adaptive response pathways. For (DJ), individual data points correspond to two biological replicates (n = 2). Source data are provided as a Source Data file.
Fig. 5
Fig. 5. Need-based activation of sporulation pathway in the ancestral B. subtilis.
A The growth curve of DK1042-DS7906 coculture in mannose minimal medium. DK1042 and DS7906 strains were initially mixed at a ratio of 1:1. B The relative fractions of DK1042 and DS7906 cells in the coculture of (A) growing in mannose minimal medium. At each red point of the growth curve in (A), the fractions of DK1042 and DS7906 cells in the coculture were sequentially measured by plating. The X-axis denotes the eight time points (red) throughout the growth curve of (A). C, D Same as (A, B) but the DK1042 and DS7906 strains were initially mixed at a ratio of 1:3. E The promoter activities of spoIIE analyzed by LacZ reporter assay at different growth stages of DK1042 strain. For (E–H), the light green area shows the growth stage before nutrient depletion. The light orange area shows the starvation stage after nutrient depletion. F The promoter activities of spoIIGA analyzed by LacZ reporter assay at different growth stages of DK1042 strain. G The promoter activities of spoIIE analyzed by LacZ reporter assay at different growth stages of DS7906 strain. H The promoter activities of spoIIGA analyzed by LacZ reporter assay at different growth stages of DS7906 strain. I Sporulation efficiency of DK1042 and DS7906 mono-cultures under different growth stages in mannose medium. Sporulation data are presented as the mean values ± standard deviations (SD) of three biological replicates (n = 3). The reference growth curves of DK1042 and DS7906 were shown, respectively. J, K The spore fractions and total viable cell counts of DK1042 and DS7906 mono-cultures during long-term starvation in mannose medium. Data points were measured on different days after nutrient depletion. The time of nutrient depletion refers to the time point when OD600 reaches the highest value in the growth curve. Data are presented as the mean values ± standard deviations (SD) of several biological replicates. n = 3 for all the data points. Source data are provided as a Source Data file.
Fig. 6
Fig. 6. Introduction of rapP accelerates the growth of domesticated B. subtilis strains.
A An IPTG-inducible rapP expression cassette was integrated into the amyE locus of the domesticated B. subtilis 168 and PY79 strains to obtain the rapP-overexpressing strains. The mRNA levels of rapP could be titrated by addition of different concentrations of IPTG into the medium. Data are presented as the mean values ± standard deviations (SD) of three biological replicates (n = 3). B The effect of rapP overexpression on the growth rates of 168 strain on different carbon sources. Control refers to wild type 168 strain. Data are presented as the mean values ± standard deviations (SD) of several biological replicates (for n3). For mannose medium, n = 10, 2, 1, 3, 3, 1, 3 for control condition, 0 μM, 50 μM, 100 μM, 200 μM, 300 μM and 400 μM IPTG, respectively; for arabinose medium, n = 6, 3, 3, 3, 1, 3 for control condition, 0 μM, 50 μM, 100 μM, 200 μM, 400 μM IPTG, respectively; for ribose medium, n = 9, 3, 3, 3, 1, 4, 4 for control condition, 0 μM, 50 μM, 100 μM, 200 μM, 400 μM and 600 μM IPTG, respectively. C The effect of rapP overexpression on the growth of PY79 strain on different carbon sources. Control refers to wild type PY79 strain. Data are presented as the mean values ± standard deviations (SD) of several biological replicates (for n3). For mannose medium, n = 4, 3, 2, 3, 3 for control condition, 0 μM, 50 μM, 100 μM and 300 μM IPTG, respectively; for arabinose medium, n = 4, 3, 2, 3, 3 for control condition, 0 μM, 50 μM, 100 μM, 400 μM IPTG, respectively; for ribose medium, n = 3 for all the conditions except for 0 μM and 400 μM IPTG conditions, in which n = 4. D The growth rates of DK1042, DS2569, DS7906, and 168 RapP-overexpressing (OE) strains on various carbon sources. The data of 168 RapP OE strain correspond to the highest values of growth rates shown in Fig. 6B. Data are presented as the mean values ± standard deviations (SD) of several biological replicates. Data of DK1042, DS2569, and DS7906 are the same as shown in Fig. 1C. For the RapP OE condition, n = 3, 3, 4 for mannose, arabinose, and ribose media, respectively. E The effect of RapP overexpression on RNA/protein ratio of 168 and PY79 strains growing in ribose medium. 400 μM and 300 μM IPTG were added to the medium of 168 and PY79 RapP-overexpressing strains, respectively. Control refers to the wild type 168 and PY79 strains. Data are presented as the mean values ± standard deviations (SD) of three biological replicates (n = 3). F The correlation of RNA/protein ratio versus growth rate for the condition of RapP overexpression. Data points correspond to the data in (E). The gray R-line refers to the linear fit of Fig. 1D. G Relative mRNA levels of four sporulation genes in wild type 168 and PY79 strains compared with their RapP OE strains in ribose medium. 400 μM IPTG was added to the medium of RapP OE strain. Data are presented as the mean values ± standard deviations (SD) of four biological replicates (n = 4). H The effect of RapP overexpression on the growth of spo0A-null 168 strain on different carbon sources. Control refers to spo0A-null 168 strain without rapP integration. Data are presented as the mean values ± standard deviations (SD) of several biological replicates. For the control conditions, n = 10, 7 in mannose and arabinose media, respectively. n = 4 for all the rest conditions of mannose and arabinose media. n = 6 for all the conditions in ribose medium. I The effect of rapP overexpression on the growth of spo0F-null 168 strain on different carbon sources. Control refers to spo0F-null 168 strain without rapP integration. Data are presented as the mean values ± standard deviations (SD) of several biological replicates. n = 4 for control conditions on all three carbon sources. For the RapP overexpression conditions, n = 3 for mannose and arabinose media; n = 4 for ribose medium. Source data are provided as a Source Data file.
Fig. 7
Fig. 7. Introduction of rapP re-shapes the resource allocation of domesticated strain.
A Heatmap of the proteomes of wild type 168 and its RapP-overexpressing (OE) strains in ribose medium. 400 μM IPTG was added to the medium of RapP-overexpressing strain. B The proteome fraction of RapP protein in DK1042 strain growing in mannose and ribose media and the 168 RapP OE strain growing in ribose medium. C The mass fractions of various functional proteome sectors. D The mass fractions of several core proteome sectors of biosynthesis. E The mass fractions of various adaptive response pathways. F The mass fractions of several low-abundant adaptive response pathways. G The proteome fractions of total core biosynthetic sector and total adaptive response sector. Total core biosynthetic sector refers to the sum of various sectors in (D) while total adaptive response sector refers to the sum of various sectors in (E, F). H Schematic illustration showing that RapP overexpression triggers a global resource re-allocation from adaptive response pathways to biosynthetic pathways, further accelerating the growth of domesticated strain. For (BF), individual data points correspond to two biological replicates (n = 2). Source data are provided as a Source Data file.
Fig. 8
Fig. 8. RapP protein as a global growth accelerator in B. subtilis and enables need-based resource allocation: a two-way faucet model.
A The cellular resource is finite. RapP accelerates cell growth by minimizing the leaky expressions of Spo0A-mediated adaptive response during exponential stage and further maximizing the cellular budget of biosynthetic pathways to support rapid growth (left panel). In contrast, rapP-deficient strain (right panel) has an unnecessarily higher proteome burden on adaptive response even during exponential stage, which limits the cellular budget of biosynthesis and results in slower growth. B Schematic illustrations showing that rapP+ ancestral strain maintains a much lower leaky expression of adaptive response pathways (e.g., sporulation) than rapP-null strain during exponential stage. As a result, rapP+ ancestral strain (blue) could achieve need-based regulation of gene expression to unleash the growth potential during exponential stage while substantially activate adaptive response during starvation stage. Source data are provided as a Source Data file.

References

    1. Scott, M. & Hwa, T. Shaping bacterial gene expression by physiological and proteome allocation constraints. Nat. Rev. Microbiol.21, 327–342 (2022). - PMC - PubMed
    1. Scott, M., Gunderson, C. W., Mateescu, E. M., Zhang, Z. & Hwa, T. Interdependence of cell growth and gene expression: origins and consequences. Science330, 1099–1102 (2010). - PubMed
    1. Reyes-Lamothe, R. & Sherratt, D. J. The bacterial cell cycle, chromosome inheritance and cell growth. Nat. Rev. Microbiol.17, 467–478 (2019). - PubMed
    1. Belliveau, N. M. et al. Fundamental limits on the rate of bacterial growth and their influence on proteomic composition. Cell Syst.12, 924–944.e922 (2021). - PMC - PubMed
    1. Kostinski, S. & Reuveni, S. Ribosome composition maximizes cellular growth rates in E. coli. Phys. Rev. Lett.125, 028103 (2020). - PubMed

Publication types

MeSH terms

Substances

LinkOut - more resources