. 2024 Dec;27(12):2354-2365.
doi: 10.1038/s41593-024-01796-z. Epub 2024 Nov 5.

Cell type mapping reveals tissue niches and interactions in subcortical multiple sclerosis lesions

Affiliations

Cell type mapping reveals tissue niches and interactions in subcortical multiple sclerosis lesions

Celia Lerma-Martin et al. Nat Neurosci. 2024 Dec.

Abstract

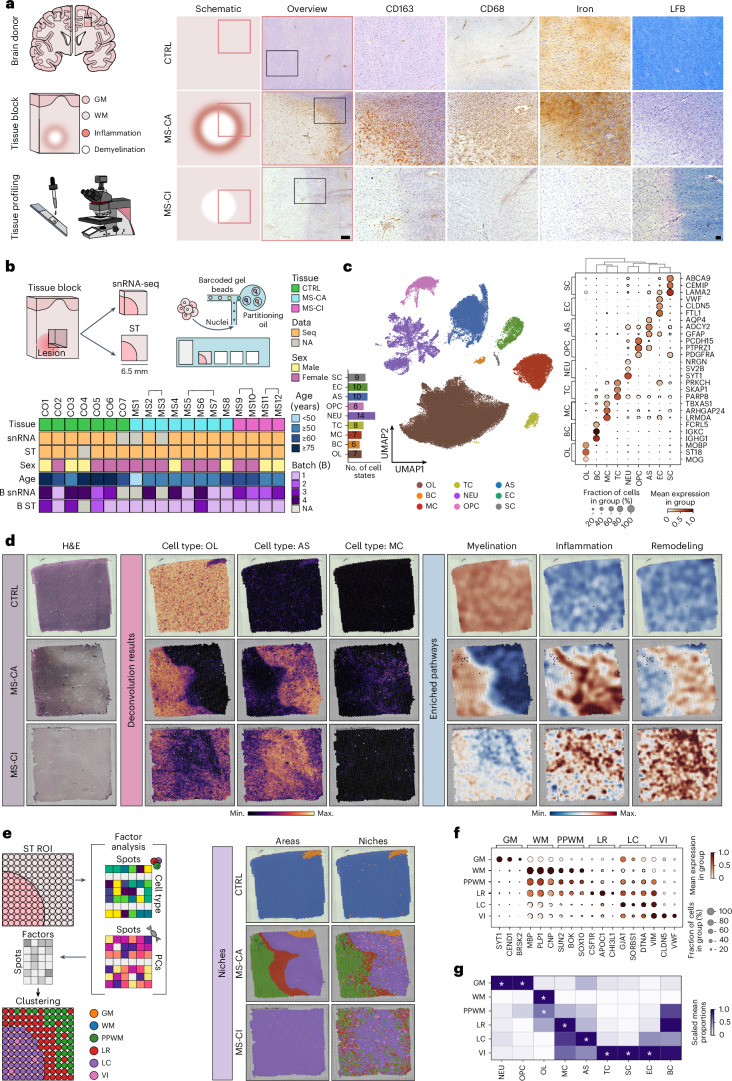
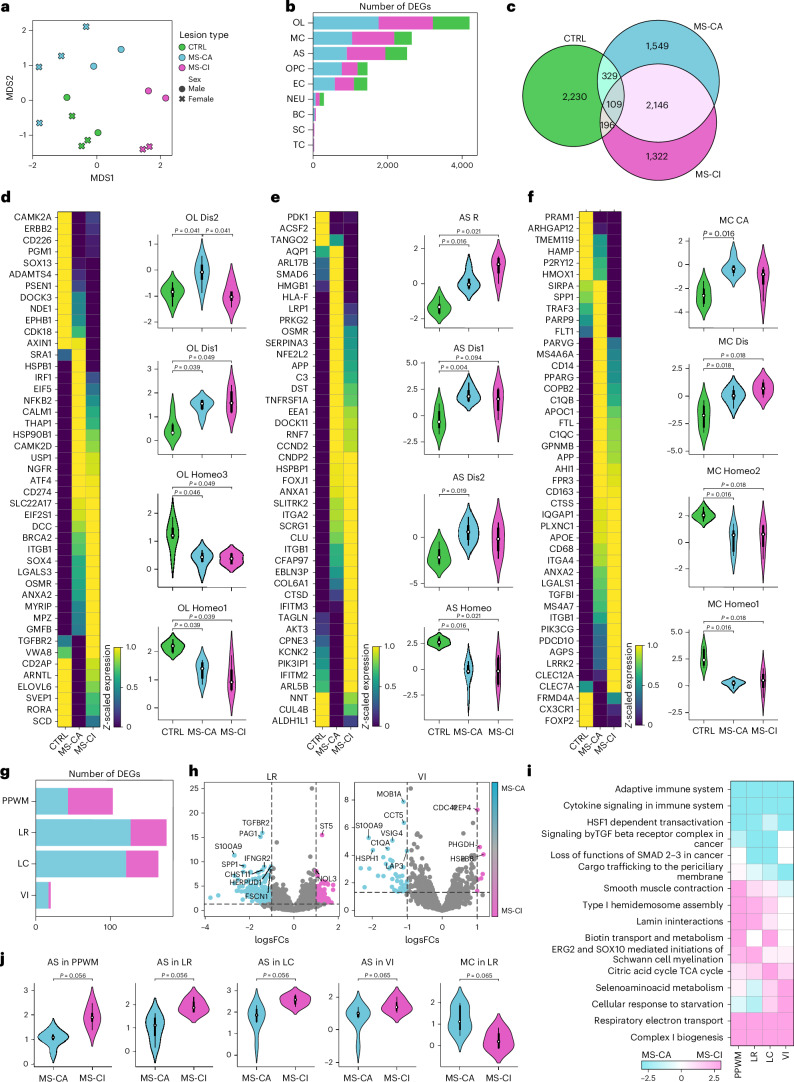
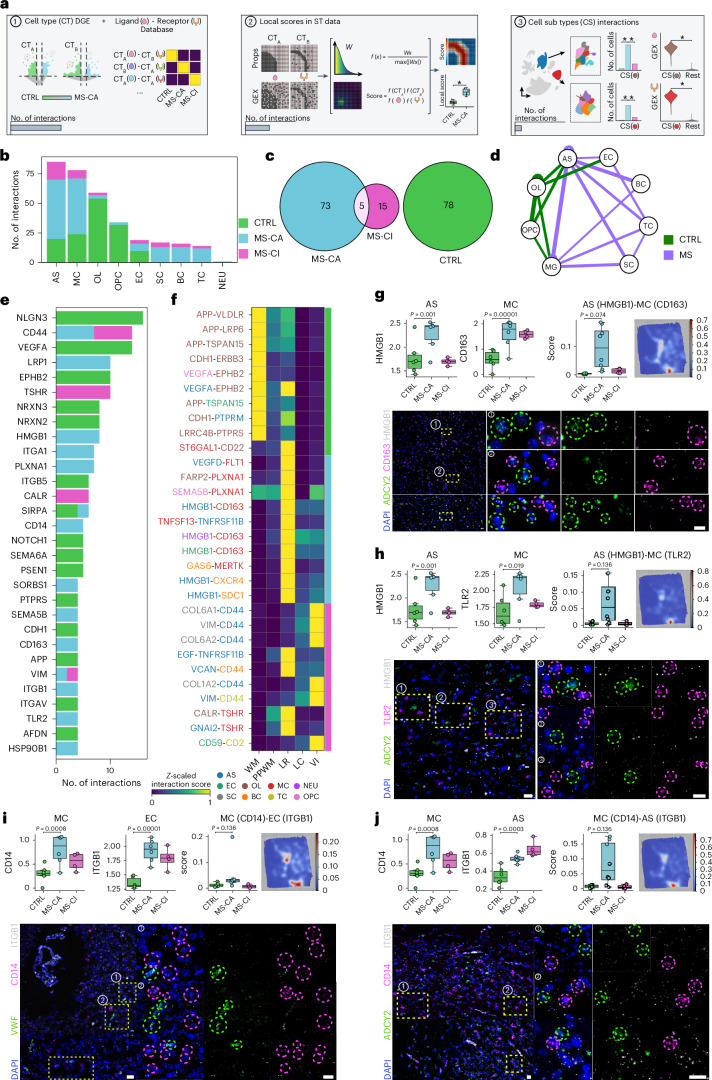
Multiple sclerosis (MS) is a chronic inflammatory disease of the central nervous system. Inflammation is gradually compartmentalized and restricted to specific tissue niches such as the lesion rim. However, the precise cell type composition of such niches, their interactions and changes between chronic active and inactive stages are incompletely understood. We used single-nucleus and spatial transcriptomics from subcortical MS and corresponding control tissues to map cell types and associated pathways to lesion and nonlesion areas. We identified niches such as perivascular spaces, the inflamed lesion rim or the lesion core that are associated with the glial scar and a cilia-forming astrocyte subtype. Focusing on the inflamed rim of chronic active lesions, we uncovered cell-cell communication events between myeloid, endothelial and glial cell types. Our results provide insight into the cellular composition, multicellular programs and intercellular communication in tissue niches along the conversion from a homeostatic to a dysfunctional state underlying lesion progression in MS.


Conflict of interest statement

Competing interests: P.E. has received travel expenses from Bayer Health Care. D.S. reports funding from Cellzome, a GSK company and received honorariums from Immunai, Noetik, Alpenglow and Lunaphore. J.S.-R. reports funding from GSK, Pfizer and Sanofi and fees/honoraria from Travere Therapeutics, Stadapharm, Astex, Owkin, Moderna, Pfizer and Grunenthal. L.S. reports research support from Roche and Merck and filed a patent for the detection of antibodies against KIR4.1 in a subpopulation of patients with multiple sclerosis (WO2015166057A1). The remaining authors declare no competing interests.

Figures

Fig. 1
Fig. 1. Spatial and cell-type profiling of subcortical control and MS tissues.
a, Lesion characterization design (left) and histological assessment (right) of MS lesions with IHC for CD163 and CD68 (myeloid cells) and stains for iron and LFB (myelin). Scale bars, 500 µm (Overview), 100 µm (CD163, CD68, Iron, LFB). b, Study design showing different data modalities and associated metadata. Links between samples indicate that they come from the same tissue block. NA, not available. c, Barplot with number of cell subtypes per main cell type (left), UMAP of integrated snRNA-seq data (n = 103,794, center) and dot plot of averaged z-transformed gene expression of marker genes for each cell type (right). Color corresponds to annotated cell types. d, Spatial panel displaying H&E staining (left), feature plots of cell type deconvolution results (center) and inferred pathway activities (right) in CTRL and MS lesion types. e, Pipeline design using MOFA+ to generate a spatial clustering from the integration of gene expression and deconvoluted cell type proportions (left) and comparison of histopathological areas with the computationally annotated niches between lesion types (right). f, Dot plot of averaged z-transformed gene expression of marker genes for each niche. g, Heatmap of z-transformed cell type proportions for each niche, asterisks indicate significance (adjusted P < 0.05). Min., minimum; max., maximum.
Fig. 2
Fig. 2. Characterization of a ciliated AS subtype in MS lesions.
a, UMAP of AS subtypes based on snRNA-seq. b, Dot plot of averaged z-transformed gene expression of marker genes for each AS subtype. c, Proportion of samples for each AS subtype. d, Violin plots of Cilia AS marker genes compared with other AS subtypes (n = 283 for Cilia AS, n = 12,704 for rest) (two-tailed t-test; BH-adjusted P < 0.05). e, Predicted number of Cilia AS per niche (empirical P < 0.05). f, Spatial feature plots showing the niches (left) and spots predicted to contain Cilia AS (right). g, smFISH for SPAG17 and ADCY2. Quantification of Cilia AS as percentage of total AS population in MS-CA. Cilia AS were quantified at lesion border (PPWM and LR) and in LC (n = 25 for border, n = 11 for LC) (two-sided Wilcoxon rank-sum test; P < 0.05). h, IF staining of cilia (SPAG17) in EP cells adjacent to the lateral ventricle. Scale bars, 5 µm. i, IF staining of damaged axons (SMI32) and cilia (SPAG17) in the LC of MS-CA lesions. j, Two IF examples showcasing the length of AS cilia in the LC of MS-CA lesions; note presence of elongated SPAG17+ cilia in AS versus EP cells. k, Dot plot of top-ranked enriched pathways. Color indicates overrepresentation significance by Fisher exact test, and size indicates odds ratio between Cilia AS marker genes and each geneset. FDR, false discovery rate. l, Violin plots of predicted transcription factor activity from snRNA-seq (n = 283 for Cilia AS, n = 12,704 for rest) (two-tailed t-test; BH-adjusted P < 0.05), showing the median (white dot), 25th percentile (Q1), and 75th percentile (Q3), with the ends of the black box indicating Q1 and Q3; the whiskers extend to the furthest datapoint within 1.5 times the interquartile range (IQR), specifically 1.5× (Q3–Q1), beyond Q3 or below Q1. m, Transcription factor FOXJ1 (square) and its target genes (circles). n, Spatial feature plots showing FOXJ1 predicted activity (blue/red) and gene expression of some of its target genes (purple/green). Scale bars, 20 µm (g, h (large panel), i, j).
Fig. 3
Fig. 3. Differential cell-type-specific profiling of CTRL and MS lesion tissues as well as corresponding niches.
a, MDS plot based on the aggregation of molecular and compositional differences across paired samples. Color indicates MS lesion type and control. Shape indicates biological sex. b, Cumulative number of DEGs per cell type across conditions. Color indicates condition as in a. c, Venn diagram visualizing overlap of aggregated DEGs between CTRL and MS lesion types. d, OL DEGs (left) and subtype composition (rigplot of enriched pathways for DEGst) associated with DEGs. e, AS DEGs (left) and subtype composition (right) associated with DEGs. f, MC DEGs (left) and subtype composition (right) associated with DEGs (n = 6 for CTRL, n = 6 for MS-CA, n = 4 for MS-CI). g, Cumulative number of DEGs per niche between MS lesion types. Color indicates MS lesion type as in a. h, Volcano plot of DEGs for LR and VI niches. Color indicates association to a MS lesion type as in a. i, Heatmap of pathway enrichment activities between niches. Color indicates association to a MS lesion type as in a. j, AS and MC compositional changes per individual niches between MS lesion types (n = 8 for MS-CA, n = 4 for MS-CI). Two-tailed Wilcoxon rank-sum test, BH-adjusted P < 0.10. Violin plots illustrate the median (white dot), 25th percentile (Q1) and 75th percentile (Q3), with the ends of the black box indicating Q1 and Q3; the whiskers extend to the furthest datapoint within 1.5× the IQR, specifically 1.5 × (Q3–Q1), beyond Q3 or below Q1.
Fig. 4
Fig. 4. Inference of differential CCC events.
a, Pipeline design for the inference and filtering of CCC events. First (left), DGE analysis results obtained from snRNA-seq were used to obtain significant cell type pair ligand–receptor interactions (BH-adjusted P < 0.15). Color scale indicates association with condition. Second (center), spatially weighted interaction local scores are computed for the selected interactions and tested for significance across lesion types (BH-adjusted P < 0.15). Violet to yellow scale indicates spatial weight; blue to red scales indicate magnitude of interaction scores. Third (right), interactions are only kept if their ligand or receptor was a marker gene for a MS lesion type and specific cell subtype. At each step, conflicting interactions were dropped to ensure robustness. GEX, gene expression. b, Cumulative number of differential interactions grouped by cell type across conditions. Color indicates condition. c, Venn diagram of overlapping interactions between MS lesion types and CTRL. d, Cell–cell network structure. Edge size indicates number of interactions. Green indicates healthy (CTRL) and purple disease (MS-CA and MS-CI) specificity. e, Top 30 significant interactions grouped by gene across conditions. f, Top 30 significant interactions per MS lesion types and CTRL across niches. Text color indicates sender (left) and receiver (right) cell types. g,h, Box plots of AS-encoded ligand HMGB1 and MC-encoded receptors CD163 (g) or TLR2 (h) between conditions (top left and center). Note box plot showing cell–cell interaction scores between ligand and receptor together with predicted ST mapping (top right). smFISH for ADCY2 (AS), CD163/TLR2 (MC) and HMGB1 (ligand). i,j, Box plots of MC-encoded ligand CD14 and both the EC-encoded (i) or AS-encoded (j) receptor ITGB1 (top left and center). Note box plot showing interaction scores between MC and EC/AS cells with predicted ST mapping. smFISH for CD14 (MC), ITGB1 (EC/AS) and VWF (EC) or ADCY2 (AS). Two-tailed Wald test for gene expression; BH-adjusted P < 0.05; n = 6 for CTRL, n = 6 for MS-CA, n = 4 for MS-CI; two-tailed Wilcoxon rank-sum test for interaction scores; BH-adjusted P < 0.10; n = 6 for CTRL, n = 8 for MS-CA, n = 4 for MS-CI. Scale bars, 20 µm. Box plots illustrate the median (white dot), 25th percentile (Q1) and 75th percentile (Q3), with the ends of the black box indicating Q1 and Q3; the whiskers extend to the furthest datapoint within 1.5× the IQR, specifically 1.5 × (Q3–Q1), beyond Q3 or below Q1.
Extended Data Fig. 1
Extended Data Fig. 1. Quality control of snRNA-seq data.
a, Distribution of number of genes per nucleus (left), distribution of number of UMIs per nucleus (center) and total number of nuclei per snRNA-seq sample (n per sample is represented at the right). b, UMAP colored by doublet score (top left), fraction of MT counts (top right), number of expressed genes (bottom left), and total number of UMIs (bottom right) per nucleus. c, Proportion of nuclei per MS lesion type and CTRL grouped by cell type (left), UMAP colored by MS lesion type and CTRL (right). d, Proportion of nuclei per snRNA-seq sample grouped by cell type (left), UMAP colored by snRNA-seq sample (right). e, Pearson correlation matrix of transcriptomic profiles between the snRNA-seq atlas of this study and Absinta et al. (BH adjusted P < 0.05, r > 0.75).
Extended Data Fig. 2
Extended Data Fig. 2. Cell subtype annotation across cell types.
a, Oligodendrocytes (OL), b, Oligodendrocyte Precursor Cells (OPC), c, Myeloid cells (MC), d, Endothelial cells (EC). For each cell type: original UMAP colored by the given cell type and cell subtype name abbreviations (left); UMAP colored by cell subtypes (center left); dot plot of averaged z-transformed gene expression of marker genes for each cell subtype (center right); proportion of nuclei per condition and snRNA-seq sample grouped by cell subtype (right).
Extended Data Fig. 3
Extended Data Fig. 3. Cell subtype annotation across cell types.
a, Stromal cells (SC), b, T cells (TC), c, B cells (BC), d, Neurons (NEU). For each cell type: original UMAP colored by the given cell type and cell subtype name abbreviations (left); UMAP colored by cell subtypes (center left); dot plot of averaged z-transformed gene expression of marker genes for each cell subtype (center right); proportion of nuclei per condition and snRNA-seq sample grouped by cell subtype (right).
Extended Data Fig. 4
Extended Data Fig. 4. Quality control of ST data and histopathological lesion assessment.
a, Distribution of number of genes per spot (left), distribution of number of UMIs per spot (center) and total number of spots per ST sample (n per sample is represented at the right). b, ST feature plots showing H&E staining, number of UMIs per spot, number of expressed genes per spot and annotated histopathological areas for each analyzed sample. c, IHC for LFB (left) to visualize demyelinated lesion areas in MS samples and IHC for CD163 (right) to highlight inflamed lesion areas of analyzed samples. Overview scale bar 500µm.
Extended Data Fig. 5
Extended Data Fig. 5. Quality control for deconvolution analysis.
a, Correlation plots between inferred ST cell type proportions and snRNA-seq data grouped by sample. b, Correlation plots comparing predicted ST cell type proportions and snRNA-seq data grouped by cell type. Proportions in a and b were log10-transformed to make them comparable.
Extended Data Fig. 6
Extended Data Fig. 6. Quality control of niche annotations and spatial niche trajectory.
a, ST feature plots visualizing niches annotated in an unsupervised way per sample. b, Proportion of ST spots per sample grouped by niche. c, Proportion of ST spots per MS lesion type and CTRL grouped by niche. d, Jaccard index between manually annotated areas and computationally annotated niches per shared category (top) (n = 6 for WM, n = 11 for LC, n = 9 for GM, n = 2 for EP, n = 12 for PPWM, n = 12 for LR). ST spots belonging to annotation-specific categories were ignored in the calculation. Adjusted Rand index between histopathologically annotated areas and niches annotated in an unsupervised way per ST sample (bottom) (n = 6 for CTRL, n = 8 for MS-CA, n = 4 for MS-CI), values above 0 indicate agreement between annotations. e, Intra-niche and inter-niche pairwise Pearson correlations of normalized pseudobulked gene expression (up) and mean centered log-ratio transformed cell type proportion (bottom) (n = 120 for EP, n = 678 for GM, n = 735 for LC, n = 735 for LR, n = 672 for PPWM, n = 735 for VI, n = 387 for WM) (two-tailed Wilcoxon-rank sum test, BH adjusted P < 0.05). f, IHC staining of blood vessels and perivascular spaces in MS-CA lesions with antibodies against CD3 (TC), CD11B (MC) and CD19 (BC). Scale bar 20µm. g, Mean spatially weighted proportions of neighboring niches for each niche. h, Heatmap of z-scaled expression of top 10 genes (positive and negative scores) per niche based on Spearman correlation corresponding to a spatial trajectory from MS lesion to CTRL white matter (VI-LC-LR-PPWM-WM). i, Mean pathway activity across ST samples grouped by niche. j, Top enriched pathways for genes with a decreased expression along the spatial trajectory. k, Top enriched pathways for genes with an increased expression along the spatial trajectory.
Extended Data Fig. 7
Extended Data Fig. 7. Quality control for ciliated AS.
a, Heatmap of Jaccard indexes between the top 100 marker genes ranked by corrected p-values (Benjamini-Hochberg) of the cell subtypes in this study compared to the subclusters described in the study by Absinta et al., 2021. Asterisks indicate significance of overlap by a one-sided Fisher exact test (Adjusted P < 0.05). b, Heatmap of Pearson correlation between the log-normalized pseudobulked gene expression of our cell subtypes and subclusters from Absinta et al. 2021. Asterisks indicate significance (BH adjusted P < 0.05, r > 0.75). c, Proportion of nuclei per condition grouped by AS subtype. d, ST feature and violin plots for SPAG17 for the two samples containing EP niches: MS11 and MS12 (n = 80 for EP in MS11, n = 3518 for rest in MS11, n = 90 for EP in MS12, n = 2630 for rest in MS12). e, Bar plot shows number of Cilia AS cells per sample. Color indicates condition. f, Violin plots of representative Cilia AS marker genes compared with other AS subtypes for Absinta et al. (n = 951 for Cluster 12, n = 7260 for rest) (two-sided t-test, BH adjusted P < 0.05). g, Quantification of Cilia AS as percentage of total AS population in MS-CI. Ciliated AS were quantified at lesion borders (combination of PPWM and LR) and in lesion core (LC) (n = 8 for Border, n = 4 for LC). h, Quantification of Cilia AS density in MS-CA and MS-CI (n = 14 for Border in MS-CA, n = 7 for LC in MS-CA, n = 8 for Border in MS-CI, n = 4 for LC in MS-CI) (two-sided Wilcoxon rank-sum test, BH adjusted P < 0.05). i, Cilium assembly pathway activity score for spots containing Cilia AS. Box and Violin plots illustrate the median (represented by the white dot), the 25th percentile (Q1), and the 75th percentile (Q3), with the ends of the black box indicating Q1 and Q3; the whiskers extend to the furthest datapoint within 1.5 times the interquartile range (IQR), specifically 1.5 * (Q3 - Q1), beyond Q3 or below Q1.
Extended Data Fig. 8
Extended Data Fig. 8. Aggregated multidimensional scaling.
a, Summary statistics of the multicellular factor analysis model (MOFAcellulaR) for snRNA-seq. In the left heatmaps, the lower panel shows the hierarchical clustering of the factor scores for the samples in the study. Patient and sample metrics data and lesion type are indicated in each row. Center panel shows the -log10(adj. p-values) of testing for associations between the factor scores and if they were MS or CTRL (Dis), lesion type (Les), Sex, Age, RIN, and technical batch (ANOVA). The upper panel shows the percentage of explained variance of each cell type expression matrix recovered by the factor. Right box plots visualize distribution of Factor 1 and 4 scores between CTRL and MS lesion types (n = 6 for CTRL, n = 6 for MS-CA, n = 4 for MS-CI). b, Summary statistics of MOFAcellular for ST data of MS samples. Left heatmaps show factor scores, associations with lesion type, sex, age, and duration, and percentage of explained variance for each spatial niche, as described in b. Right box plots visualize distribution of Factor 3 between MS lesion types (n = 8 for MS-CA, n = 4 for MS-CI). c, MDS computed on distances at the snRNA-seq cell type proportion level. d, MDS computed on distances at the ST deconvoluted cell type proportion level. e, MDS computed on distances at the snRNA-seq cell subtype proportion level. f, MDS computed on distances at the snRNA-seq MOFAcellulaR factor level. g, MDS computed on distances at the ST MOFAcellulaR factor level. h, MDS computed on distances at the aggregated distances across all levels. Color indicates CTRL and MS lesion type. Text indicates sample ID. i, Distribution of silhouette coefficient for each sample grouped by level (n = 16 for snRNA-seq prop, n = 16 for Cell state prop, n = 18 for ST prop, n = 16 for snRNA-seq MOFA, n = 12 for ST MOFA, n = 15 for total). Box plots illustrate the median (represented by the white dot), the 25th percentile (Q1), and the 75th percentile (Q3), with the ends of the black box indicating Q1 and Q3; the whiskers extend to the furthest datapoint within 1.5 times the interquartile range (IQR), specifically 1.5 * (Q3 - Q1), beyond Q3 or below Q1.
Extended Data Fig. 9
Extended Data Fig. 9. Extended comparisons between CTRL and MS samples.
a, b, c, Volcano plot of DEGs from OL, AS and MC for the contrast CTRL vs MS-CA, CTRL vs MS-CI and MS-CA vs MS-CI, respectively. Color indicates association to a condition. d, Dot plot of enriched pathways for DEGs of OL, AS and MC, grouped by condition. e, f, Remaining cell type and subtype compositional changes across conditions, respectively (n = 6 for CTRL, n = 6 for MS-CA, n = 4 for MS-CI) (two-tailed Wilcoxon rank-sum test, BH adjusted P < 0.10). g, Volcano plot of DEGs for PPWM and LC niches, respectively. Color indicates association to an MS lesion type. Violin plots illustrate the median (represented by the white dot), the 25th percentile (Q1), and the 75th percentile (Q3), with the ends of the black box indicating Q1 and Q3; the whiskers extend to the furthest datapoint within 1.5 times the interquartile range (IQR), specifically 1.5 * (Q3 - Q1), beyond Q3 or below Q1.
Extended Data Fig. 10
Extended Data Fig. 10. Characterization of differential cell-cell communication events.
a, Number of cell-cell interactions obtained at each step of the pipeline. b, c, d, Individual cell-cell network structures. Edge size indicates number of interactions. Color indicates condition. e, Heatmap showing multicellular ligand-receptor interactions. Numbers indicate the number of cell type pairs. Color indicates association to MS lesion type. f, smFISH of CTRL samples shwoing cell-cell interaction events between ADCY2 (AS), CD163/TLR2 (MC) and HMGB1 (ligand). g, Barplot of CD14 (ligand) and ITGB1 (receptor) in MC across the different conditions (left, center respectively). Box xfplot showing cell-cell interactions scores between ligand-receptor together with predicted ST mapping of the interaction (right) (two-tailed Wald test for gene expression, BH adjusted P < 0.05, n = 6 for CTRL, n = 6 for MS-CA, n = 4 for MS-CI; two-tailed Wilcoxon rank-sum test for interaction scores, BH adjusted P < 0.10, n = 6 for CTRL, n = 8 for MS-CA, n = 4 for MS-CI). h, smFISH of CTRL samples showing cell-cell interaction events between VWF (EC), ADCY2 (AS), CD14 (MC) and ITGB1 (receptor). i, Pearson correlations between interaction spatial local scores and spatial pathway activities per ST sample, grouped by pathway (n = 18 per pathway). (Scale bars in f and h: 20µm.). Box plots illustrate the median (represented by the white dot), the 25th percentile (Q1), and the 75th percentile (Q3), with the ends of the black box indicating Q1 and Q3; the whiskers extend to the furthest datapoint within 1.5 times the interquartile range (IQR), specifically 1.5 * (Q3 - Q1), beyond Q3 or below Q1.

References

    1. Trobisch, T. et al. Cross-regional homeostatic and reactive glial signatures in multiple sclerosis. Acta Neuropathol.144, 987–1003 (2022). - PMC - PubMed
    1. Haider, L. et al. The topograpy of demyelination and neurodegeneration in the multiple sclerosis brain. Brain139, 807–815 (2016). - PMC - PubMed
    1. Reich, D. S., Lucchinetti, C. F. & Calabresi, P. A. Multiple sclerosis. N. Engl. J. Med.378, 169–180 (2018). - PMC - PubMed
    1. Machado-Santos, J. et al. The compartmentalized inflammatory response in the multiple sclerosis brain is composed of tissue-resident CD8+ T lymphocytes and B cells. Brain141, 2066–2082 (2018). - PMC - PubMed
    1. Absinta, M. et al. A lymphocyte-microglia-astrocyte axis in chronic active multiple sclerosis. Nature597, 709–714 (2021). - PMC - PubMed