. 2024 Nov 5;14(1):26737.
doi: 10.1038/s41598-024-78150-7.

A novel immunomodulating peptide with potential to complement oligodeoxynucleotide-mediated adjuvanticity in vaccination strategies

Affiliations

A novel immunomodulating peptide with potential to complement oligodeoxynucleotide-mediated adjuvanticity in vaccination strategies

Michael Agrez et al. Sci Rep. .

Abstract

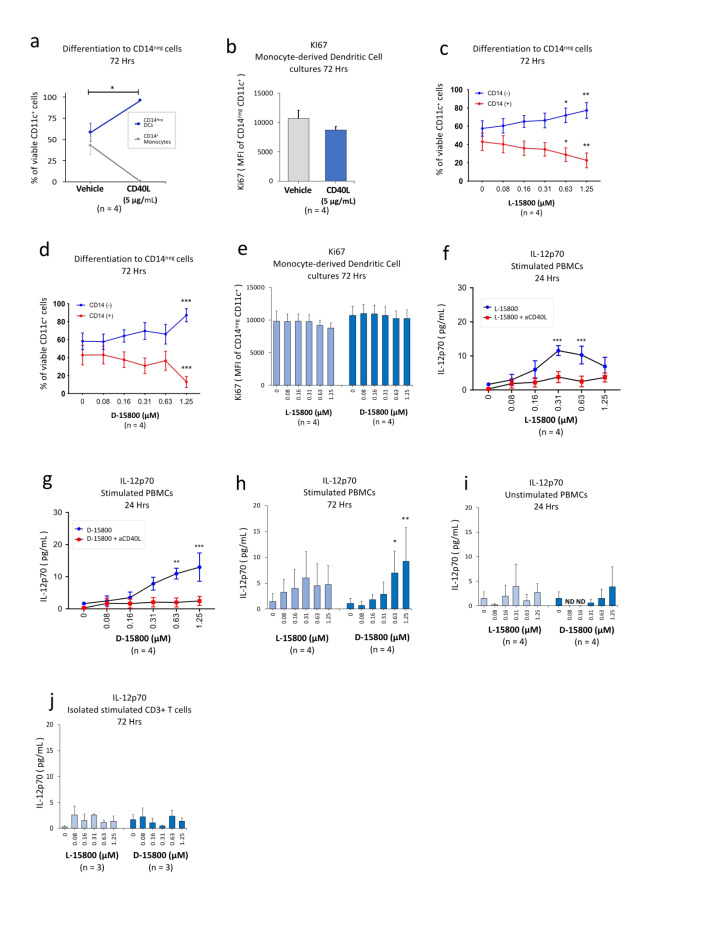
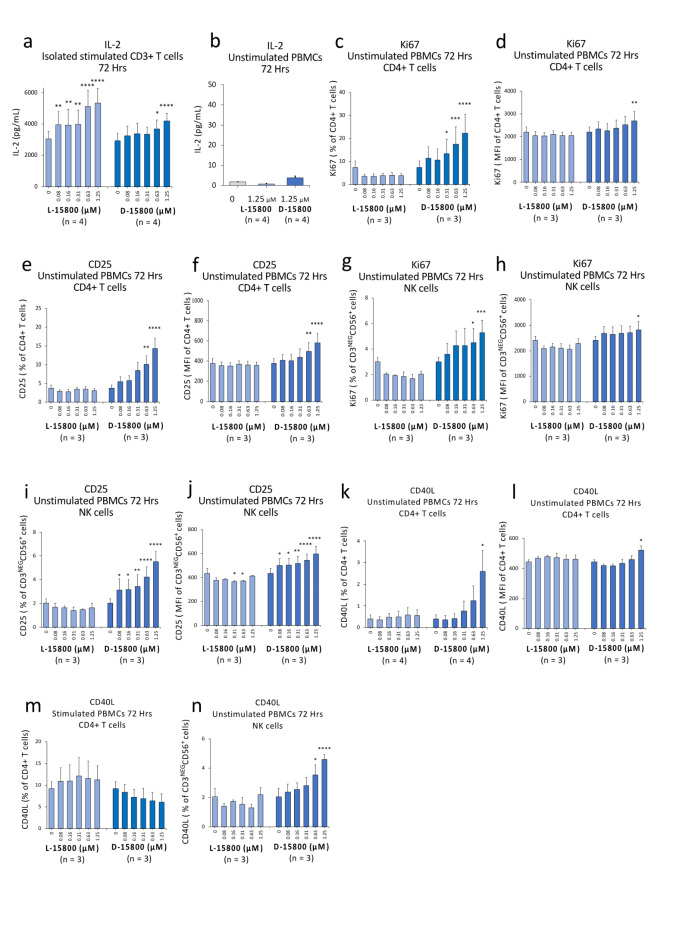
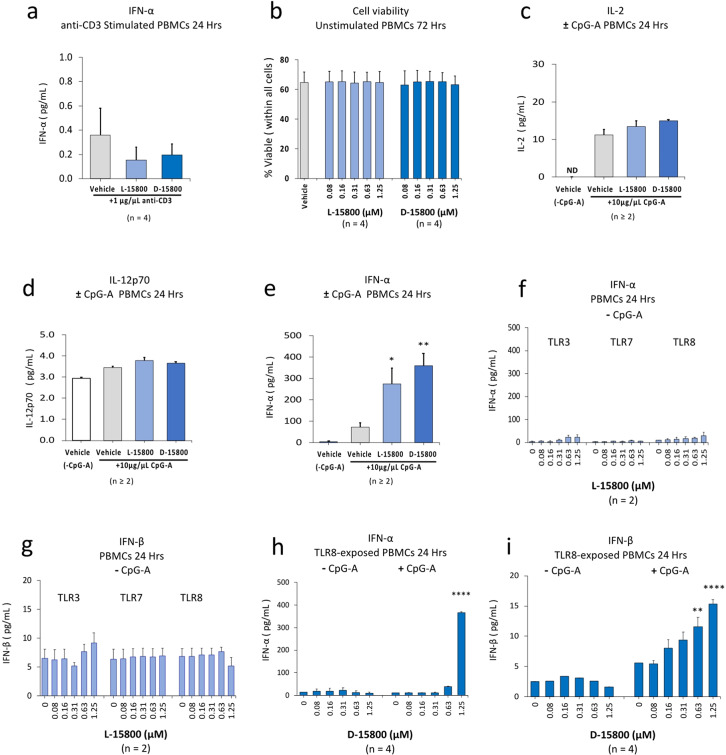
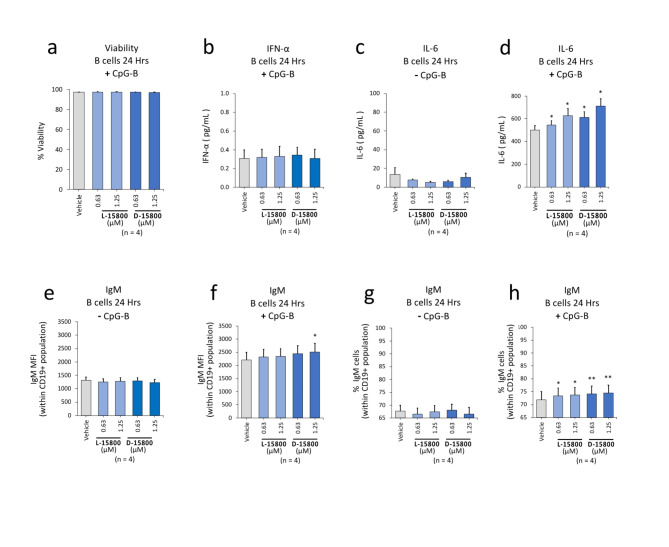
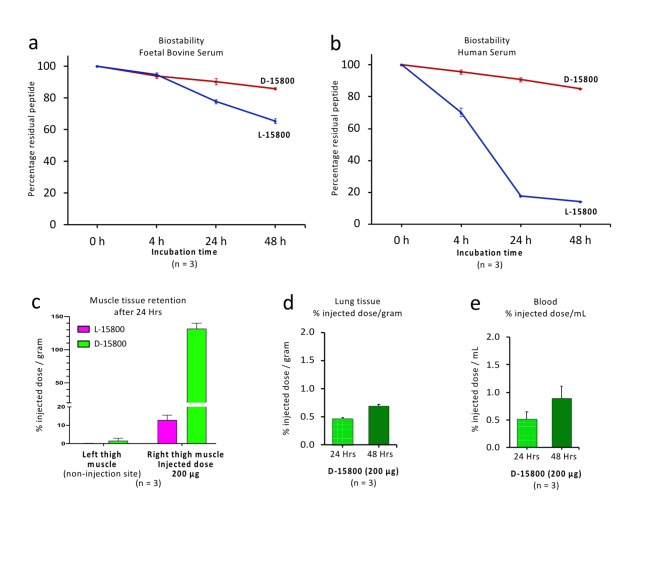
The identification of adjuvants to improve vaccination efficacy is a major unmet need. One approach is to augment the functionality of dendritic cells (DCs) by using Toll-like receptor-9 (TLR9) agonists such as cytosine-phosphate-guanine oligodeoxynucleotides (CpG ODNs) as adjuvants. Another approach is adjuvant selection based on production of bioactive interleukin-12 (IL-12). We report a D-peptide isomer, designated D-15800, that induces monocyte differentiation to the DC phenotype in vitro and more effectively stimulates IL-12p70 production upon T cell receptor (TCR) activation than the L-isomer. In the absence of TCR activation and either IL-12p70 or interleukin-2 production, only D-15800 activates CD4+ T and natural killer cells. In the presence of CpG ODN, D-15800 synergistically enhances production of interferon-alpha (IFN-α). Taken together with its biostability in human serum and depot retention upon injection, co-delivery of D-15800 with TLR9 agonists could serve to improve vaccine efficacy.


Conflict of interest statement

The authors M.A. and S.P. declare competing financial interest as Executive Directors of InterK Peptide Therapeutics Limited. The remaining authors do not have any competing interests.

Figures

Fig. 1
Fig. 1
D-15800 promotes stabilisation of the DC phenotype and induces production of IL-12. Buffy coat samples were obtained from human volunteers following ethics approval. Isolated CD3+ T cell cultures were stimulated with anti-CD3/anti-CD28 Dynabeads and PBMC cultures were either stimulated with anti-CD3 antibody or left unstimulated. Monocyte-derived DCs (moDCs) were prepared as described in the “Methods”. Culture durations were either 24 h or 72 h as indicated above each panel. Each tissue culture experiment was performed using triplicate wells (technical replicates). Flow cytometry for Ki67 estimation (proliferative capacity) and ELISA experiments for assessment of IL-12p70 (pg/mL) within culture supernatants were repeated either three or four times (n = experimental replicates) as indicated below each panel. All error bars represent standard error of the mean (SEM) and the effects of the L-/D-isomers compared in all experiments. Differentiation of CD14+ cells to CD14neg moDCs was assessed in isolated moDC cultures exposed to recombinant rCD40L (rCD40L; 5 µg/mL) and in TCR-activated PBMC cultures exposed to L-/D-isomers in the absence/presence of neutralising anti-CD40L antibody (5 µg/mL). Flow cytometry data for Ki67 are shown as mean fluorescence intensity (MFI) and dot plots/gating strategies indicated in Supplementary Figs. S1-S3. (a) Differentiation of cells within moDC cultures to CD14neg cells in the presence of rCD40L after 72 h. (b) Ki67 expression in CD14neg cells within moDC cultures exposed to rCD40L after 72 h. (c) Differentiation to CD14neg cells in isolated moDC cultures exposed to L-15800 in the absence/presence of anti-CD40L antibody after 72 h. (d) Differentiation to CD14neg cells in isolated moDC cultures exposed to D-15800 in the absence/presence of anti-CD40L antibody after 72 h. (e) Ki67 expression in CD14neg cells within moDC cultures exposed to the L-/D-isomers for 72 h. (f) IL-12p70 production by TCR-stimulated PBMCs exposed to L-15800 in the absence/presence of anti-CD40L antibody after 24 h. (g) IL-12p70 production by TCR-stimulated PBMCs exposed to D-15800 in the absence/presence of anti-CD40L antibody after 24 h. (h) IL-12p70 production by TCR-stimulated PBMCs exposed to the L-/D-isomers for 72 h. (i) IL-12p70 production by non-TCR-stimulated PBMCs exposed to the L-/D-isomers for 24 h. (j) IL-12p70 production by TCR-stimulated CD3+ T cells exposed to the L-/D-isomers for 72 h. Data for moDC cultures exposed to rCD40L were analysed by paired t-test (a,b). Data for moDC/PBMC/T cell cultures were analysed by means of either two-way ANOVA with Dunnett’s post-test comparing each peptide concentration with vehicle control (ce, hj) or two-way ANOVA with Sidak’s post-test comparing peptide treatment alone with peptide plus anti-CD40L antibody (f, g). *P < 0.05, **P < 0.01, ***P < 0.001, ****P < 0.0001.
Fig. 2
Fig. 2
D-15800 enhances CD25/CD40L expression in CD4 + T/ NK cells including their proliferative capacity. Buffy coat samples were obtained from human volunteers following ethics approval. Isolated CD3+ T cell cultures were stimulated with anti-CD3/anti-CD28 Dynabeads and PBMC cultures either stimulated with anti-CD3 antibody to activate the TCR or left unstimulated. The culture duration in all experiments was 72 h. Each tissue culture experiment was performed using triplicate wells (technical replicates) and cell-based flow cytometry/ELISA experiments were repeated either three or four times (n = experimental replicates) as indicated below each panel. All error bars represent standard error of the mean (SEM) and the effects of the L-isomer (L-15800) and D-isomer (D-15800) compared in all experiments as indicated below each panel. Flow cytometry data are shown as either mean fluorescence intensity (MFI) or percentage values as indicated in the panels and IL-2 production assessed by means of ELISA and expressed as pg/mL. Dot plots and gating strategies are shown in Supplementary Figs. S4-S9. (a) IL-2 levels in supernatant from TCR-stimulated CD3+ T cell cultures as assessed by ELISA. (b) IL-2 levels in supernatant from non-TCR-stimulated PBMC cultures. (c) Percentage of Ki67-expressing CD4+ T cells within unstimulated PBMC cultures. (d) Proliferative capacity of CD4+ T cells as assessed by Ki67 expression (MFI) within unstimulated PBMC cultures. (e) Percentage of CD25-expressing CD4+ T cells within unstimulated PBMC cultures. (f) Expression of CD25 (MFI) in CD4+ T cells within unstimulated PBMC cultures. (g) Percentage of Ki67-expressing NK cells within unstimulated PBMC cultures. (h) Proliferative capacity of NK cells as assessed by Ki67 expression (MFI) within unstimulated PBMC cultures. (i) Percentage of CD25-expressing NK cells within unstimulated PBMC cultures. (j) Expression of CD25 (MFI) in NK cells within unstimulated PBMC cultures. (k) Percentage of CD40L-expressing CD4+ T cells within unstimulated PBMC cultures. (l) Expression of CD40L (MFI) in CD4+ T cells within unstimulated PBMC cultures. (m) Percentage of CD40L-expressing CD4+ T cells within TCR-stimulated PBMC cultures. (n) Percentage of CD40L-expressing NK cells within non-TCR-activated PBMC cultures. Flow cytometry data were analysed by two-way ANOVA with Dunnett’s post-test comparing each peptide concentration with vehicle control (cn). Data for IL-2 production were analysed by either two-way ANOVA with Dunnett’s post-test (a) or one-way ANOVA with Sidak’s post-test (b) comparing peptide isomer effects with vehicle control. *P < 0.05, **P < 0.01, ***P < 0.001, ****P < 0.0001.
Fig. 3
Fig. 3
The D-15800 isomer enhances CpG-A ODN-induced activation of DCs. Viability of non-TCR-activated PBMCs was assessed following exposure to the peptide isomers for 72 h. PBMCs were stimulated with either anti-CD3 antibody only or with Toll-like receptor (TLR) agonists, i.e., TLR 3 (Poly (I: C)), TLR7 (Imiquimod), TLR8 (TL8-506) and TLR9 (CpG-A ODN) for 24 h at a concentration of 10 µg/mL in the absence of TCR activation. PBMCs were exposed to TLR agonists either individually or when combined with CpG-A in the absence/presence of the L-/D-15800 isomers. Production of the cytokines IL-2, IL-12p70 and type I IFNs (IFN-α/β) was assessed by multiplex assay. The peptides were tested at concentrations either in the range of 0.08–1.25 µM or, where the dose is not indicated, only at the highest concentration, i.e., 1.25 µM. Each tissue culture experiment was performed using triplicate wells (technical replicates) and experiments repeated between two and four times because not all donor blood samples responded to TLR agonists (n = experimental replicates indicated below each panel). All error bars represent standard error of the mean (SEM). Dot plots and gating strategy for viability data are shown in the Supplementary Fig. S10. (a) IFN-α produced by anti-CD3-stimulated PBMCs exposed to either L-15800 or D-15800 at a concentration of 1.25 µM. (b) Viability of non-TCR-activated PBMCs exposed to the peptide isomers for 72 h. (c) IL-2 produced by CpG-A-stimulated PBMCs in the absence/presence of L-15800 or D-15800 at a concentration of 1.25 µM (ND = not detected). (d) IL-12p70 produced by CpG-A-stimulated PBMCs in the absence/presence of L-15800 or D-15800 at a concentration of 1.25 µM. (e) IFN-α produced by CpG-A-stimulated PBMCs in the absence/presence of L-15800 or D-15800 at a concentration of 1.25 µM. (f) IFN-α production by PBMCs stimulated with either TLR3, TLR7 or TLR8 agonist and exposed to L-15800 across the concentration range 0.08 µM − 1.25 µM. (g) IFN-β production by PBMCs stimulated with either TLR3, TLR7 or TLR8 agonist and exposed to L-15800 across the concentration range 0.08 µM − 1.25 µM. (h) IFN-α production by PBMCs stimulated either with TLR8 agonist alone or combined with TLR9 agonist and exposed to D-15800 across the concentration range 0.08 µM − 1.25 µM. (i) IFN-β production by PBMCs stimulated either with TLR8 agonist alone or combined with TLR9 agonist and exposed to D-15800 across the concentration range 0.08 µM − 1.25 µM. Data were analysed by one-way ANOVA with Holm-Sidak’s post-test (ac) or Dunnett’s post-test (d) and two-way ANOVA with Dunnett’s post-test (e-h) comparing each peptide concentration with vehicle control. *P < 0.05, **P < 0.01, ****P < 0.0001.
Fig. 4
Fig. 4
The D-15800 isomer enhances activation of B cells in the presence of TLR9 agonist, CpG-B ODN. CD19-expressing B cells were isolated as described in the “Methods” and stimulated with TLR9 agonist (CpG-B ODN; 10 µg/mL) for 24 h either in the absence or presence of the L-/D-isomers. Production of the cytokines IFN-α and IL-6 was assessed by multiplex assay. Flow cytometry data for IgM expression are shown as either mean fluorescence intensity (MFI) or percentage values as indicated in the panels. The CpG-B concentration was 10 µg/mL and the peptides were tested at two concentrations, i.e., 0.63 µM and 1.25 µM, in all experiments as shown in the panels. Each tissue culture experiment was performed using triplicate wells (technical replicates) and experiments repeated four times (n = experimental replicates) as indicated below each panel. All error bars represent standard error of the mean (SEM). Dot plots and gating strategies are shown in the Supplementary Fig. S11. (a) Viability of B cells exposed to either L-15800 or D-15800 combined with CpG-B. (b) IFN-α secreted by CpG-B treated B cells exposed to either L-15800 or D-15800. (c) IL-6 secreted by B cells in the absence of CpG-B and exposed to either L-15800 or D-15800. (d) IL-6 secreted by B cells exposed to either L-15800 or D-15800 plus CpG-B. (e) Surface expression of IgM on B cells exposed to either L-15800 or D-15800 in the absence of CpG-B. (f) Expression level of IgM on B cells stimulated with CpG-B together with either L-15800 or D-15800. (g) Percentage of IgM-expressing B cells exposed to either L-15800 or D-15800 in the absence of CpG-B. (h) Percentage of IgM-expressing B cells treated with CpG-B together with either L-15800 or D-15800. Data were analysed by one-way ANOVA with Dunnett’s post-test comparing each peptide concentration with vehicle control. *P < 0.05, **P < 0.01.
Fig. 5
Fig. 5
The D-15800 isomer is more stable than L-15800 in sera and forms a depot upon injection. The stability of the L-/D-isomers dissolved in either FBS or human serum (1.0 mg/mL net) was determined by means of RP-HPLC over 48 h as described in the “Methods”. RP-HPLC-resolution data are shown in the Supplementary Fig. S12. Depot retention upon intramuscular injection of radiolabelled L-/D-isomers (200 µg) into three mice (n = experimental replicates) was assessed for both the injected thigh muscle and the contralateral thigh at 24 h and D-15800 levels compared within lung tissue and blood at 24 h and 48 h as indicated in the “Methods”. Error bars for all studies represent standard error of the mean (SEM). (a) Stability of the L-/D-isomers in foetal bovine serum over 48 h. (b) Stability of the L-/D-isomers in human serum over 48 h. (c) Percentage of injected dose, i.e., retention of radiolabelled 64Cu L-/D-isomers, in the injected thigh compared with the contralateral thigh after 24 h. (d) Percentage of injected 64Cu-lablelled D-15800 in lung tissue at 24 h and 48 h. (e) Percentage of injected 64Cu-lablelled D-15800 in blood at 24 h and 48 h.

Similar articles

References

    1. Zhao, T. et al. Vaccine adjuvants: mechanisms and platforms. Signal. Transduct. Target. Ther.8, 283 (2023). - PMC - PubMed
    1. Fogel, M., Long, J. A., Thompson, P. J. & Upham, J. W. Dendritic cell maturation and IL-12 synthesis induced by the synthetic immune-response modifier S-28463. J. Leukoc. Biol.72, 932–938 (2002). - PubMed
    1. Kaka, A. S., Foster, A. E., Weiss, H. E., Rooney, C. M. & Leen, A. M. Using dendritic cell maturation and IL-12 producing capacity as markers of function: a cautionary tale. J. Immunother. 31, 359–369 (2008). - PMC - PubMed
    1. Shirota, H. & Klinman, D. M. Recent progress concerning CpG DNA and its use as a vaccine adjuvant. Expert Rev. Vaccines. 13, 299–312 (2014). - PMC - PubMed
    1. Shakhar, G. et al. Stable T cell–dendritic cell interactions precede the development of both tolerance and immunity in vivo. Nat. Immunol.6, 707–714 (2005). - PMC - PubMed

MeSH terms