

Construction and validation of a clinical prediction model for sepsis using peripheral perfusion index to predict in-hospital and 28-day mortality risk
- PMID: 39501076
- PMCID: PMC11538300
- DOI: 10.1038/s41598-024-78408-0
Construction and validation of a clinical prediction model for sepsis using peripheral perfusion index to predict in-hospital and 28-day mortality risk
Abstract
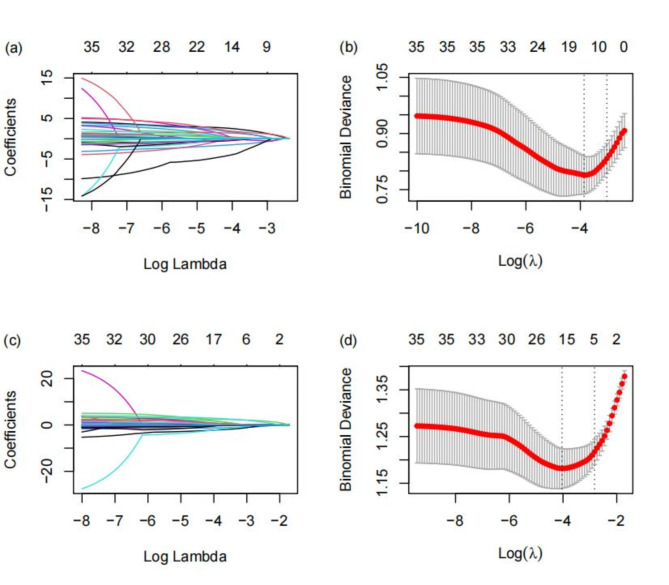
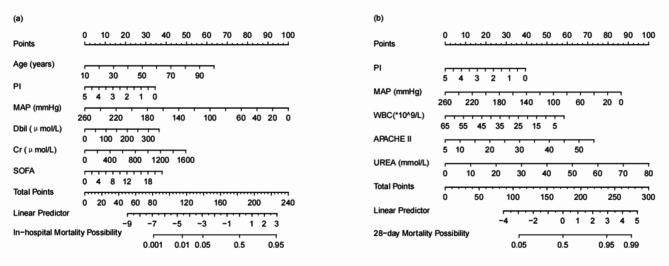
Sepsis is a clinical syndrome caused by infection, leading to organ dysfunction due to a dysregulated host response. In recent years, its high mortality rate has made it a significant cause of death and disability worldwide. The pathophysiological process of sepsis is related to the body's dysregulated response to infection, with microcirculatory changes serving as early warning signals that guide clinical treatment. The Peripheral Perfusion Index (PI), as an indicator of peripheral microcirculation, can effectively evaluate patient prognosis. This study aims to develop two new prediction models using PI and other common clinical indicators to assess the mortality risk of sepsis patients during hospitalization and within 28 days post-ICU admission. This retrospective study analyzed data from sepsis patients treated in the Intensive Care Unit of Peking Union Medical College Hospital between December 2019 and June 2023, ultimately including 645 patients. LASSO regression and logistic regression analyses were used to select predictive factors from 35 clinical indicators, and two clinical prediction models were constructed to predict in-hospital mortality and 28-day mortality. The models' performance was then evaluated using ROC curve, calibration curve, and decision curve analyses. The two prediction models performed excellently in distinguishing patient mortality risk. The AUC for the in-hospital mortality prediction model was 0.82 in the training set and 0.73 in the validation set; for the 28-day mortality prediction model, the AUC was 0.79 in the training set and 0.73 in the validation set. The calibration curves closely aligned with the ideal line, indicating consistency between predicted and actual outcomes. Decision curve analysis also demonstrated high net benefits for the clinical utility of both models. The study shows that these two prediction models not only perform excellently statistically but also hold high practical value in clinical applications. The models can help physicians accurately assess the mortality risk of sepsis patients, providing a scientific basis for personalized treatment.
Keywords: 28-day mortality; Clinical prediction model; In-hospital mortality; LASSO regression; Peripheral perfusion index (PI); Sepsis.
© 2024. The Author(s).
Conflict of interest statement
The authors declare no competing interests.
Figures
Similar articles
-
[Analysis of 28 day-mortality risk factors in sepsis patients and construction and validation of predictive model].Zhonghua Wei Zhong Bing Ji Jiu Yi Xue. 2024 May;36(5):478-484. doi: 10.3760/cma.j.cn121430-20231109-00961. Zhonghua Wei Zhong Bing Ji Jiu Yi Xue. 2024. PMID: 38845493 Chinese.
-
[Development and validation of a prognostic model for patients with sepsis in intensive care unit].Zhonghua Wei Zhong Bing Ji Jiu Yi Xue. 2023 Aug;35(8):800-806. doi: 10.3760/cma.j.cn121430-20230103-00003. Zhonghua Wei Zhong Bing Ji Jiu Yi Xue. 2023. PMID: 37593856 Chinese.
-
[Construction and validation of a predictive model for early occurrence of lower extremity deep venous thrombosis in ICU patients with sepsis].Zhonghua Wei Zhong Bing Ji Jiu Yi Xue. 2024 May;36(5):471-477. doi: 10.3760/cma.j.cn121430-20231117-00985. Zhonghua Wei Zhong Bing Ji Jiu Yi Xue. 2024. PMID: 38845492 Chinese.
-
Construction and Validation of an Early Warning Model for Predicting the 28-Day Mortality in Sepsis Patients with Chronic Obstructive Pulmonary Disease.Int J Chron Obstruct Pulmon Dis. 2025 May 6;20:1373-1385. doi: 10.2147/COPD.S521816. eCollection 2025. Int J Chron Obstruct Pulmon Dis. 2025. PMID: 40352361 Free PMC article.
-
[Construction of a predictive model for in-hospital mortality of sepsis patients in intensive care unit based on machine learning].Zhonghua Wei Zhong Bing Ji Jiu Yi Xue. 2023 Jul;35(7):696-701. doi: 10.3760/cma.j.cn121430-20221219-01104. Zhonghua Wei Zhong Bing Ji Jiu Yi Xue. 2023. PMID: 37545445 Chinese.
Cited by
-
Predicting prognosis of sepsis in patients based on right ventricular strain imaging development and validation of a nomogram model.Front Cardiovasc Med. 2025 Jun 4;12:1532674. doi: 10.3389/fcvm.2025.1532674. eCollection 2025. Front Cardiovasc Med. 2025. PMID: 40535148 Free PMC article.
References
Publication types
MeSH terms
Grants and funding
LinkOut - more resources
Full Text Sources
Medical
Research Materials
Miscellaneous
