. 2024 Nov;56(11):2538-2550.
doi: 10.1038/s41588-024-01957-7. Epub 2024 Nov 5.

Structural variation reshapes population gene expression and trait variation in 2,105 Brassica napus accessions

Affiliations

Structural variation reshapes population gene expression and trait variation in 2,105 Brassica napus accessions

Yuanyuan Zhang et al. Nat Genet. 2024 Nov.

Abstract

Although individual genomic structural variants (SVs) are known to influence gene expression and trait variation, the extent and scale of SV impact across a species remain unknown. In the present study, we constructed a reference library of 334,461 SVs from genome assemblies of 16 representative morphotypes of neopolyploid Brassica napus accessions and detected 258,865 SVs in 2,105 resequenced genomes. Coupling with 5 tissue population transcriptomes, we uncovered 285,976 SV-expression quantitative trait loci (eQTLs) that associate with altered expression of 73,580 genes. We developed a pipeline for the high-throughput joint analyses of SV-genome-wide association studies (SV-GWASs) and transcriptome-wide association studies of phenomic data, eQTLs and eQTL-GWAS colocalization, and identified 726 SV-gene expression-trait variation associations, some of which were verified by transgenics. The pervasive SV impact on how SV reshapes trait variation was demonstrated with the glucosinolate biosynthesis and transport pathway. The study highlighting the impact of genome-wide and species-scale SVs provides a powerful methodological strategy and valuable resources for studying evolution, gene discovery and breeding.


Conflict of interest statement

The authors declare no competing interests.

Figures
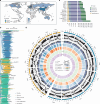
Fig. 1
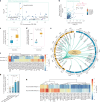
Fig. 1. Identification and characterization of the B. napus pan-SV.
a, Geographic distribution of 2,105 B. napus accessions that were sequenced. The map was created using the map data function in the ggplot2 package. b, Phylogenetic analysis of 2,105 accessions based on SNPs. Line colors represent three rapeseed ecotypes, another two botanical varieties (var. pabularia and var. napobrassica) and resynthetics developed from hybridization between B. rapa and B. oleracea. The 16 representative B. napus accessions, including one rutabaga (swede) root fodder (Laurentian) and one resynthetic (No2127) for de novo assembling are indicated as black lines. c, The SV types and numbers of the 15 B. napus genome assemblies based on the reference cv. ZS11 genome. In b and c, ZS11 is for Zhongshuang11, ZS9 for Zhongshuang9, ZY821 for Zhongyou821 and ZY7 for Zheyou7. d, Distribution feature of SVs from 2,105 B. napus accessions. Different tracks (i–vii) indicate the densities of genes, TE and GC content (i–iii) or abundance of SVs (iv–vii).
Fig. 2
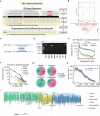
Fig. 2. SV impact on gene expression and its regulatory mechanisms.
a, Overview of the study of SV impact on gene expression and trait variation. The number of accessions for each RNA-seq tissue are shown in parentheses. b, Heatscatter plot showing the genome-wide distribution of SV-eQTLs. Each dot represents a lead eSV and eGene association. The pink dots along the diagonal represent those for cis-lead eSVs. c,d, Relationships between the numbers of lead eSVs (c) and eGenes (d). e,f, The number and proportion of lead eSVs (e) and eGenes (f) in cis- and trans-eQTLs in An and Cn subgenomes. g, Distribution of 495 trans-eQTL hotspots and their eGenes. The emanative bars stand for hotspots and their height for the number of eGenes in the mid-circle (i), of which each eSV and its eGene(s) in trans-eQTLs are connected by gray lines (ii) and specifically the green lines for the trans-eQTL Hotspot-197 that was studied in Extended Data Fig. 6. h, The number and proportion of eSVs sorted in terms of their regulatory mechanisms. Each pie chart at the right of each column indicates the ratio of eSVs to all annotated SVs in each category. i, Gene expression variance explained by cis- and trans-eQTLs in individual categories of regulatory mechanisms. All P values are based on the two-tailed Wilcoxon’s rank-sum tests. The horizontal lines within boxes represent median value, the bottom and top edges of the boxes the 25th (***P value almost 0) and 75th percentile values and the lower and upper whiskers showing the 5th and 95th percentile values (the same for all other boxplots). The number (n) under the box represents the corresponding number of samples in each group.
Fig. 3
Fig. 3. Networks illustrating causal SV–gene expression–trait variation association integrated from the data of SV-eQTLs, SV-GWASs and TWASs.
See Supplementary Tables 14 and 18 for more details.
Fig. 4
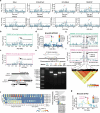
Fig. 4. An insertion repressing downstream gene expression.
a,b, Manhattan plots presenting composite SV-GWAS loci of the individual and total glucosinolate contents in leaves (a) and seeds (b). The red dots indicate significant associations and the blue-and-red heatmap above the x axis shows density of the genes orthologous to Arabidopsis glucosinolate pathway genes. c, Local Manhattan plot of TWASs showing a significant association between 5C-glucosinolate (glucosinolate with a five-carbon side-chain) content and the gene expression level of BnaA03.MAMf. Each dot represents a gene and the yellow square is a significantly associated eGene. d, Colocalization analysis of the loci of an eQTL regulating BnaA03.MAMf expression (x axis) and GWAS of 5C:(4C + 5C) ratio (y axis) in leaves. The black PPH4 (0.99) indicates the posterior probability of colocalization, whereas the pink PPH4 (0.76) is the posterior probability of the causal variant shared by GWAS and eQTL. Each dot is an SV, and the color bar indicates LD (r2). In ad, the gray dashed lines represent Bonferroni’s corrected significance threshold (two sided) for GWASs (P = 1.82 × 10−5) (a and b), TWASs (P = 1.65 × 10−5) (c), eQTLs (vertical, P = 1.83 × 10−5) and GWASs (horizontal, P = 1.82 × 10−5) of colocalization analysis (d). e, Diagram showing a 1,454-bp insertion at 990 bp upstream of BnaA03.MAMf in a cis-eQTL. fh, Population allelic variation in BnaA03.MAMf expression level (f), 4C:(4C + 5C) ratio (g) and 5C:(4C + 5C) ratio (h) between the accessions with (n = 132) and without (n = 21) the 1,454-bp insertion. For the legends of boxplots and P values, see Fig. 2i. ik, Characterization of three independent transgenic lines showing the relative expression level of BnaA03.MAMf (i), 5C:(4C + 5C) ratios (j) and aphid proliferation assay (k). HTR-2 (with the 1,454-bp insertion, WT) was transformed with a construct containing the native promoter sequence of BnaA03.MAMf without the insertion and HTR-2 CDS. Data are shown as mean ± s.e. P values indicate the significance of differences across each of three transgenic lines and the control, determined by two-tailed Student’s t-tests. The number (n) in each column represents biological replicates.
Fig. 5
Fig. 5. Insertion effect originated from a harbored TF gene.
a, Local Manhattan plot of TWASs showing a significantly associated locus between gene expression and total leaf aliphatic glucosinolate content. The vertical dashed lines indicate the physical position of a 41.6-kb insertion harboring BnaA09.MYB28. b, Colocalization analysis of the eQTL regulating BnaA09.MYB28 expression (x axis) and the GWAS QTL of total leaf aliphatic glucosinolate content (y axis). The dashed lines represent Bonferroni’s corrected significance thresholds that were set at P = 1.68 × 10−5 for TWAS (a) and P = 1.82 × 10−5 for GWAS (horizontal) and P = 1.80 × 10−5 for eQTL (vertical) of colocalization analysis (b); all P values are from two-sided tests. c,d, Population allelic variation in leaf (c) and seed (d) glucosinolate contents between the accessions with (n = 34) and without (n = 117) the 41.6-kb insertion. For the legends of boxplots and P values, see Fig. 2i. e,f, Genomic distribution (e) and expression patterns (f) of 36 glucosinolate biosynthesis genes regulated by the 41.6-kb insertion carrying BnaA09.MYB28. In e, local Manhattan plots of eQTLs of the 36 genes are presented in Supplementary Note 7 and, in f, n = 117 accessions are without the insertion and n = 34 with the insertion. g, Comparison of total seed aliphatic glucosinolate contents of NILs and their recurrent parent line ZS4 without the insertion and donor parent line H59 but with the insertion carrying BnaA09.MYB28. Each error bar is mean ± s.d. Statistical significance (P value) was determined using the two-tailed Wilcoxon’s rank-sum test. The number (n) at the bottom of each column represents the number of samples. h, Expression patterns of genes putatively regulated by the 41.6-kb insertion harboring BnaA09.MYB28 in aliphatic glucosinolate biosynthesis in NILs in the presence (+) or absence (−) of BnaA09.MYB28. FW, fresh weight.
Fig. 6
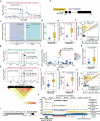
Fig. 6. Insertion effect originated from its enhancer elements.
a, Local Manhattan plot of TWASs showing a significantly associated locus between total seed glucosinolate content and gene expression in developing seeds at 40 d.a.p. b, Colocalization analysis of the eQTL regulating BnaC02.GTR2 expression in seeds at 40 d.a.p. (x axis) and the GWAS QTL of total seed glucosinolate contents (y axis). The dashed lines represent Bonferroni’s corrected significance thresholds that were set at P = 1.51 × 10−5 for TWAS (a) and P = 1.82 × 10−5 for GWAS (horizontal) and P = 1.83 × 10−5 for eQTL (vertical) of the colocalization analysis (b); all P values are from two-sided tests. c, Diagram showing a 7,365-bp insertion upstream of BnaC02.GTR2 in a cis-eQTL. d, BnaC02.GTR2 expression pattern in ZY821 with the insertion and ZS11 without the insertion. L, leaves; R, roots. e,f, Allelic variation in BnaC02.GTR2 expression levels (e) and seed glucosinolate contents (f) between the accessions with (n = 58) and without (n = 196) the insertion. For the legends of boxplots and P values, see Fig. 2i. g, Correlation between seed glucosinolate contents and expression levels of BnaC02.GTR2 in developing seeds at 40 d.a.p. The correlation scatter plot shows best fit linear regression line (orange) with 95% confidence intervals (gray). The r is Pearson’s correlation coefficient with the two-tailed test. hk, An enhancer-contained insertion that spatially interacts with target genes for enhanced expression, resulting in glucosinolate content variation. h, The enhance–promoter interactions (curves) inferred from Hi-C-captured chromatin folding/interactions by comparing ZY821 and ZS11. i,j, Enrichments of open chromatin regions (ATAC–seq) (i) and histone modifications (H3K27ac) (j) in the enhancer and its flanking regions. Short brown vertical lines indicate the peaks from ATAC–seq and ChIP–seq data. The bottom panel shows the annotated genes in this region and upregulated genes in the insertion-present accession ZY821 are marked in pink (h and k). k, Comparison of expression level of genes in the enhancer function region. Each dot represents a gene. Color of dot is same as gene’s color in the bottom of (h). l, Models showing the interaction of the enhancer-contained insertion with target genes. The brown line indicates the chromosome. The pink and green segments represent the enhancer and target genes (GTR2), respectively.
Fig. 7
Fig. 7. A landscape of SVs affecting glucosinolate biosynthesis and transport and its application for breeding.
a,b, The eSV haplotype alleles and corresponding key gene expression levels determining glucosinolate biosynthesis and transport. H (yellow) and L (blue) indicate the alleles for high or low aliphatic (a) or indolic (b) glucosinolate contents. For the legends of boxplots and P values, see Fig. 2i. c, Nine eSV haplotypes representing different contents of leaf and seed total glucosinolates. Data are represented as mean ± s.e. Statistical significance (P value) was determined using two-tailed Wilcoxon’s rank-sum test. d,e, A model of eSVs regulating cis and trans effects on gene expression of the glucosinolate biosynthesis and transport pathway. The regulatory modes of key gene expression (d) is mapped to the glucosinolate biosynthesis pathway (orange shadings) shown in an enlarged leaf (e). For simplicity, the pathway is shown only in a leaf and not in a silique which is also a major source for biosynthesis. The orange arrows stand for glucosinolate transport paths to seeds for accumulation and the circular arrows for glucosinolate transport in siliques. The pathway construction was based on previous publications,,. f, Leaf and seed glucosinolate contents in WT and BnaA09.GTR2-edited lines. For the legends of boxplots, see Fig. 2i. P values show the significance of differences between each transgenic line (three kinds of blue boxes) and WT (gray box) in the two-tailed Student’s t-tests (n = 6 biologically independent samples for each group). In b and c, for the detailed data of the number of samples (n) and P values, see Supplementary Table 21.
Extended Data Fig. 1
Extended Data Fig. 1. Construction and characterization of the B. napus panSV genome.
(a) Overview of SV analysis workflow for panSV construction. #1, #2, #3 and up to 15 accessions in step 1 and 2 indicate accession genomes. (b) A demonstration of a large inversion with 26.67 Mb in length detected between ZS11 and ZY821 by genome assembly alignment (top) and Hi-C contact maps (bottom). (c, d) Verification of the large inversion by PCR amplification of its break point. PCR primers for ZS11 and ZY821 are indicated as corresponding color arrows in schematic diagram (c) and gel electrophoresis plot (d). The experiments were repeated three times with similar results. (e) Relationship between the frequency and the number of SVs in 2,105 accessions (bin width is 100 bp). (f) Relationship between size and the number of SVs in the 2,105 accessions (bin width is 100 bp). (g) The numbers and ratios of SVs with different sizes. (h) Correlation between SV number and distance of SVs to chromosome arm ends. For each SV, the distance was calculated and divided into 500-kb bins. r is Pearson correlation coefficient. P value was calculated using F test for the linear regression model with two-tailed test. Here, the observed value of P value is almost zero. (i) Phylogenetic analysis of 2,105 B. napus accessions based on SVs. The 16 assembled accessions are indicated as black lines. Source data
Extended Data Fig. 2
Extended Data Fig. 2. Lead eSV distance to eGenes, the difference in gene expression variance between cis-eQTL and trans-eQTL and effects of 1,454-bp insertion on short-chain glucosinolates.
(a) Distribution of distance (<100 kb) between lead eSVs in eQTLs and corresponding eGenes. (b) Gene expression (as a phenotype) variance explained by cis-eQTLs (n = 66,003) and trans-eQTLs (n = 219,973). The violin plots show the distribution density, and the box plots show the distribution quantiles. Here, the observed value of P value is almost zero. (c) Accumulated effect of multiple lead eSVs on gene expression. The dots within boxes represent average values. (n = 33,609, 45,855, 46,349, 39,636, 29,220 and 59,368 for six groups, respectively.) (d, e) Local Manhattan plots of SV-GWAS for the ratios of 4C/(4C + 5C) (d) and 5C/(4C + 5C) (e), both represent the side-chain 4C and 5C aliphatic glucosinolates in leaves. Deep blue dots represent SVs; red triangles indicate causal SV (1,454-bp insertion) in the promoter of BnaA03.MAMf. The gray dashed line represents the Bonferroni-corrected significance threshold (two-sided P = 1.82 × 10−5). (f) Local Manhattan plot of eQTL on BnaA03.MAMf expression. Each dot stands for an SV and pink square for the causal SV significantly associated with expression of BnaA03.MAMf. The gray dashed line represents the Bonferroni-corrected significance threshold (two-sided P = 1.86 × 10−5). The color bar indicates linkage disequilibrium (r2). (g) Identification of the 1,454-bp insertion located in the promoter region of BnaA03.MAMf through assembled genome comparison (top) and long-read alignment (bottom). In (b, c), see Fig. 2i for the legends of boxplots and P values.
Extended Data Fig. 3
Extended Data Fig. 3. The additional evidence of eSV case studies in Figs. 5 and 6.
(ac) Local Manhattan plots of SV-GWAS for 8 kinds of leaf aliphatic glucosinolate contents (a), total leaf (b) and seed (c, top) glucosinolate contents on chromosome A09. See Supplementary Table 14 for glucosinolate abbreviations. The bottom of (c) shows the 41.6-kb insertion leading to the present/absent of BnaA09.MYB28 in different accessions. (d) Local Manhattan plot of eQTL of BnaA09.MYB28 expression. (e) PCR amplification to verify the break point of the insertion. PCR primers for ZY7 and ZY821, both with the insertion, and ZS11 without the insertion are indicated as corresponding color arrows. The experiments were repeated three times with similar results. (f) Expression patterns and statistics of all BnaMYB28 family members in low (ZS11) and high (ZY821) glucosinolate accessions. L: leaves; R: roots; DAP: days after pollination. The box plots (right part) show the statistics of the expression levels of each BnaMYB28 from 22 tissues in ZY821. P values show the significance of differences between the expression level of BnaA09.MYB28 and that of each of other BnaMYB28s in the two-tailed paired t tests. (g, h) Local Manhattan plots of SV-GWAS of the leaf (g) and seed (h, top) glucosinolate contents. In the bottom of (h), the red triangle represents the causal SV locating together with BnaGTR2.C02 in the same LD block which separates (vertical dash lines) from the other LD block with BnaC02.MYB28. (i) Local Manhattan plot of eQTL of BnaC02.GTR2 expression. In (ac) and (g, h), see Extended Data Fig. 2d for the legends. The gray dashed line represents the Bonferroni-corrected significance threshold for GWAS (two-sided P = 1.82 × 10−5). In (d) and (i), see Extended Data Fig. 2f for the legends. The gray dashed line represents the Bonferroni-corrected significance threshold for eQTL (two-sided P = 1.80 × 10−5 for BnaA09.MYB28 and two-sided P = 1.83 × 10−5 for BnaC02.GTR2). In (f) and (n), see Fig. 6g for the legends of statistical test and P value. Source data
Extended Data Fig. 4
Extended Data Fig. 4. Identification of two insertions/deletions that play contrast roles in regulating the expression of the other two BnaMYB28s and contents of glucosinolates.
(a) Local Manhattan plot of SV-GWAS of seed glucosinolate contents highlighting a significantly associated 901-bp SV. (b) Diagram showing the 901-bp insertion at the upstream of BnaC02.MYB28 in a cis-eQTL. (c) BnaC02.MYB28 expression pattern in ZS11 (without the insertion) and ZY821 (with the insertion). (d, e) Allelic variation in BnaC02.MYB28 expression (d) and seed glucosinolate contents (e) between the accessions with presence (n = 77) or absence (n = 100) of the 901-bp insertion. (f) Correlation between seed glucosinolate content and BnaC02.MYB28 expression in B. napus population. (gi) Local Manhattan plots of SV-GWAS of leaf (g) and seed (h) glucosinolate contents. The causal SV near BnaC07.MYB28 (i) was separated from the other LD block containing BnaC07.MYB34. (j) Local Manhattan plot of eQTL of BnaC07.MYB28 expression. For the legends, see Extended Data Fig. 2f. The gray dashed line represents the Bonferroni-corrected significance threshold (two-sided P = 1.86 × 10−5). (km) Allelic variation in BnaC07.MYB28 expression levels (k) and total glucosinolate contents in leaves (l) and seeds (m) between the accessions with (n = 100) or without (n = 173) the 9,374-bp deletion. (n) Correlation between seed glucosinolate content and BnaC07.MYB28 expression in B. napus population. (o) Screenshot showing that the 9,374-bp deletion increases chromatin accessibility in the promoter region of BnaC07.MYB28, potentially enhancing gene expression for higher glucosinolate content. The middle two panels show difference of the enrichment of chromatin accessibility (ATAC-Seq) in the promoter region (indicated by an arrow) of BnaC07.MYB28 in two representative accessions (ZY821 with the deletion and ZS11 without the deletion). The bottom three panels show long-reads coverage supporting the SV’s existence with BnaC07.MYB28. In (a), (g) and (h), see Extended Data Fig. 2d for the legends of symbols and statistical test for GWAS. In (d), (e), (km), see Fig. 2i for the legends of boxplots and P values. In (f) and (n), see Fig. 6g for the legends of statistical test and P value.
Extended Data Fig. 5
Extended Data Fig. 5. Identification of three pairs of SVs/InDel─key genes affecting glucosinolate contents.
(a, b) Local Manhattan plots of SV-GWAS highlighting a target InDel significantly associated with total glucosinolate contents in leaves (a) and seeds (b). (ce) The causal InDel identification and gene re-annotation. This 4-bp InDel locates in one of two contiguous BnaA09.MYB28s in the ZS11 reference genome (c), but the single-molecule long-read isoform sequencing (Iso-seq) revealed only one gene in this region (d), and leading to re-annotation as one single gene BnaC09.MYB28ZY (e). (f) Sequence comparison of DNA and amino acids of BnaC09.MYB28 between ZS11 and ZY7. (g, h) Population allelic variation in glucosinolate contents in leaves (g) and seeds (h) between the accessions with or without the 4-bp deletion (n = 237 and n = 95 for leaves; n = 218 and n = 92 for seeds), suggesting the 4-bp deletion increases glucosinolate contents. (i, j) Local Manhattan plots of SV-GWAS highlighting a target 1,339-bp insertion significantly associated with Indol-3-ylmethyl glucosinolate content (i) and total indolic glucosinolate content (j) in leaves. (k, l) Diagram showing the 1,339-bp insertion in the promoter region of BnaA02.MYB34 (k) in a cis-eQTL (l). (m, n) Population allelic variation in BnaA02.MYB34 expression (m) and total indolic glucosinolate content (n) between the accessions with (n = 11) or without (n = 143) the 1,339-bp insertion, indicating the insertion decreases total indolic glucosinolate content through downregulating BnaA02.MYB34 expression. (o) Local Manhattan plot of SV-GWAS highlighting a 367-bp deletion significantly associated with total seed glucosinolate contents. (p, q) Diagram showing the 367-bp deletion in upstream of BnaA09.GTR2b (p) in a cis-eQTL (q). (r) Expression patterns of BnaA09.GTR2b and BnaA09.GTR2a in ZS11 (with the deletion) and ZY821 (without the deletion). (s, t) Population allelic variation in BnaA09.GTR2b expression (s) and total seed glucosinolate contents (t) between the accessions with (n = 241) or without (n = 49) the 367-bp deletion. In (a, b), (i, j) and (o), see Extended Data Fig. 2d for the legends of symbols and statistical test for GWAS. In (g, h), (m, n) and (s, t), see Fig. 2i for the legends of boxplots and P values. In (l) and (q), see Extended Data Fig. 2f for the legends. The gray dashed line represents the Bonferroni-corrected significance threshold for eQTL (two-sided P = 1.83 × 10−5 for BnaA02.MYB34 and two-sided P = 1.80 × 10−5 for BnaA09.GTR2b).
Extended Data Fig. 6
Extended Data Fig. 6. A TE insertion increasing silique length by cis- and trans-regulating expression of downstream genes.
(a) Local Manhattan plot of SV-GWAS highlighting a 3.7-kb insertion (red triangle arrow) significantly associated with silique length. See Extended Data Fig. 2d for the legends. The gray dashed line represents the Bonferroni-corrected significance threshold (two-sided P = 1.84 × 10−5). (b) Local Manhattan plot of TWAS showing an association between gene expression in siliques at 18 DAP and silique length in which BnaA09.CYP78A9 exhibits a most significant association. See Fig. 4c for the legends. The gray dashed line represents the Bonferroni-corrected significance threshold (two-sided P = 1.80 × 10−5). (c) Colocalization analysis of the eQTL regulating BnaA09.CYP78A9 expression in silique at 18 DAP (x axis) and GWAS QTL of silique length (y axis), suggesting a causal SV (insertion) that is 3.7 kb transposable element (TE). See Fig. 4d for the legends. The horizontal and vertical gray dashed lines represent the Bonferroni-corrected significance threshold of GWAS (two-sided P = 1.84 × 10−5) and eQTL (two-sided P = 1.83 × 10−5), respectively. (d) Diagram showing that the 3.7-kb insertion is cis-eSV upstream of 5’-end of the target gene BnaA09.CYP78A9. Blue pentagon with IAA indicates auxin compounds. (e) Population allelic variation in BnaA09.CYP78A9 expression level between the accessions with (n = 162) or without (n = 21) the insertion in the population. (f) Expression of the downstream auxin-responsive genes upregulated by the 3.7-kb insertion in trans-eQTL hotspot-197 (n = 162 with insertion and n = 60 without insertion). (g) Population allelic variation in silique length between the accessions with (n = 162) or without (n = 21) the insertion in the population. (h) Local Manhattan plots of eQTL on expression of BnaA09.CYP78A9 and seven downstream auxin-responsive genes. See Extended Data Fig. 2f for the legends. The gray dashed line represents the Bonferroni-corrected significance threshold (two-sided P = 1.83 × 10−5). In (eg), see Fig. 2i for the legends of boxplots and P values.
Extended Data Fig. 7
Extended Data Fig. 7. Summary of SV impact on glucosinolates biosynthesis and transport, and selective sweep on loci governing glucosinolate content and editing of BnaA09.GTR2.
(a) Summary of SV impact on gene expression in the glucosinolate biosynthesis and transport pathways in B. napus. Bold arrows represent glucosinolate biosynthesis, degradation and transport reactions; dash arrows indicate the transport steps. The three numbers in brackets beside each gene, such as MAMs (13, 6, 7), represent: 13 is the total number of homologous genes that have SV-eQTL, 6 is the total number of homologous genes whose expression levels were significantly associated with glucosinolate contents in TWAS, and 7 is the total number of homologous genes that locate in SV-GWAS loci of glucosinolate contents. Genes were named based on function annotation and their orthologous/syntenic relationship with Arabidopsis. Pathway information from previous publications,,. (b) The frequencies of eSV haplotypes (identified in Fig. 7a) determining leaf and seed total glucosinolate contents. (c) The correlation between total glucosinolate contents of leaves and seeds in a B. napus population. See Fig. 6g for the legends of statistical test and P value. (d) The linked key genes MYB28, MYB34 and GTR2 on three B. napus chromosomes A09, C02 and C09 are syntenic to an ancestral block in A. thaliana Chromosome 5. (e, f) Selective sweep loci governing glucosinolate content in leaves (e) and seeds (f). The values of πLH (the ratio of nucleotide diversity) and FST (genome differentiation) were estimated from SVs between the accessions with extremely high (H, top 20%) and extremely low (L, bottom 20%) glucosinolate contents. The horizontal gray dash lines are the genome-wide thresholds for selective sweeps. The vertical dash lines show the loci with both GWAS and selection signals containing BnaMYB28, BnaMYB34 and BnaGTR2. (g) Characterization of BnaA09.GTR2b edited using CRISPR/Cas9 in ZY821. The protospacer adjacent motif (PAM) is highlighted in bold (CCA and CCG). CRISPR/Cas9 sgRNA-1 and sgRNA-2 targeting the first and second exons of BnaA09.GTR2b, respectively, are shown in red. The blue letters and hyphens indicate insertions and deletions in edited plants, respectively.

References

    1. Ho, S. S., Urban, A. E. & Mills, R. E. Structural variation in the sequencing era. Nat. Rev. Genet.21, 171–189 (2020). - PMC - PubMed
    1. Alonge, M. et al. Major impacts of widespread structural variation on gene expression and crop improvement in tomato. Cell182, 145–161 (2020). - PMC - PubMed
    1. Chiang, C. et al. The impact of structural variation on human gene expression. Nat. Genet.49, 692–699 (2017). - PMC - PubMed
    1. Liu, Y. et al. Pan-genome of wild and cultivated soybeans. Cell182, 162–176 (2020). - PubMed
    1. Li, N. et al. Super-pangenome analyses highlight genomic diversity and structural variation across wild and cultivated tomato species. Nat. Genet.55, 852–860 (2023). - PMC - PubMed