. 2024 Jan-Dec;16(1):2421623.
doi: 10.1080/19490976.2024.2421623. Epub 2024 Nov 5.

Giardia antagonizes beneficial functions of indigenous and therapeutic intestinal bacteria during protein deficiency

Affiliations

Giardia antagonizes beneficial functions of indigenous and therapeutic intestinal bacteria during protein deficiency

Aadra P Bhatt et al. Gut Microbes. 2024 Jan-Dec.

Abstract

Undernutrition in children commonly disrupts the structure and function of the small intestinal microbial community, leading to enteropathies, compromised metabolic health, and impaired growth and development. The mechanisms by which diet and microbes mediate the balance between commensal and pathogenic intestinal flora remain elusive. In a murine model of undernutrition, we investigated the direct interactions Giardia lamblia, a prevalent small intestinal pathogen, on indigenous microbiota and specifically on Lactobacillus strains known for their mucosal and growth homeostatic properties. Our research reveals that Giardia colonization shifts the balance of lactic acid bacteria, causing a relative decrease in Lactobacillus spp. and an increase in Bifidobacterium spp. This alteration corresponds with a decrease in multiple indicators of mucosal and nutritional homeostasis. Additionally, protein-deficient conditions coupled with Giardia infection exacerbate the rise of primary bile acids and susceptibility to bile acid-induced intestinal barrier damage. In epithelial cell monolayers, Lactobacillus spp. mitigated bile acid-induced permeability, showing strain-dependent protective effects. In vivo, L. plantarum, either alone or within a Lactobacillus spp consortium, facilitated growth in protein-deficient mice, an effect attenuated by Giardia, despite not inhibiting Lactobacillus colonization. These results highlight Giardia's potential role as a disruptor of probiotic functional activity, underscoring the imperative for further research into the complex interactions between parasites and bacteria under conditions of nutritional deficiency.

Keywords: Giardia; bile acids; gnotobiotic models; malnourishment; probiotics.


Conflict of interest statement

No potential conflict of interest was reported by the author(s).

Figures
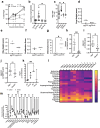
Figure 1.
Figure 1.
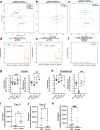
Giardia alters markers of intestinal epithelial cell homeostasis that are associated with commensal bacteria functions. A-C) relative gene expression of innate mucosal responses in jejunum of pd-fed PBS controls and 10 days after giardia challenge as indicated: (a) MMP7 (b) RegIIIγ, (c) IL22. *p < .05 and **p < .01, mann-whitney test, N = 6 per group. (d) Growth as % initial weight of CD or pd-fed PBS controls or giardia-challenged mice. Three-week-old specific pathogen free (SPF) mice were acclimated to respective diets for 10 days prior to challenge with 105 G. lamblia cysts or PBS. *p < .05, ****p < .0001 two-way ANOVA with Tukey’s post hoc analysis for pd-giardia vs. PD (mean ± SEM, N = 6 per group). (e) Enumeration of crypts isolated from the small intestine of mice in figure E. *p<.05, Kruskal-Wallis with Dunn’s test for multiple comparisons as indicated, N = 6 per group (median ± IQR). Morphometry as assessed by scores for crypt (f) and villus (g) heights or overall proliferation (h) does not appreciably differ in pd-fed mice irrespective of giardia infection, whereas inflammation scores are higher in giardia infected pd-fed mice (*p<.05 by mann-whitney test). (j) Compared to mock, giardia infection increases PAS+ staining in villus/crypt (V:C) units in cd-fed mice, a difference that is lost in pd-fed mice. (k) Relative expression of oligopeptide transporter PepT1 in duodenum of CD or pd-diet fed PBS controls and 10 days after giardia challenge. *p<.05, mann-whitney, N = 3 per group. For A-C & K, data are shown as ΔΔ to β-actin housekeeping gene and normalized to PBS controls (median ± IQR). (l) Heatmap representation of ratio of free amino acids measured in serum to fecal compartments [log transformed] in pd-diet fed PBS controls and 10 days after giardia challenge. (m) Free amino acids in serum normalized to concomitant measurement of serum FITC as a measure of intestinal permeability. *p<.05, **p<.01, multiple t-tests, Benjamini, Krieger, and yekutielie 2-step method with FDR 5% (median ± IQR, N = 6 per group).
Figure 2.
Figure 2.
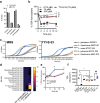
Giardia differentially alters Lactobacillus and bifidobacterium abundances in protein-deprived mice. (a) PCoA plots of fecal taxonomic profiles at genus level from mice fed either a control diet (CD) or an isocaloric protein deficient diet (PD). Samples were collected 10 days after challenge with 105 G. lamblia cysts (GIARDIA) or PBS as indicated (N = 6 mice per group, N = 2-3 cages per group). (b) PCoA plot of CD_Giardia and CD_PBS. Fecal taxonomic profiles at genus level were not significantly different between CD_Giardia and CD_PBS (PERMANOVA test: R2 = 0.0269, p = 0.898). (c) PCoA plot of PD_Giardia and PD_PBS. Fecal taxonomic profiles at genus level were significantly different between PD_Giardia and PD_PBS (PERMANOVA test: R2 = 0.221, p = 0.045). Normalized abundances (log10, median ± IQR) of lactobacillaceae (d), Lactobacillus (e) and bifidobacterium (f). FDR < 0.1, Mann-Whitney U-test. Abundances of Lactobacillus and bifidobacterium by qPCR from paired fecal (g) and duodenum (h) samples as labeled. Data are represented as relative to total 16S qPCR. *p < .05, **p < .01, Kruskal-Wallis with Dunn’s test for multiple comparisons as indicated, N = 6 per group. (e) Ratios of abundances of Lactobacillus:bifidobacterium in fecal samples from PD- fed, PBS- or giardia-challenged mice from individual representative experiment: day 0 of giardia challenge (i) and day 9 after giardia challenge (j). *p < .5 (Mann-Whitney U-test, median ± IQR, N = 5-8 per group. (k) Ratios of relative abundances of Lactobacillus:bifidobacterium in fecal samples from pd-diet fed giardia challenged or PBS control mice aggregated day 9-11 after giardia challenge from three independent experiments, N = 16-19 per group. ****p<.001 (Mann-Whitney U-test, median ± IQR, N = 6 per group).
Figure 3.
Figure 3.
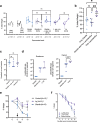
Protein deficiency restricts conversion of intestinal primary to secondary bile acids regardless of giardia challenge. (a) sPLS-DA of faecal bile acids from mice fed a protein-deficient diet compared with the control diet (CD). (b) Volcano plot displays the significant bile acids in fecal samples with PD diet compared to control diet (CD). Taurine-conjugated (taurolithocholic acid, taurocholic acid, and taurodeoxycholic acid) and secondary bile acids (alphamuricholic acid, omegamuricholic acid, gammamuricholic acd, lithocholic acid, and deoxycholic acid) were identified as underrepresented in protein deficient diet (blue dots). In contrast, glycine-conjugated (glycocholic acid, glycochenodeoxycholic acid) and primary bile acids (cholic acid and chenodeoxycholic acid) were overrepresented in protein deficient diet (red dots) ((wilcoxon rank-sum test, 10% FDR). (c) Comparisons between total, conjugated, unconjugated, primary and secondary bile acids. *p < .05, **p < .01, two-way ANOVA with Tukey’s posttest analysis for multiple comparisons (median ± IQR, N = 6 per group). (d) Percentage of total bile acids represented by primary, secondary, conjugated and unconjugated types. *p < .001 for PD_PBS or PD_Giardia vs. CD_PBS and giardia groups combined. Two-way ANOVA with Tukey’s posttest analysis for multiple comparisons (median ± IQR = 6-12 per group). (e) Ratios of primary:secondary bile acids in aggregate groups by dietary or giardia exposure (left) and individual groups (right). ****p < .05, *p < .01 for indicated groups. Kruskal-Wallis with Dunn’s test for multiple comparisons as indicated, (median ± IQR, N = 6 per group). (f) Ratios of conjugated:unconjugated bile acids in aggregate groups by dietary or giardia exposure (left) and individual groups (right). *p < .05 for indicated groups. Kruskal-Wallis with Dunn’s test for multiple comparisons as indicated, (median ± IQR, N = 6 per group).
Figure 4.
Figure 4.
Protein deficiency increases circulating bile acids including chenodeoxycholic acid which correlates with severity of intestinal permeability in giardia challenged mice. (a) sPLS-DA analysis of serum bile acids in mice fed a protein-deficient diet (PD) compared to mice fed a 20% protein diet (CD). (b): volcano plot showing the significant abundance of serum bile acids in PD diet (wilcoxon rank-sum test, 10% FDR) with increased levels of glycine-conjugated bile acids (glycocholic acid), taurine-conjugated bile acids (taurocholic acid), and secondary bile acids (alphamuricholic acid and betamuricholic acid), (red dots in the volcano plot). (c) Comparisons between total, conjugated, unconjugated, primary and secondary bile acids. *p < .05, multiple t-tests, Benjamini, Krieger, and yekutielie 2-step method with FDR 5% (median ± IQR, N = 6 per group). (d) Correlation between serum FITC (ng/mL) and chenodeoxycholic acid (nmol/mL) in pd-diet fed mice (left, all mice; middle, only PBS controls; right only giardia challenged mice). Simple linear regression (N = 6 per group), R2 = 0.009238.
Figure 5.
Figure 5.
Physiological bile acids differentially support lactobacillus spp. growth and protective functions of lactobacillus on bile-acid induced intestinal epithelial cell barrier injury are strain specific. (a) Compositional analysis by percentage of total bile acids represented by primary, secondary, conjugated and unconjugated types present in physiological bile acids mixture when dissolved in DMEM (pBA 1%) or protozoan media (TYI-S-33). (b) Transepithelial cell electrical resistance (TER) as % change from baseline in T-84 monolayers exposed do different concentrations of pBA in DMEM (0.1, 1.0 and 10%) or TYI-S-33 media containing 0.1% pBA. *p < .05, two-way ANOVA for 0.1% pBA vs either 1% pBA or TYI-S-33 media, **p < .001. Two-way ANOVA with Tukey’s posttest analysis for multiple comparisons for 10% pBA vs 0.1% pBA (median ± IQR, N = 3 wells group). (c) Growth curves of different lactobacillus strains in MRS media (left) or TYI-S-33 (right). Shown are means of at least 6 technical replicates from each strain. For L. plantarum and L. rhamnosus_AMC143, curves are the mean of two separate biological replicates with at least technical six replicates each (d) heat map of bile acid profiles in TYI-S-33 media after 24 hours of growth of lp or Lr_AMC143 relative to baseline fresh media. (e) TER as % change from baseline in T-84 monolayers exposed to TYI-S-33 with either log-phase 106 lp or Lr_AMC143 or bacteria-free media. * p < 0.05, ** p < 0.01 for bacteria-free vs lp and # p < 0.05 for lp vs Lr_AMC143, two-way ANOVA with Tukey’s posttest analysis for multiple comparisons (mean ± IQR, N = 3 per group). (f) Baseline TER at 30 minutes after media change from DMEM to TYI-S-33 alone, or TYI-S-33 containing log-phase 106 lp or Lr_AMC143, or filter-sterilized conditioned TYI-S-33 wherein lp or Lr_AMC143 were cultured for 24 hours, as indicated. *p < .05 for DMEM vs 10% BA (Kruskal-Wallis with Dunn’s correction for multiple comparisons DMEM vs 10% BA or 1% BA), ****p < .05 for DMEM or 1% BA vs UCM and UCMLr and UCMLp (Kruskal-Wallis with Dunn’s test for multiple comparisons DMEM vs 1% BA, UCM, UCMLr, and UCMLp). *p < .01 for CMLr vs CMLp (mann-whitney U-test) (median ± IQR, N = 3-6 per group).
Figure 6.
Figure 6.
Giardia directly antagonizes growth-promoting lactobacillus spp. in gnotobiotic mouse models of protein malnutrition. (a) Growth as % weight on the day of microbial challenge (0), beginning two weeks prior to and through 1 after challenge with PBS or fecal microbiota from SPF protein deficient mice (FMT), and two weeks after challenge with either 104 axenic G. lamblia cysts or 106 lactobacillus strains alone or together as indicated. L. spp. mix = 106 each of lj, lp, Lr_AMC010, Lr_AMC143, and L. casei. Three- to six-week-old germ-free (GF) mice were fed a protein deficient diet for the two weeks prior to transfer from isolators and oral gavage with indicated microbial challenge. Experiments were performed sequentially due to limited availability of age-matched GF mice. ++++p < 0.0001 for PBS vs FMT (week 0-1); ^^p < 0.01 lp vs giardia or Giardia+Lj (week 0-2); *p < .05 for L. spp. mix vs Giardia+ L. spp. mix, **p < .01 for L. spp. mix vs giardia, *p < .001 for L. spp. mix vs Giardia+Lj, two-way ANOVA with Tukey’s posttest analysis for multiple comparisons (mean ± SEM, N = 3-5 per group). (b) Growth as % initial weight through two weeks aggregated by presence or absence of giardia challenge or any lactobacillus strain. ****p < .05, *p < .01 (Kruskal-Wallis with Dunn’s correction for multiple comparisons, median ± IQR, N = 5-9 per group). (c) giardia trophozoites in the small intestine in mono-associated mice and mice co-colonized with giardia and lactobacillus strains recovered two weeks after colonization (Kruskal-Wallis with Dunn’s test for multiple comparisons, median ± IQR, N = 5 per group). (d) lactobacillus colony recovery two weeks post colonization on MRS plates from small intestine and cecal tissues in giardia mono-associated mice, mice co-colonized with Giardia+L. spp. mix, and mice colonized with L. spp. mix without giardia (Kruskal-Wallis with Dunn’s test for multiple comparisons, median ± IQR, N = 3-5 per group). (e) Growth of 8-16 week old GF Rag2-/- mice as % initial weight following challenge with giardia or lp alone, or no microbial challenge (control). Mice were transitioned from control to protein deficient diet on day 5 as indicated by the arrow. ^^P < 0.01, ^^^P < 0.001 lp vs giardia and *p<.05 control vs Giardia; two-way ANOVA with Tukey’s posttest analysis for multiple comparisons (mean ± SEM, N = 10-15 per group. (f) Growth of a subset of control (N = 5) or lp-mono-associated (N = 12) Rag2-/- mice for 13 days as % change following secondary challenge with either giardia or PBS as indicated. Mice remained on a protein deficient diet. ^^P < 0.01 for lp-gl vs lp-pbs and *p < .001 for control-gl vs lp-pbs. Two-way ANOVA with Tukey’s posttest analysis for multiple comparisons (mean ± SEM, N = 5-6 per group).

Update of

References

    1. Roth DE, Krishna A, Leung M, Shi J, Bassani DG, Barros AJD.. Early childhood linear growth faltering in low-income and middle-income countries as a whole-population condition: analysis of 179 demographic and health surveys from 64 countries (1993–2015). Lancet Glob Health. 2017;5(12):e1249–24. doi:10.1016/S2214-109X(17)30418-7. - DOI - PMC - PubMed
    1. Benjamin-Chung J, Mertens A, Colford JM Jr., Hubbard AE, van der Laan MJ, Coyle J, Sofrygin O, Cai W, Nguyen A, Pokpongkiat NN, et al. Early-childhood linear growth faltering in low- and middle-income countries. Nature. 2023;621(7979):550–557. doi:10.1038/s41586-023-06418-5. - DOI - PMC - PubMed
    1. Bartelt LA, Bolick DT, Guerrant RL.. Disentangling microbial mediators of malnutrition: modeling environmental enteric dysfunction. Cell Mol Gastroenterol Hepatol. 2019;7(3):692–707. doi:10.1016/j.jcmgh.2018.12.006. - DOI - PMC - PubMed
    1. Vonaesch P, Araujo JR, Gody JC, Mbecko JR, Sanke H, Andrianonimiadana L, Naharimanananirina T, Ningatoloum SN, Vondo SS, Gondje PB, et al. Stunted children display ectopic small intestinal colonization by oral bacteria, which cause lipid malabsorption in experimental models. Proc Natl Acad Sci U S A. 2022;119(41):e2209589119. doi:10.1073/pnas.2209589119. - DOI - PMC - PubMed
    1. Chen RY, Kung VL, Das S, Hossain MS, Hibberd MC, Guruge J, Mahfuz M, Begum SMKN, Rahman MM, Fahim SM, et al. Duodenal microbiota in stunted undernourished children with Enteropathy. N Engl J Med. 2020;383(4):321–333. doi:10.1056/NEJMoa1916004. - DOI - PMC - PubMed

MeSH terms

Substances

LinkOut - more resources