

BMI trajectories from birth to young adulthood associate with distinct cardiometabolic profiles
- PMID: 39501285
- PMCID: PMC11539615
- DOI: 10.1186/s12916-024-03741-0
BMI trajectories from birth to young adulthood associate with distinct cardiometabolic profiles
Abstract
Background: Numerous studies have investigated links between body mass index (BMI) trajectories and cardiovascular risk, yet discrepancies in BMI measurement duration and timing of the cardiovascular-related outcome evaluation have led to inconsistent findings.
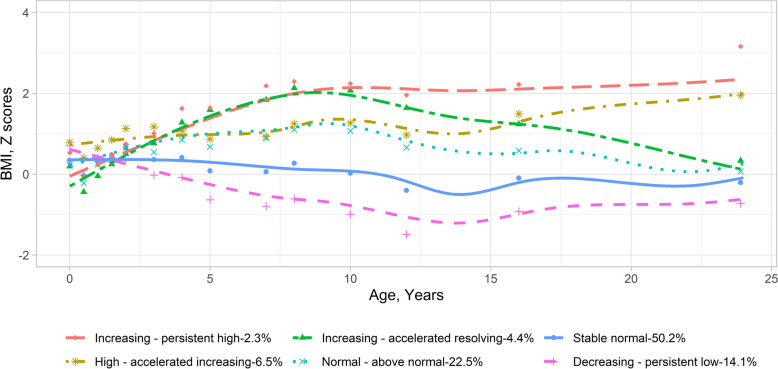
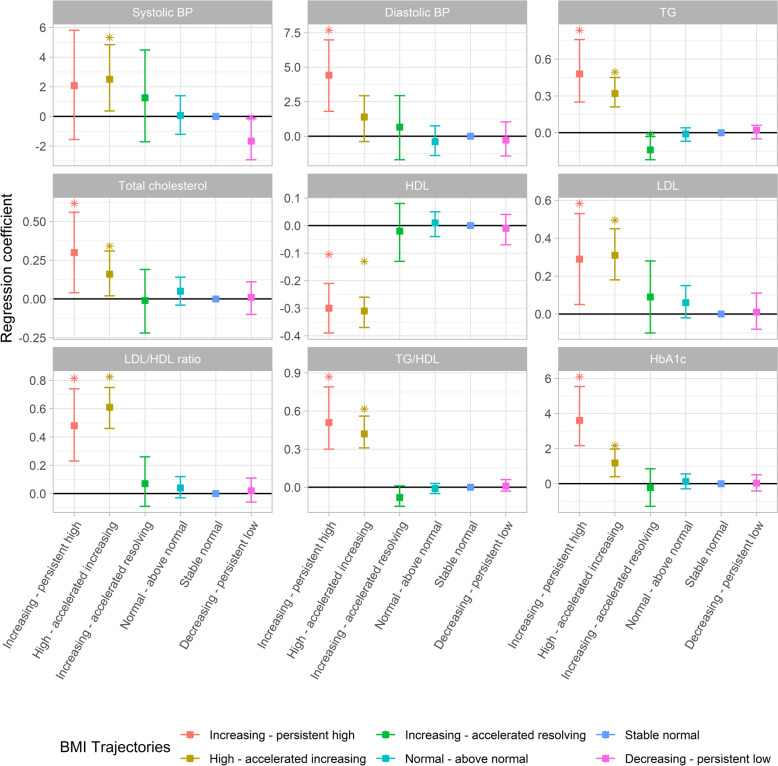
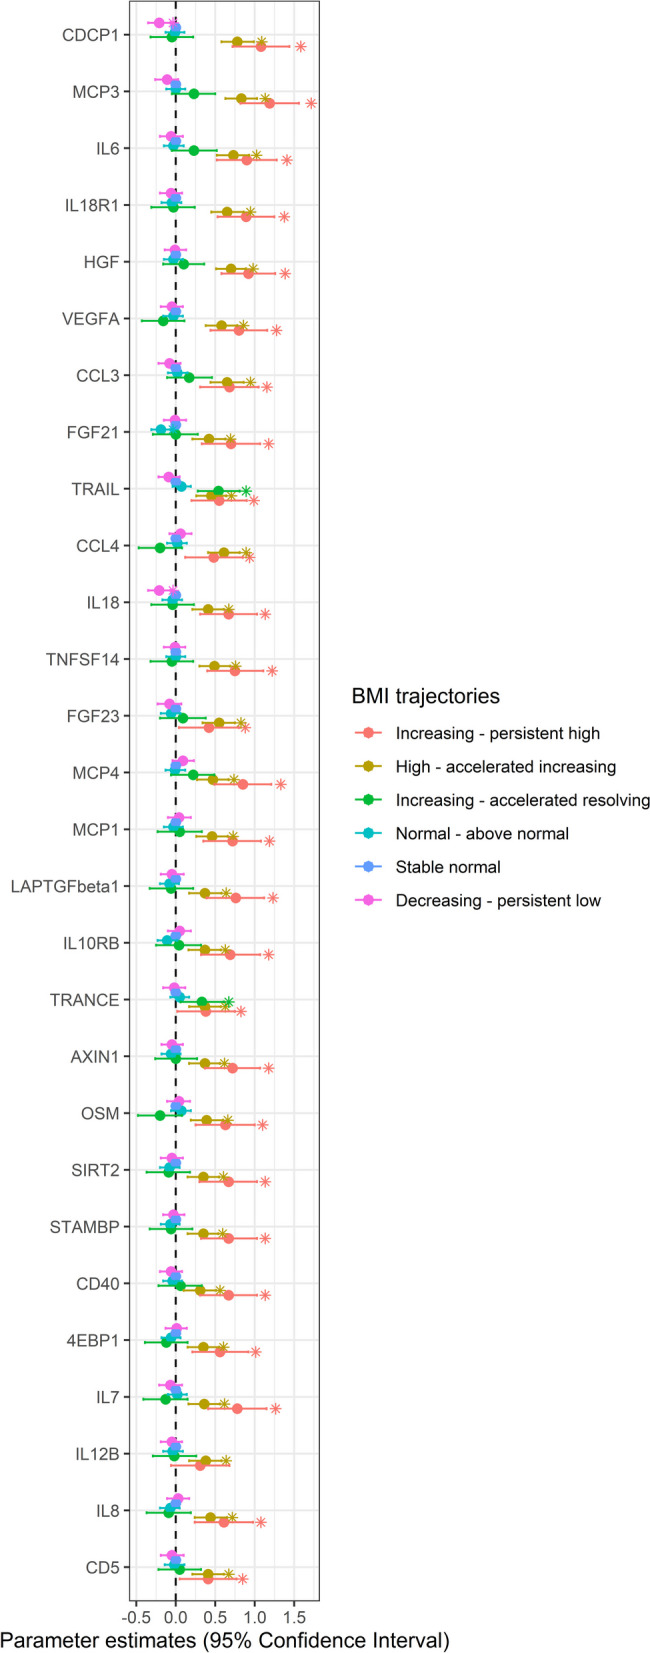
Methods: We included participants from the Swedish birth cohort (BAMSE) and applied latent class mixture modeling to identify BMI trajectories using data of multiple BMI measures (≥ 4 times) from birth until 24-year follow-up (n = 3204). Subsequently, we analyzed the associations of BMI trajectories with lipids (n = 1974), blood pressure (n = 2022), HbA1c (n = 941), and blood leukocytes (n = 1973) using linear regression. We also investigated the circulating levels of 92 inflammation-related proteins (n = 1866) across BMI trajectories.
Results: Six distinct BMI groups were identified, denoted as increasing-persistent high (n = 74; 2.3%), high-accelerated increasing (n = 209; 6.5%), increasing-accelerated resolving (n = 142; 4.4%), normal-above normal (n = 721; 22.5%), stable normal (n = 1608; 50.2%), and decreasing-persistent low (n = 450; 14.1%) BMI groups. The increasing-persistent high and high-accelerated increasing BMI groups had higher levels of total cholesterol [mean difference (95% confidence intervals): 0.30 (0.04-0.56) and 0.16 (0.02-0.31) mmol/L], triglyceride, low-density lipoprotein, hemoglobin A1C [3.61 (2.17-5.54) and 1.18 (0.40-1.98) mmol/mol], and low-density lipoprotein/high-density lipoprotein ratios, but a lower level of high-density lipoprotein than the stable normal BMI group. These two groups also had higher leukocyte cell counts and higher circulating levels of 28 inflammation-related proteins. No increased cardiometabolic markers were observed in the increasing-accelerated resolving BMI group.
Conclusions: Participants with persistently high or accelerated increasing BMI trajectories from birth to young adulthood have elevated levels of cardiometabolic risk markers at young adulthood than those with stable normal BMI. However, a raised BMI in childhood may not be inherently harmful to cardiometabolic health, provided it does not persist into adulthood.
Keywords: Bioimpedance; Childhood; HbA1c; Inflammation; Lipid.
© 2024. The Author(s).
Conflict of interest statement
The authors declare no competing interests.
Figures
Similar articles
-
Developmental trajectories of body mass index from childhood into late adolescence and subsequent late adolescence-young adulthood cardiometabolic risk markers.Cardiovasc Diabetol. 2019 Jan 19;18(1):9. doi: 10.1186/s12933-019-0813-5. Cardiovasc Diabetol. 2019. PMID: 30660185 Free PMC article.
-
Childhood maltreatment and biomarkers for cardiometabolic disease in mid-adulthood in a prospective British birth cohort: associations and potential explanations.BMJ Open. 2019 Mar 23;9(3):e024079. doi: 10.1136/bmjopen-2018-024079. BMJ Open. 2019. PMID: 30904846 Free PMC article.
-
Associations of early childhood body mass index trajectories with body composition and cardiometabolic markers at age 10 years: the Ethiopian infant anthropometry and body composition (iABC) birth cohort study.Am J Clin Nutr. 2024 May;119(5):1248-1258. doi: 10.1016/j.ajcnut.2024.03.004. Epub 2024 Mar 7. Am J Clin Nutr. 2024. PMID: 38458400
-
Body mass index trajectories in early childhood in relation to cardiometabolic risk profile and body composition at 5 years of age.Am J Clin Nutr. 2019 Nov 1;110(5):1175-1185. doi: 10.1093/ajcn/nqz170. Am J Clin Nutr. 2019. PMID: 31504088
-
The association between trajectories of risk factors and risk of cardiovascular disease or mortality among patients with diabetes or hypertension: A systematic review.PLoS One. 2022 Jan 27;17(1):e0262885. doi: 10.1371/journal.pone.0262885. eCollection 2022. PLoS One. 2022. PMID: 35085329 Free PMC article.
Cited by
-
Impact of age on cardiometabolic health in children at adiposity rebound: the role of genetic mechanisms.World J Pediatr. 2025 Mar;21(3):252-265. doi: 10.1007/s12519-025-00893-8. Epub 2025 Mar 18. World J Pediatr. 2025. PMID: 40097891 Review.
References
-
- Kelly T, Yang W, Chen CS, Reynolds K, He J. Global burden of obesity in 2005 and projections to 2030. Int J Obes (Lond). 2008;32(9):1431–7. - PubMed
-
- Van Gaal LF, Mertens IL, De Block CE. Mechanisms linking obesity with cardiovascular disease. Nature. 2006;444(7121):875–80. - PubMed
-
- Kan Y, Liu L, Li X, Pang J, Bi Y, Zhang L, et al. Association between distinct body mass index trajectories according to the group-based trajectory modeling and the risk of incident diabetes: a systematic review. Obes Rev. 2022;23(12):e13508. - PubMed
Publication types
MeSH terms
Substances
Grants and funding
LinkOut - more resources
Full Text Sources
